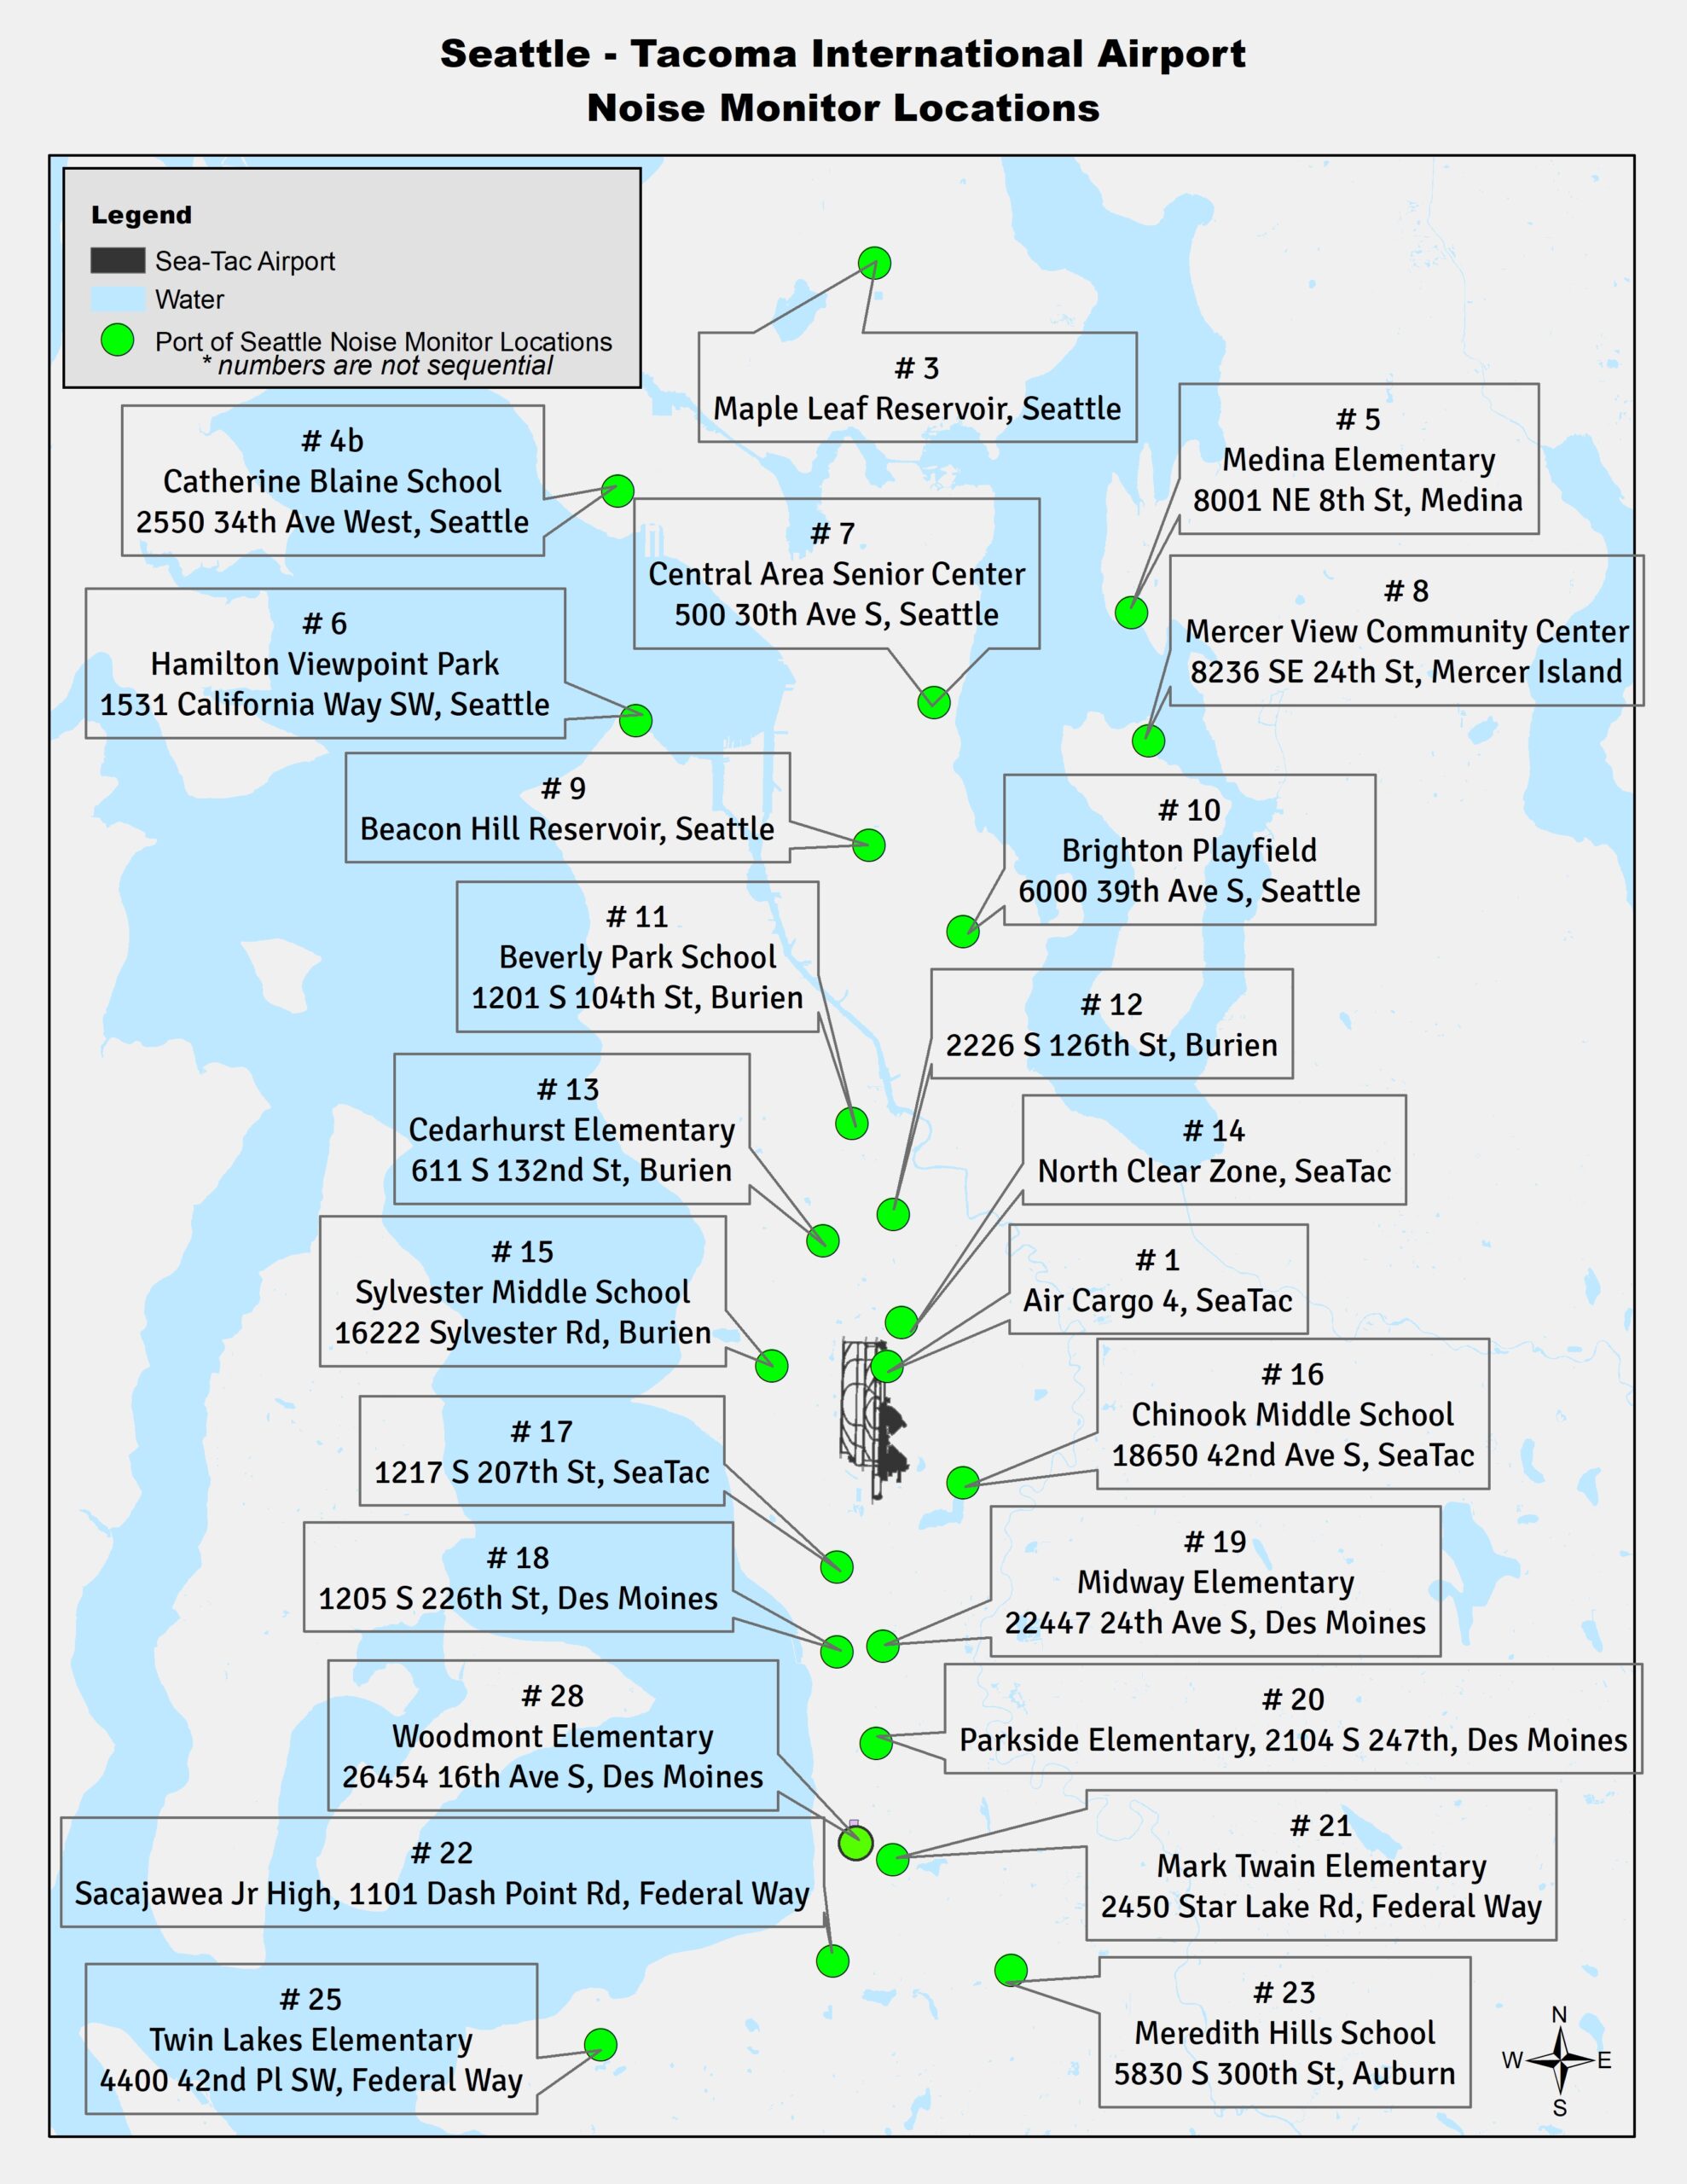
These first few reports and graphs are small steps in what we hope will be a larger project, including information on the effects to health, real estate and income. For now, they attempt to give residents a rough idea of the noise impacts to their neighborhood and this region using publicly available data from the Port Of Seattle’s own Noise Monitoring system. You can learn more about the entire system at the Port Of Seattle Aircraft Noise and Operations Portal.
- Noise monitoring is neither mandated or regulated by the FAA. The accuracy of this data is in no way guaranteed.
- The altitudes are spotty in earlier years, as are some other fields.
- Some options run slowly or even hang depending on the result set, or if the query is too complex.
- And, did we mention that sometimes the *Port of Seattle’s data source has exactly the same challenges?
If you are having difficulty or are interested in a particular query you don’t see here, please make a research request.
#1 Hourly Noise Detail Report
This first form shows you the average noise and number of flights at a given hour of the day (or night) for one or more locations over a range of dates.
Example: “Show me the average noise level near Des Moines Memorial Drive at 3pm from January to July of 2017”.
To Use: Select the Monitor which is nearest to your neighborhood, enter an hour of the day, the starting and ending dates to include, then press ‘Go’.
#2 Hourly Noise Summary Report
This second form below is a different take on the same data. It gives you the average noise and number of flights for each hour of the day over the range of dates you select.
Example: “Show me the average noise level near Des Moines Memorial Drive for each hour of the day from January to July of 2017”.
To Use: Select at least one Monitor, the starting and ending dates to include, then press ‘Go’.
#3 Daily Noise Summary Report
This third form below gives you a summary of the average noise and number of flights for the entire 24 hour period over the range of dates you select.
Example: “Show me the average noise level near Des Moines Memorial Drive from January to July of 2017”.
To Use: Select the Location/Monitor which is nearest to your neighborhood, the starting and ending dates to include, then press ‘Go’.
*Their system is based on work we originally began in 2016, with the assistance of former Commission President Tom Albro and Acting Director Dave Soike. We’re both using the same data, so it stands to reason that there will be limitations.

