TagNoise Countour(20)
-
 2032-01-01
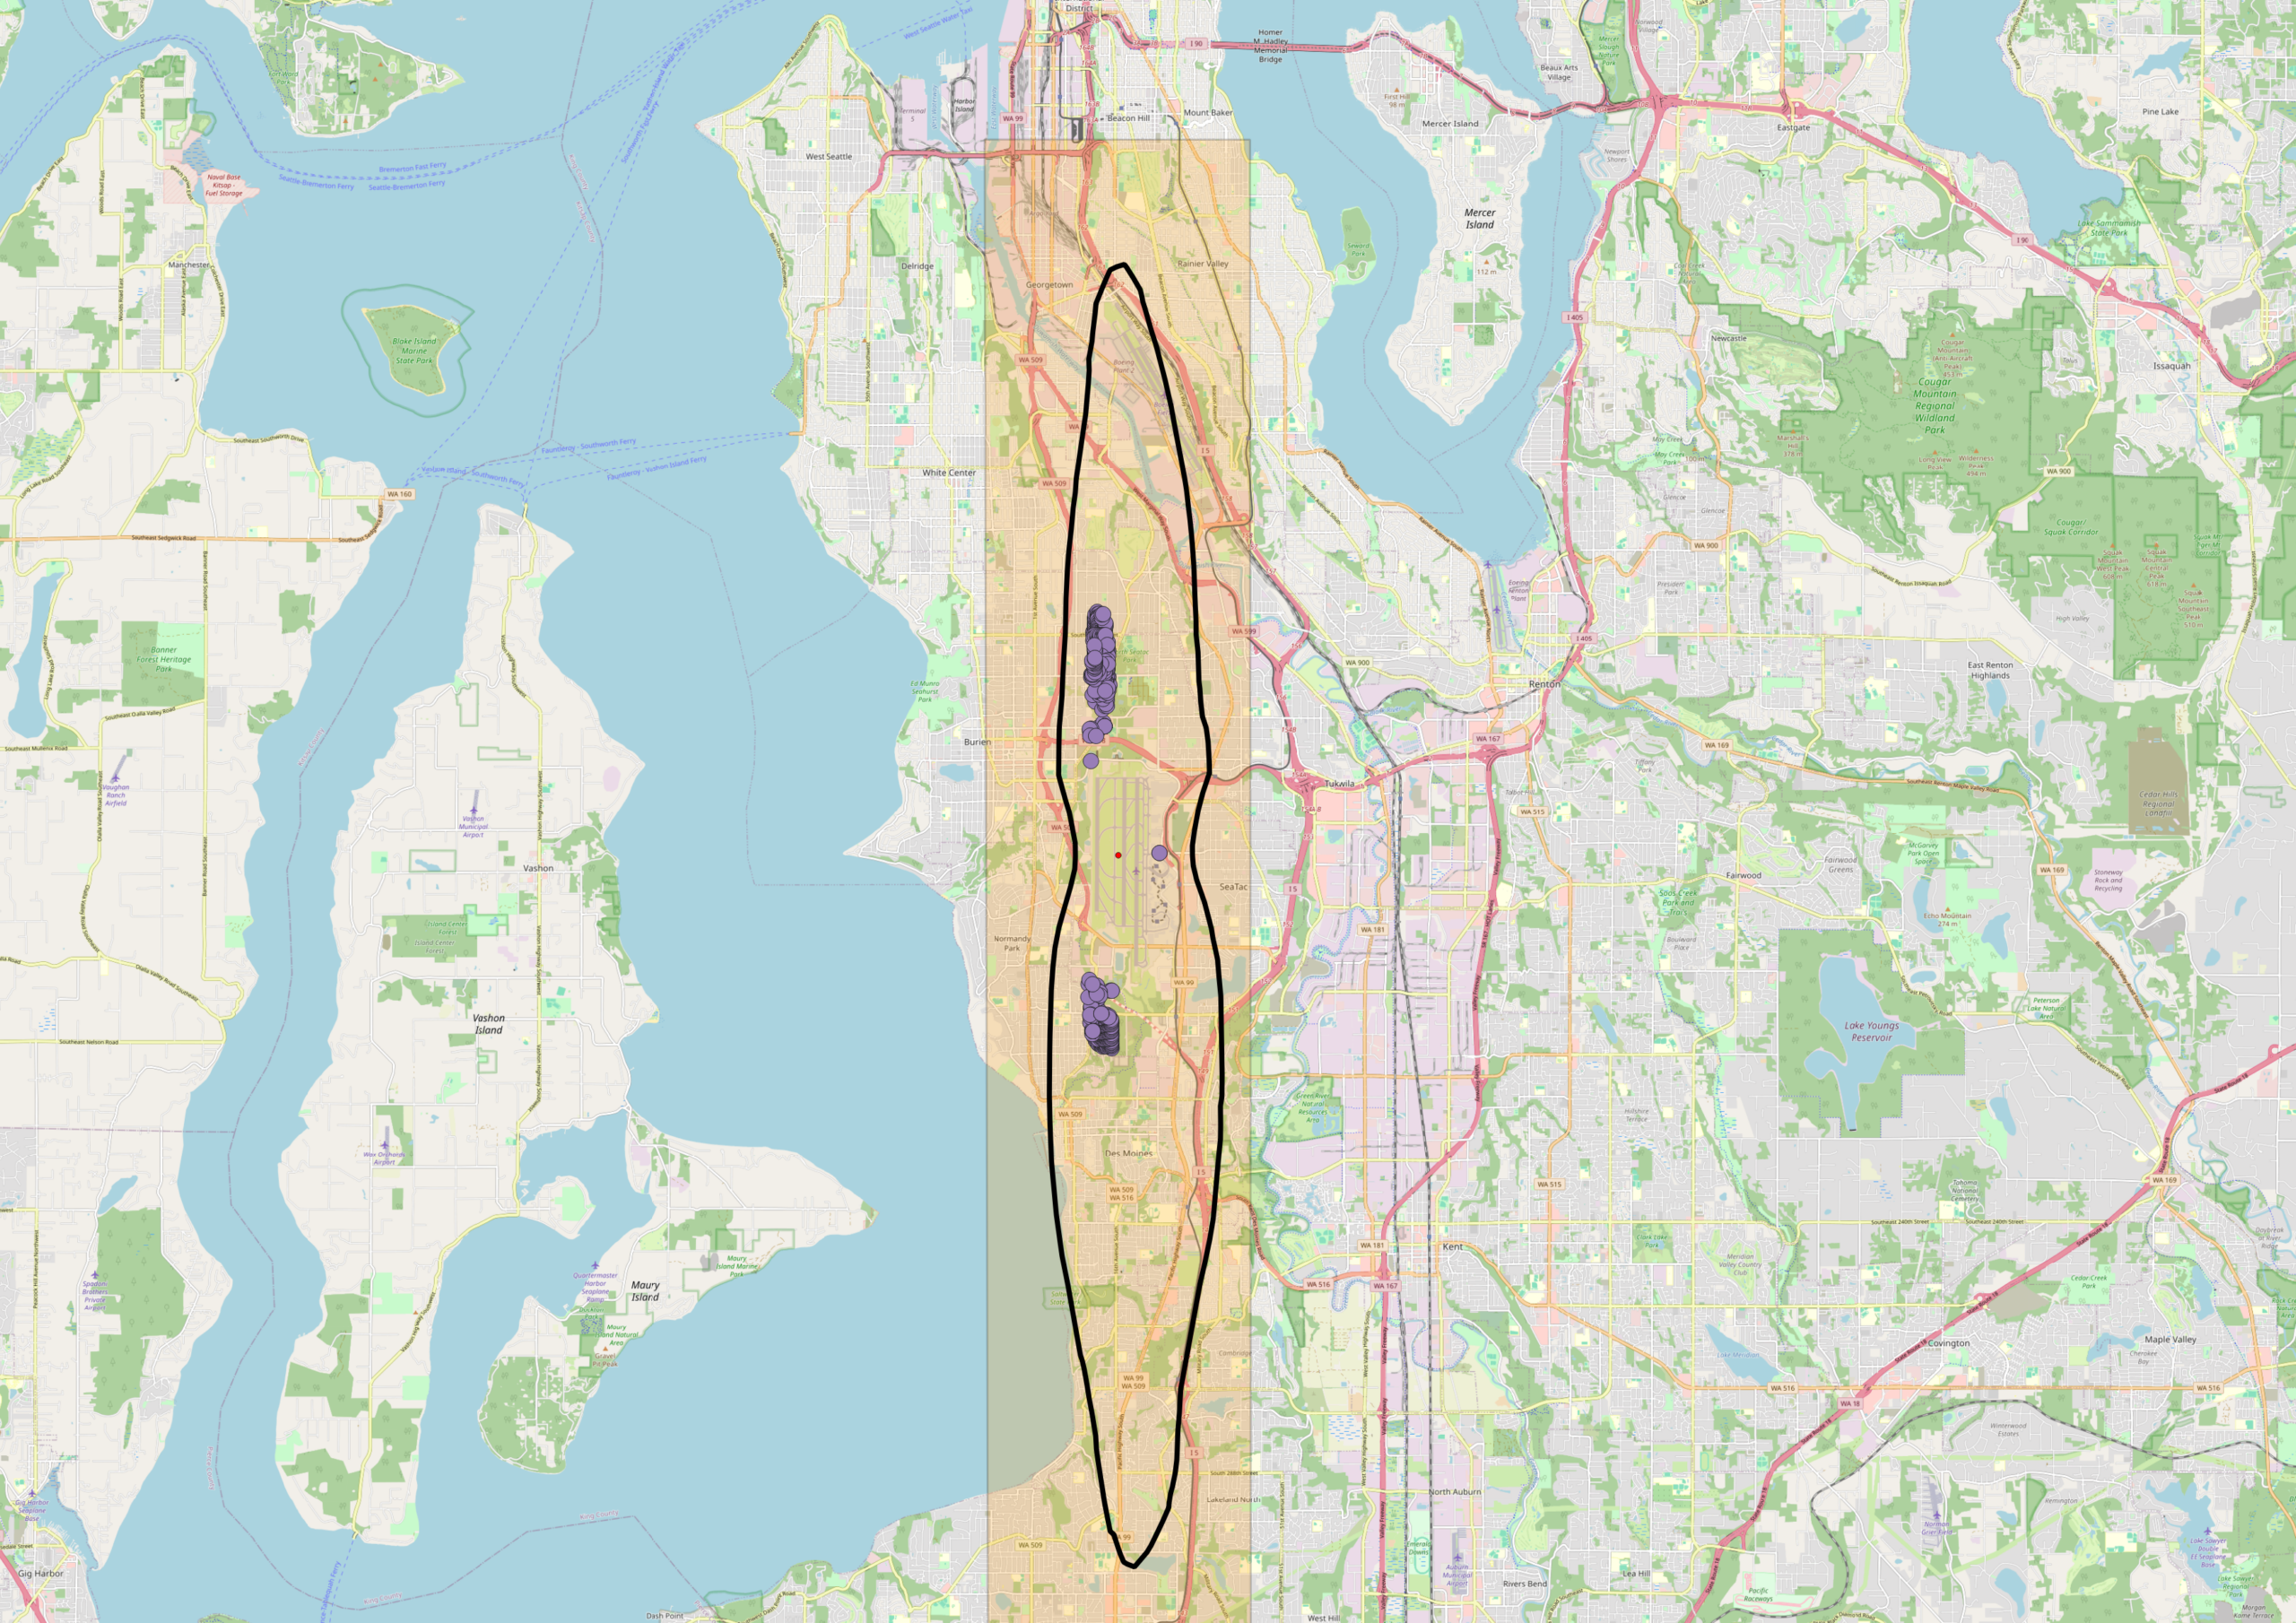
DNL 65 Noise Contour Map — Sea-Tac Airport Area with Noise Complaint Markers
An OpenStreetMap-based map centered on the Seattle–Tacoma (Sea-Tac) Airport area showing a highlighted corridor (shaded in orange/yellow) and a black oval outline delineating what appears to be a flight path or noise impact study zone. Clustered purple markers, likely representing noise complaint locations or monitoring stations, are visible near Burien and a southern cluster near Des Moines/Federal Way, with Sea-Tac Airport identifiable near the center of the map. -
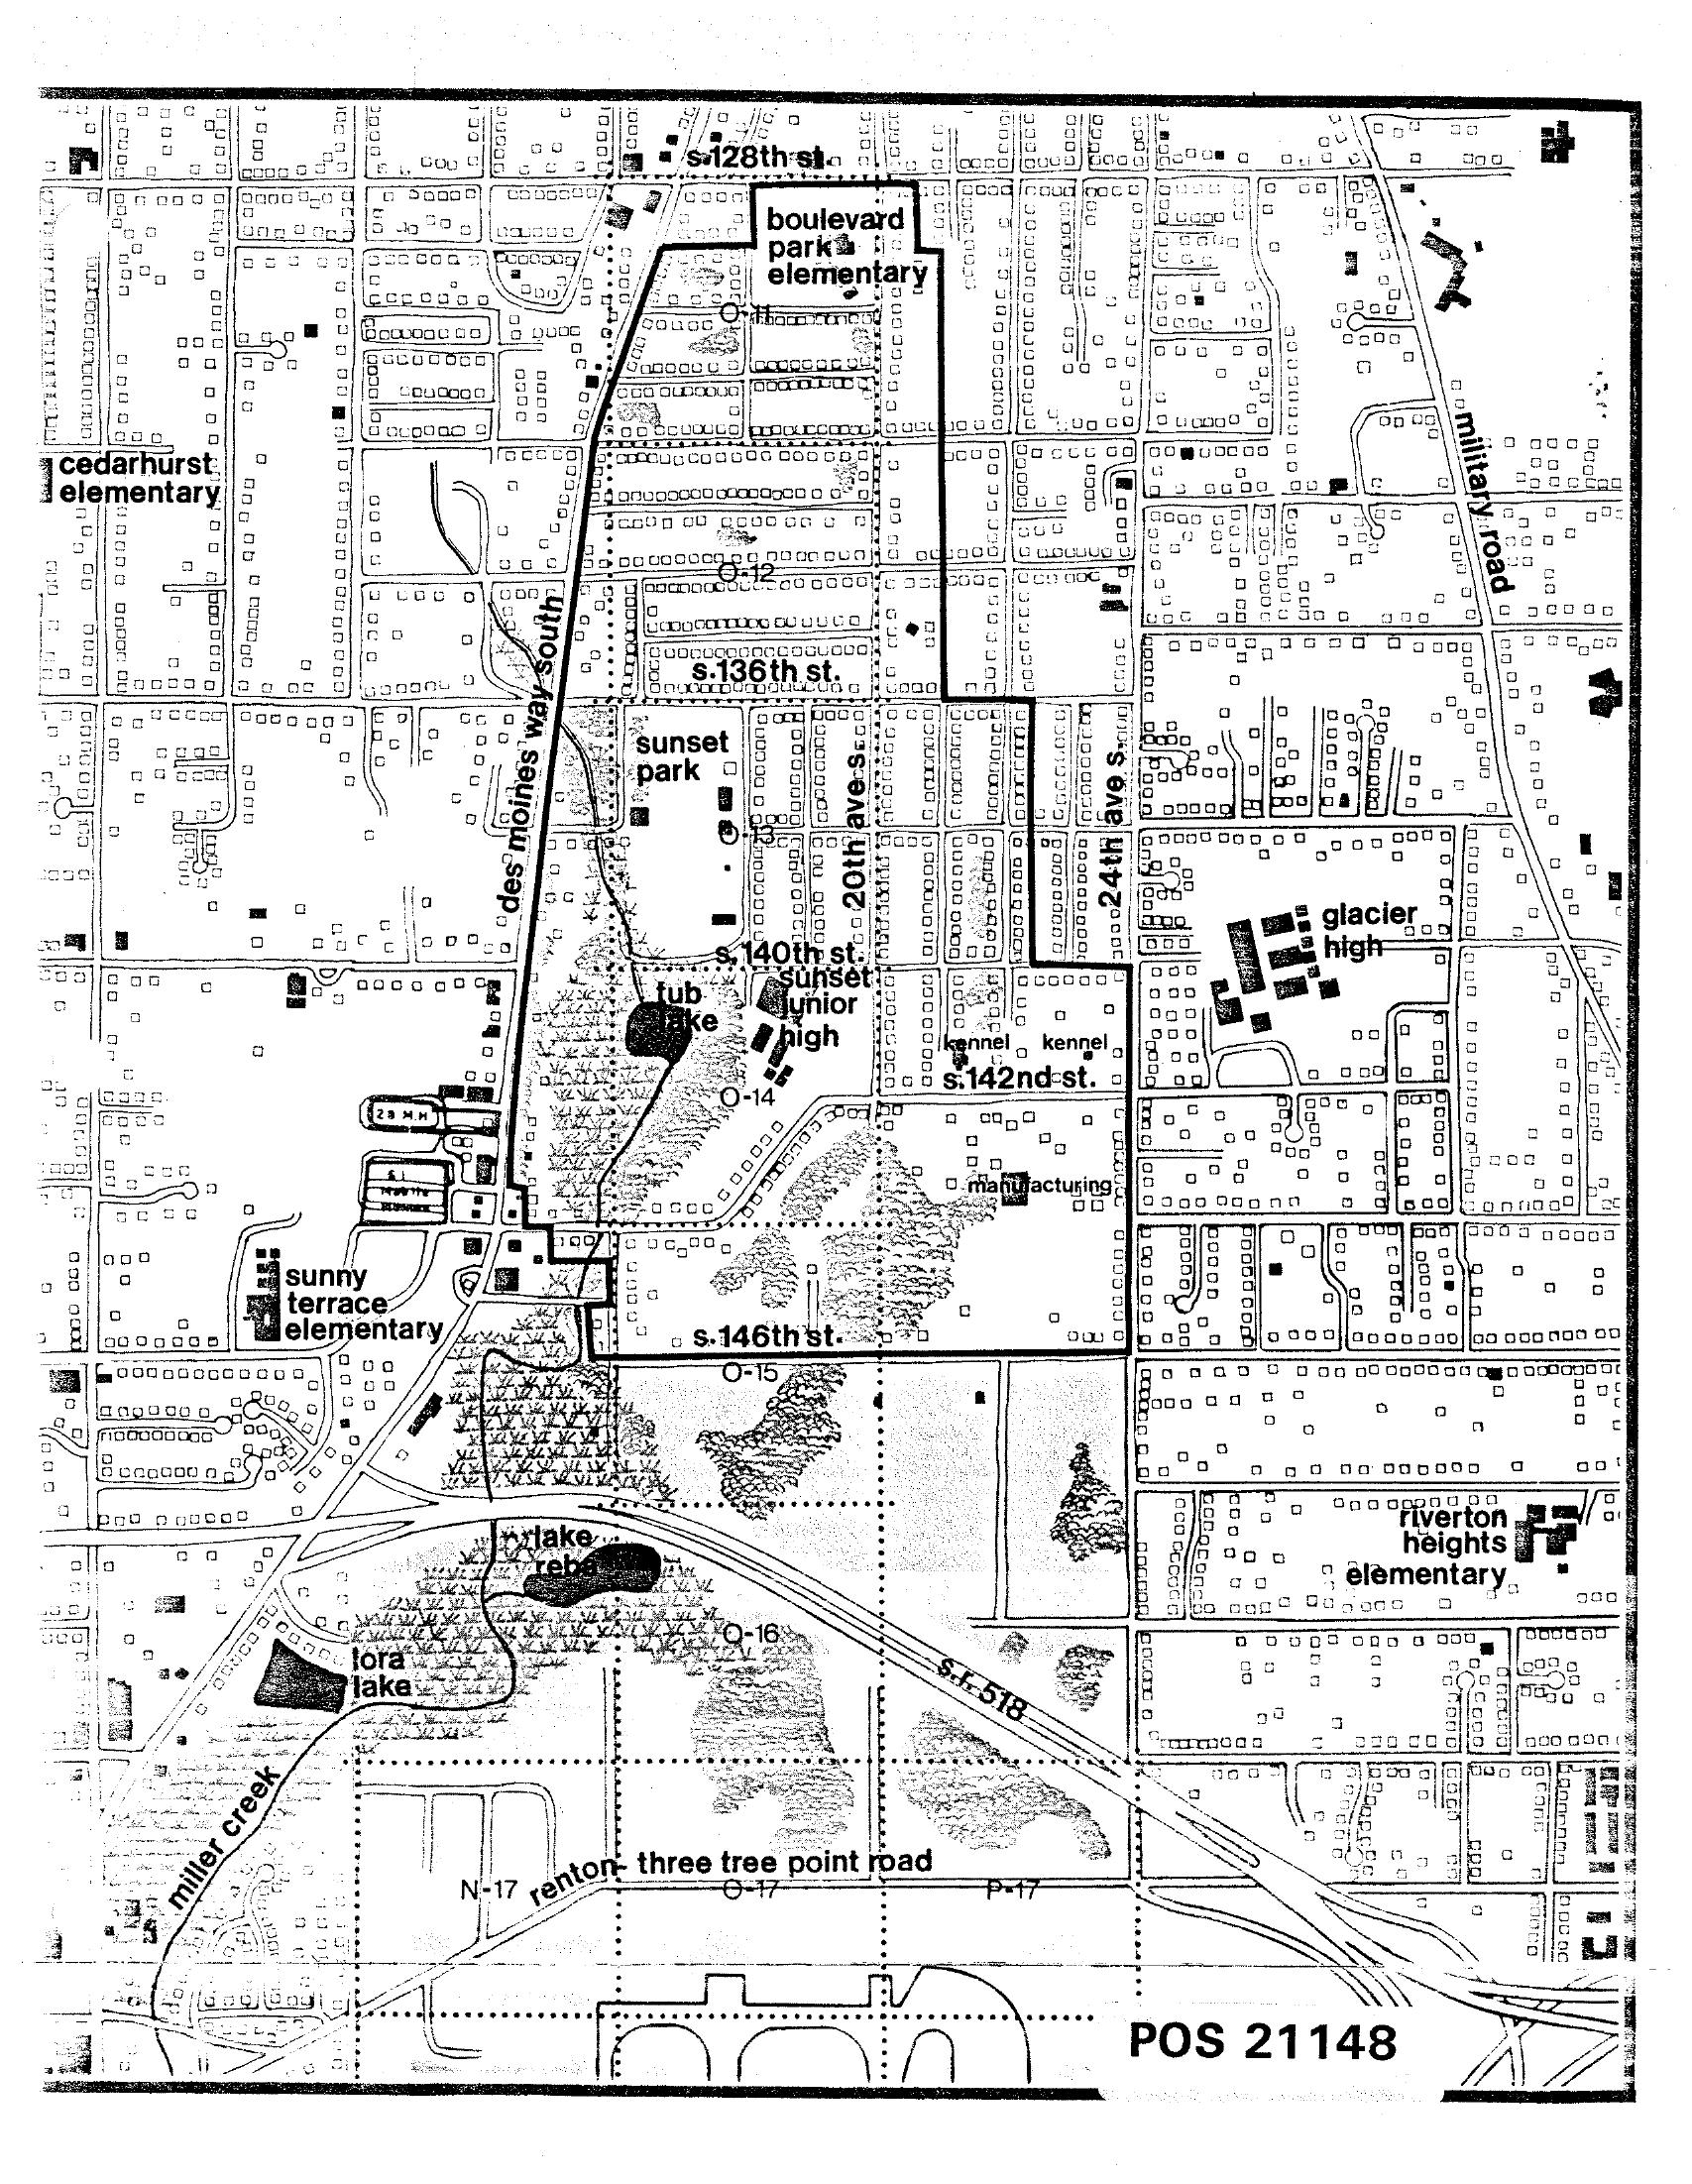
STCP Street Map with School Locations and Noise Zone Overlays, South Seattle/Burien Area
A detailed urban planning or noise-impact map labeled POS 21148 depicting the south Seattle/Burien area near Sea-Tac Airport, showing street grid references including S. 128th St., S. 136th St., S. 140th St., S. 142nd St., and S. 146th St., along with named landmarks such as Boulevard Park Elementary, Cedarhurst Elementary, Sunset Junior High, Glacier High, Sunny Terrace Elementary, Riverton Heights Elementary, Tub Lake, Lake Rebecca, Lora Lake, Miller Creek, Des Moines Way South, Military Road, and SR-518 (Renton–Three Tree Point Road). Zone designations (O-12 through O-17, N-17, P-17) suggest noise contour or land-use overlay classifications consistent with airport noise policy planning. -
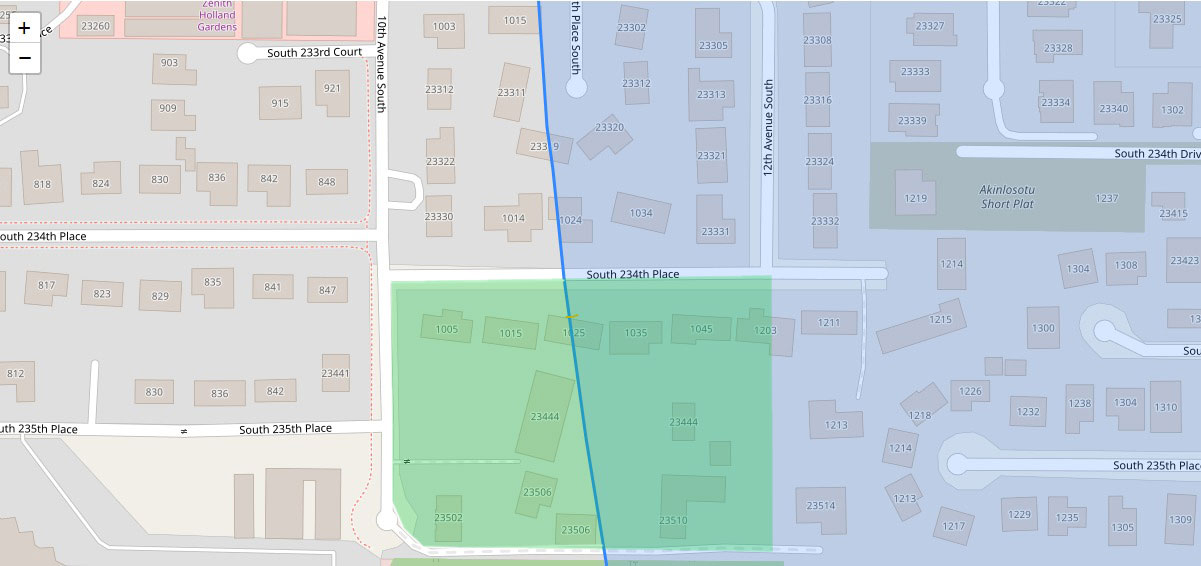
GIS Parcel Map with Noise Contour Boundary Near South 234th Place, Sea-Tac/Des Moines Area
A GIS map showing residential parcels near South 234th Place in the SeaTac/Des Moines area, with a blue diagonal line indicating a noise contour or flight path boundary related to Sea-Tac Airport. Street addresses and parcel numbers are visible, including properties along 10th Avenue South, 12th Avenue South, and South 234th–235th Places, with overlapping green and blue shaded zones likely representing different noise exposure levels. The 'Akinlosotu Short Plat' subdivision is labeled in the upper right area. -
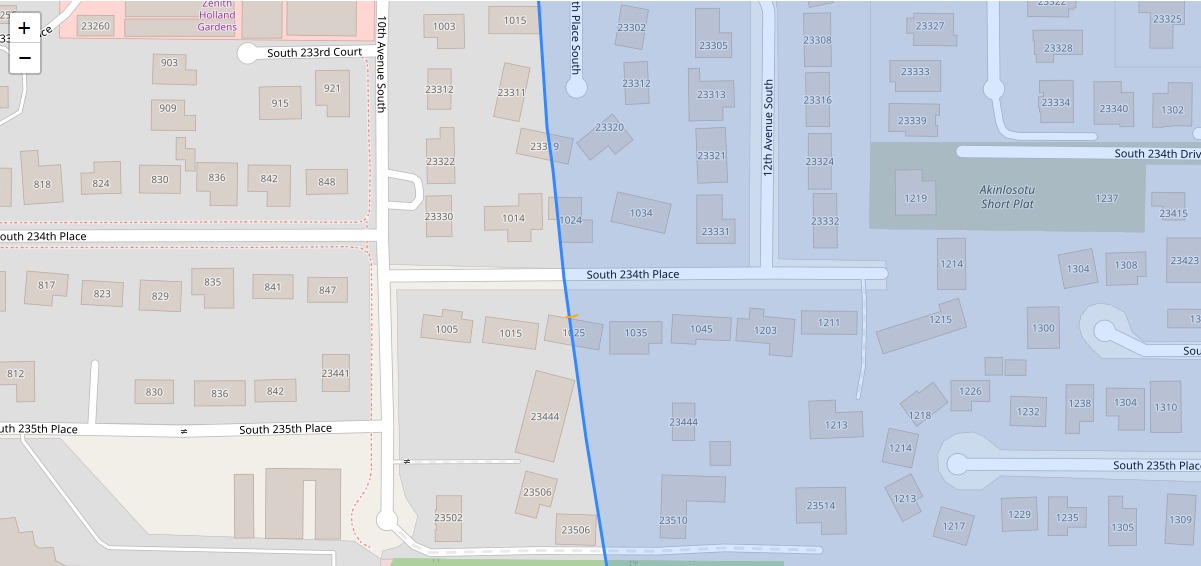
End of Block example from 2032 Part 150
A GIS map showing residential parcels in the South 234th Place corridor near 10th and 12th Avenue South in Des Moines/SeaTac, Washington, with a blue diagonal line indicating a noise contour or flight path boundary overlaid on the street grid. The shaded (blue) zone to the right of the line likely represents an airport noise impact area associated with Seattle-Tacoma International Airport policy mapping. -
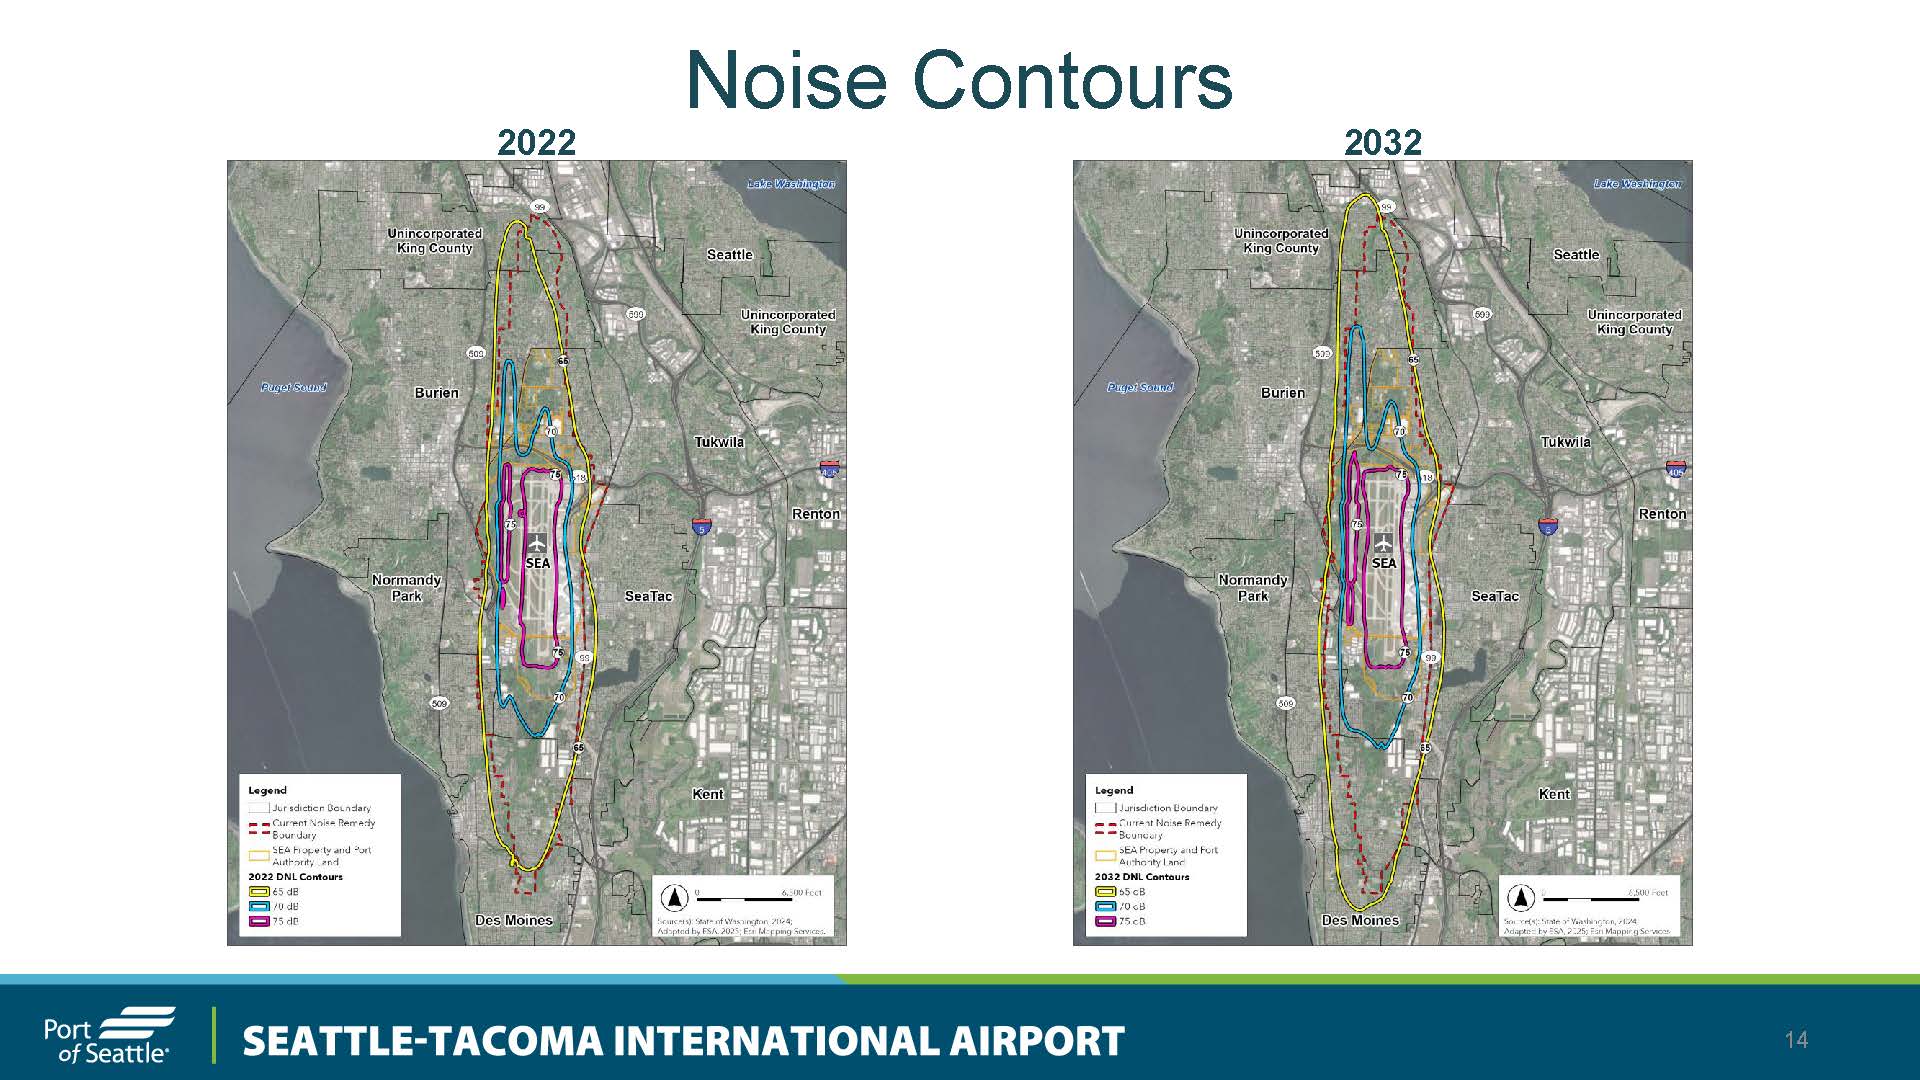 2025-06-09
Sea-Tac Airport Part 150 DNL Noise Contour Maps: 2022 vs. 2032 Projected Conditions
A Port of Seattle presentation slide comparing DNL noise contour maps for Seattle-Tacoma International Airport (SEA) for 2022 and projected 2032 conditions, showing 65 dB, 70 dB, and 75 dB contours overlaid on aerial maps of surrounding communities including Burien, SeaTac, Normandy Park, Tukwila, and Renton. The 2032 map shows expanded noise contours relative to 2022, with reference to the Current Noise Remedy Boundary and SEA Property and Port Authority land. -
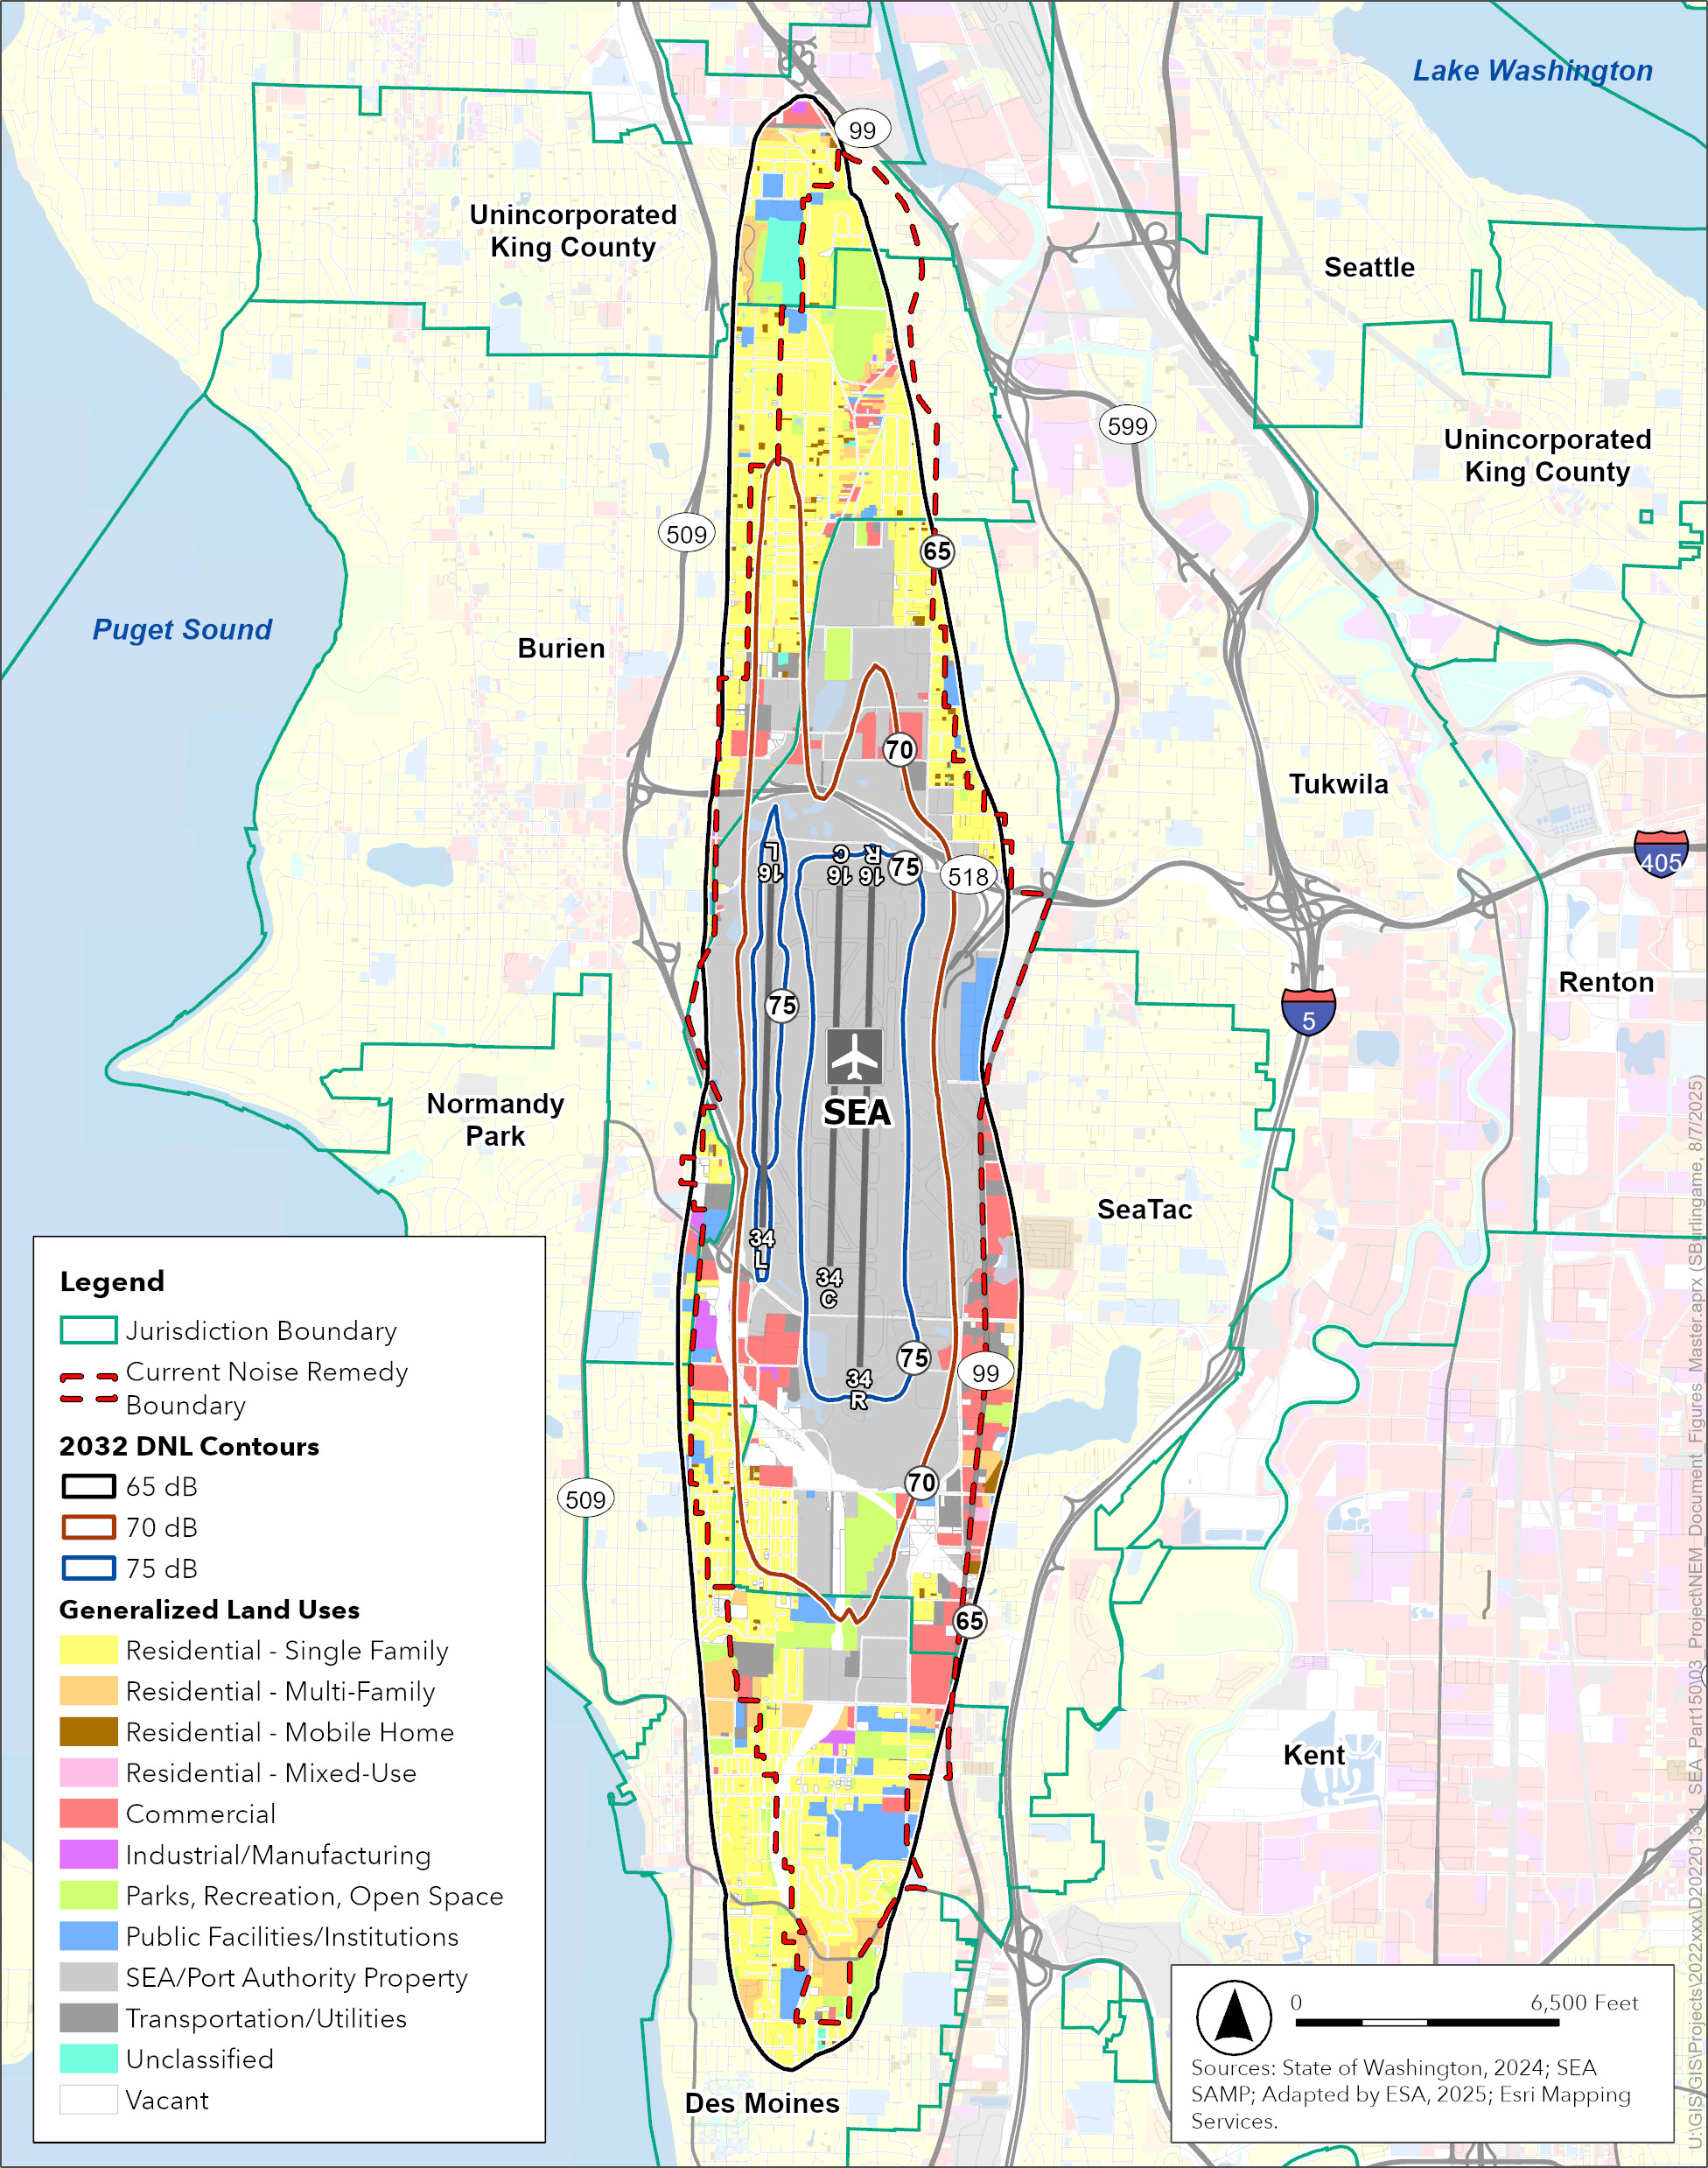 2025-01-01
2032 DNL Noise Contours with Existing Land Use and Noise Remedy Boundary — Sea-Tac Airport
This GIS map depicts the 2032 Day-Night Average Sound Level (DNL) noise contours (65, 70, and 75 dB) for Seattle-Tacoma International Airport (SEA), overlaid with generalized land use classifications and the current Noise Remedy Boundary. Sourced from the State of Washington (2024) and SEA SAMP, adapted by ESA in 2025, the map covers surrounding jurisdictions including Burien, SeaTac, Tukwila, Normandy Park, Des Moines, and unincorporated King County. -
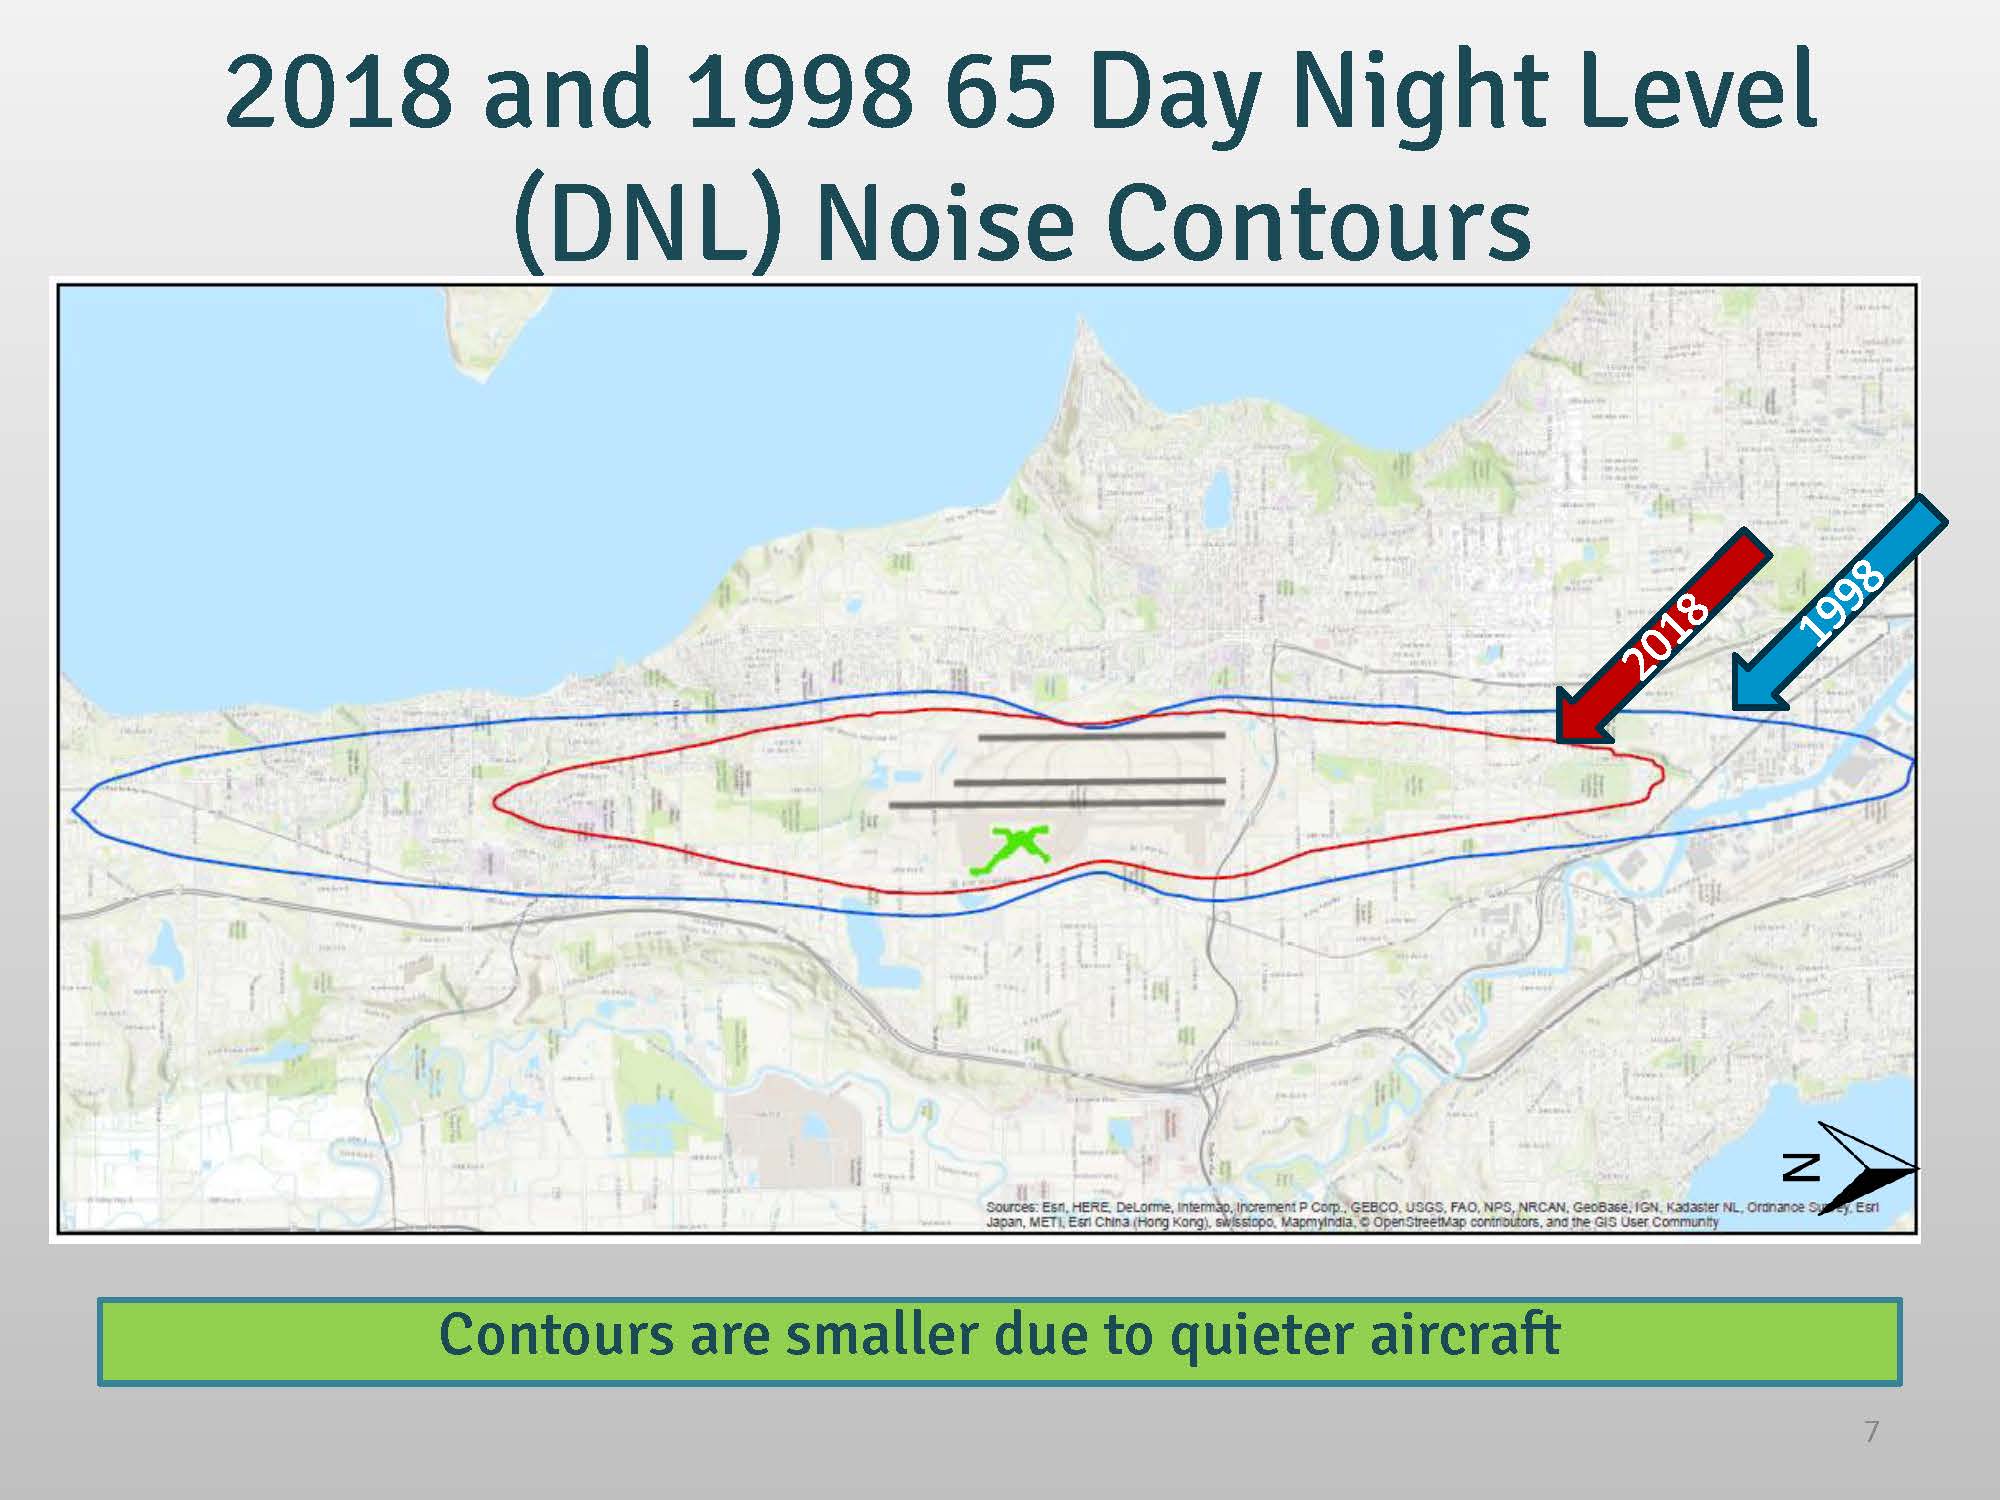
DNL65 NEM Part 150 Noise Contour Boundary 2018 Pages from 2016_10_11_SM_6b_supp
Slide 7 from a Sea-Tac Airport presentation comparing the 65 Day Night Level (DNL) noise contours for 1998 (blue outline) and 2018 (red outline), overlaid on a regional map. The caption notes that the 2018 contour is smaller than the 1998 contour due to quieter aircraft technology. -
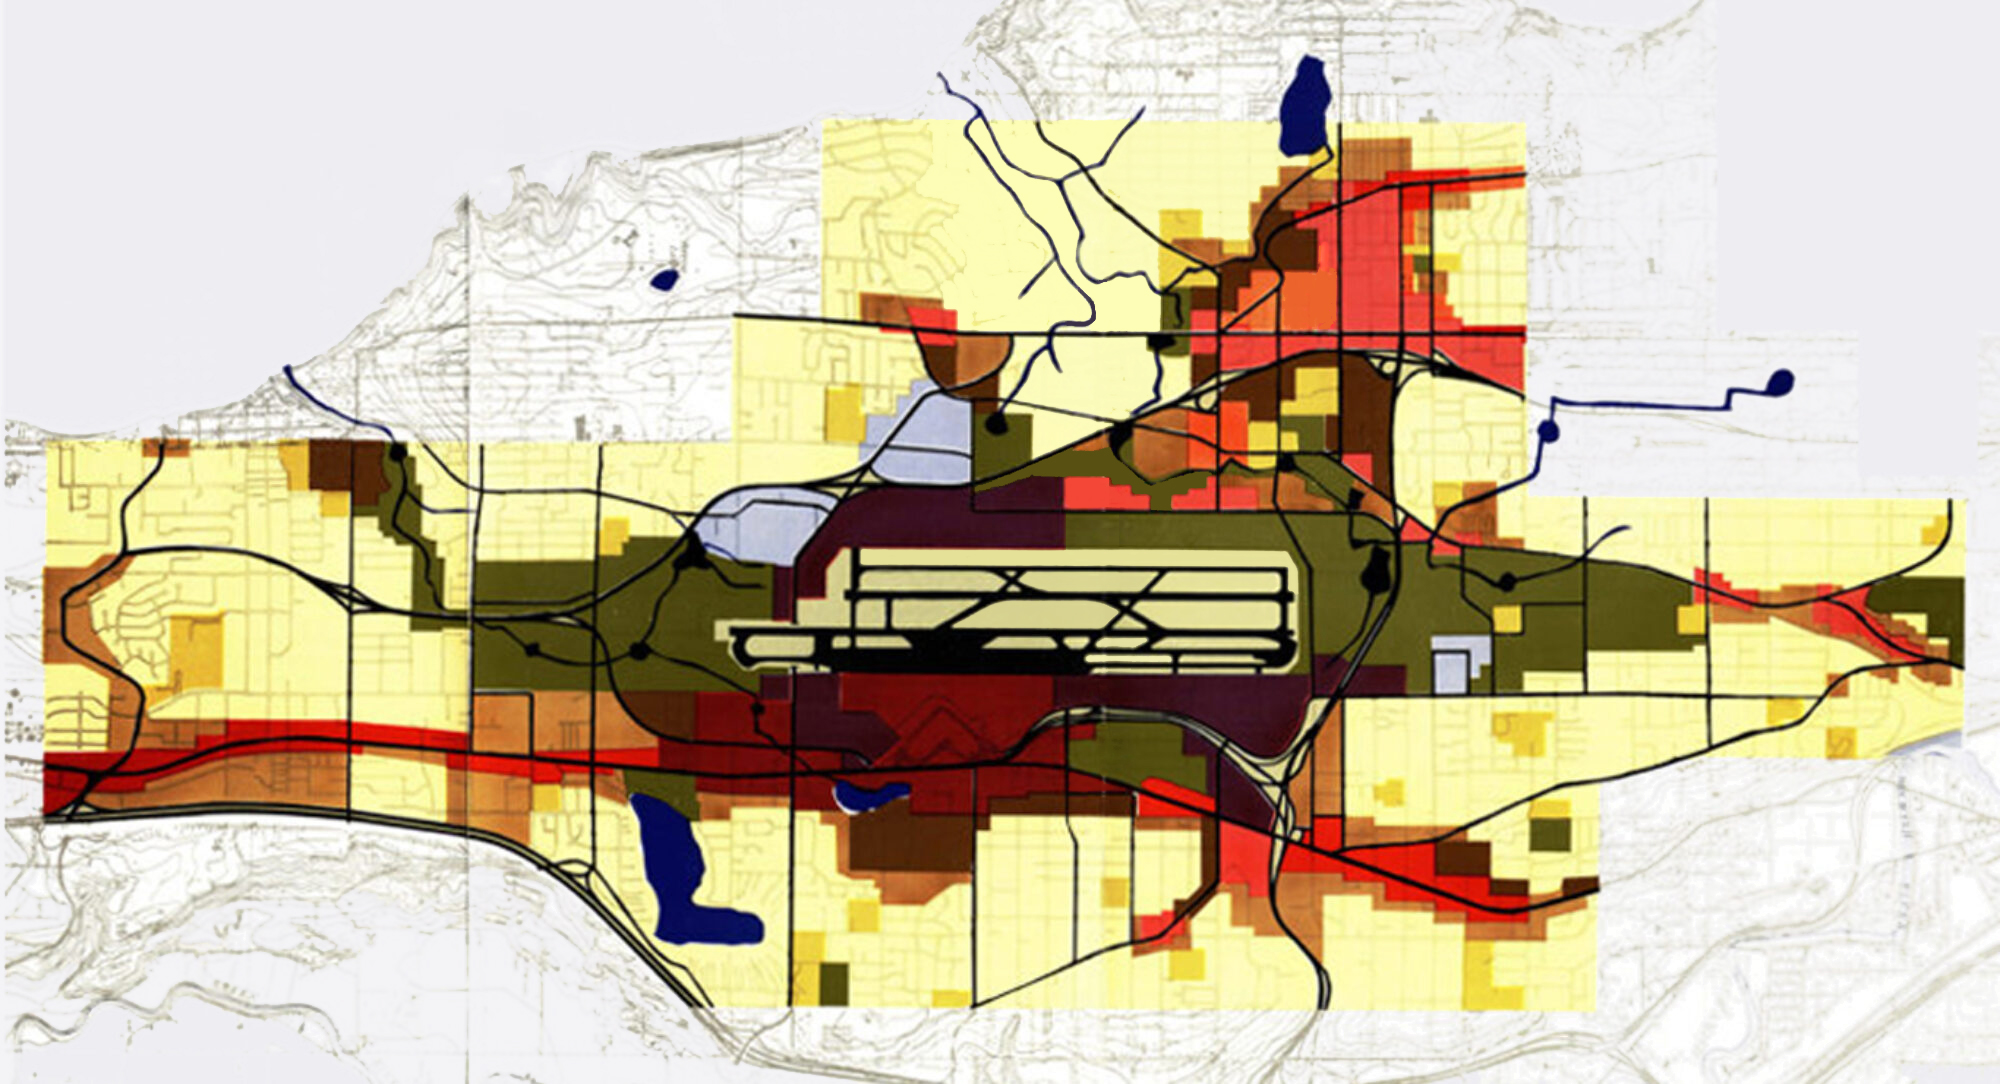
Sea-Tac Community Plan Land Use Sideways
A color-coded GIS-style map overlay showing noise contour zones or land-use impact areas surrounding what appears to be a major airport runway complex at center. Colors ranging from light yellow to deep red and dark olive likely represent varying levels of noise exposure or compatible/incompatible land uses, with road networks shown in black and red lines. -
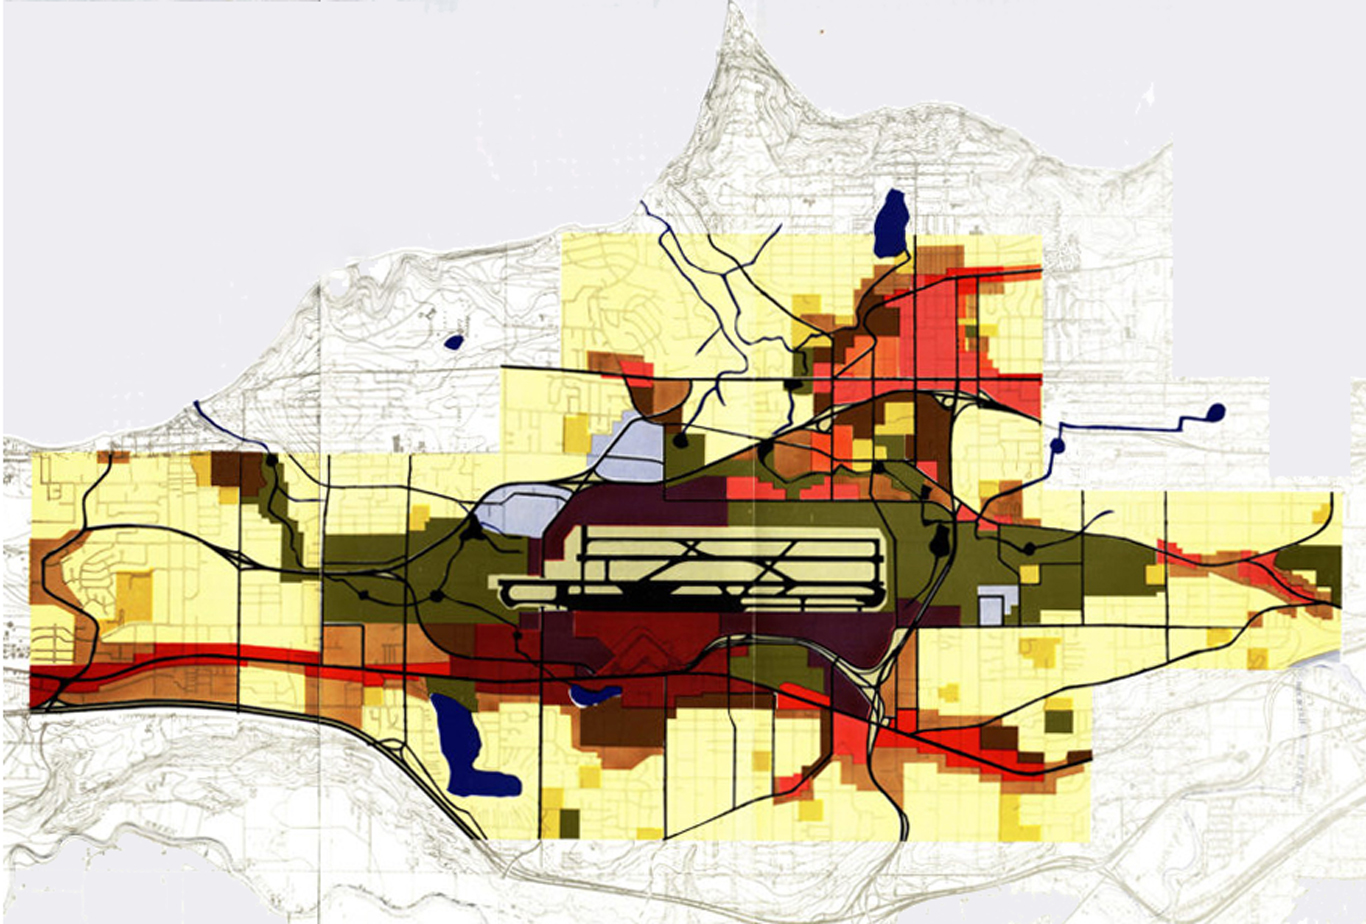
SCP_sideways
A color-coded planning map showing noise contour zones or land-use impact areas radiating from a central airport runway facility, depicted in shades of yellow, red, brown, and dark olive-green. Blue lines appear to represent waterways or transportation corridors, and bold black lines indicate road or grid infrastructure overlaid on a topographic base map. -
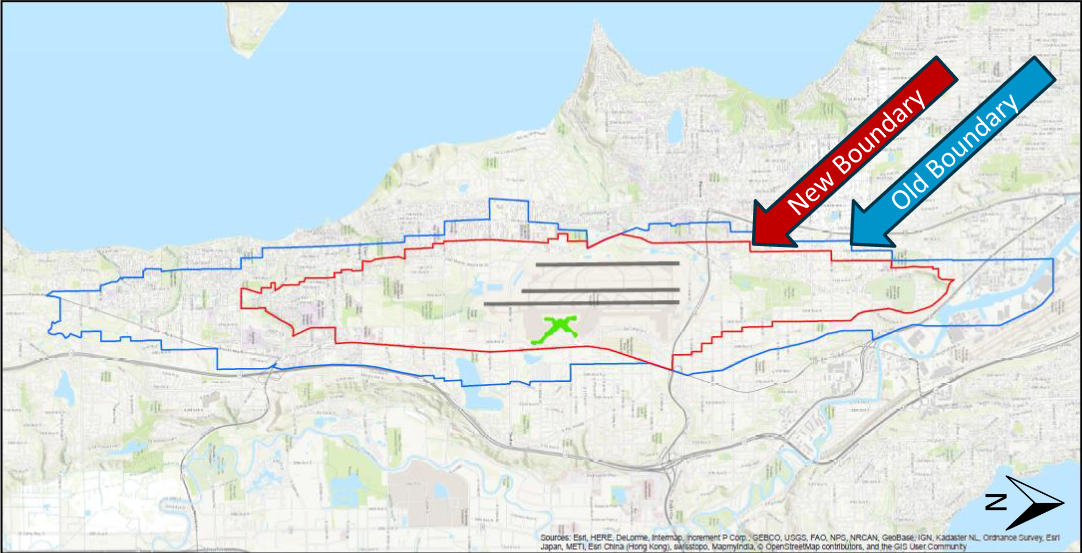
2021 Projected Noise Boundary Map
A GIS map comparing the old noise boundary (blue line) and new noise boundary (red line) around Seattle-Tacoma International Airport, with runway layout and airport symbol visible at center. Map data credited to Esri, HERE, DeLorme, Intermap, GEBCO, USGS, NPS, NRCAN, and other contributors.