TagNoise Boundary(14)
-
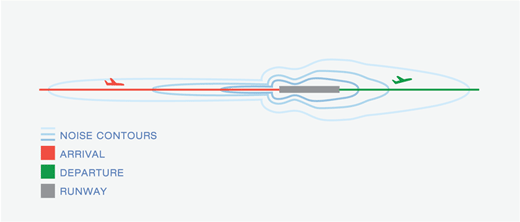
Aircraft Noise Contour Mapping
A diagram illustrating airport noise contours around a runway, with color-coded flight paths showing arrivals (red) and departures (green). The oval-shaped noise contour lines extend along both ends of the runway centerline, with greater extent on the departure end. -
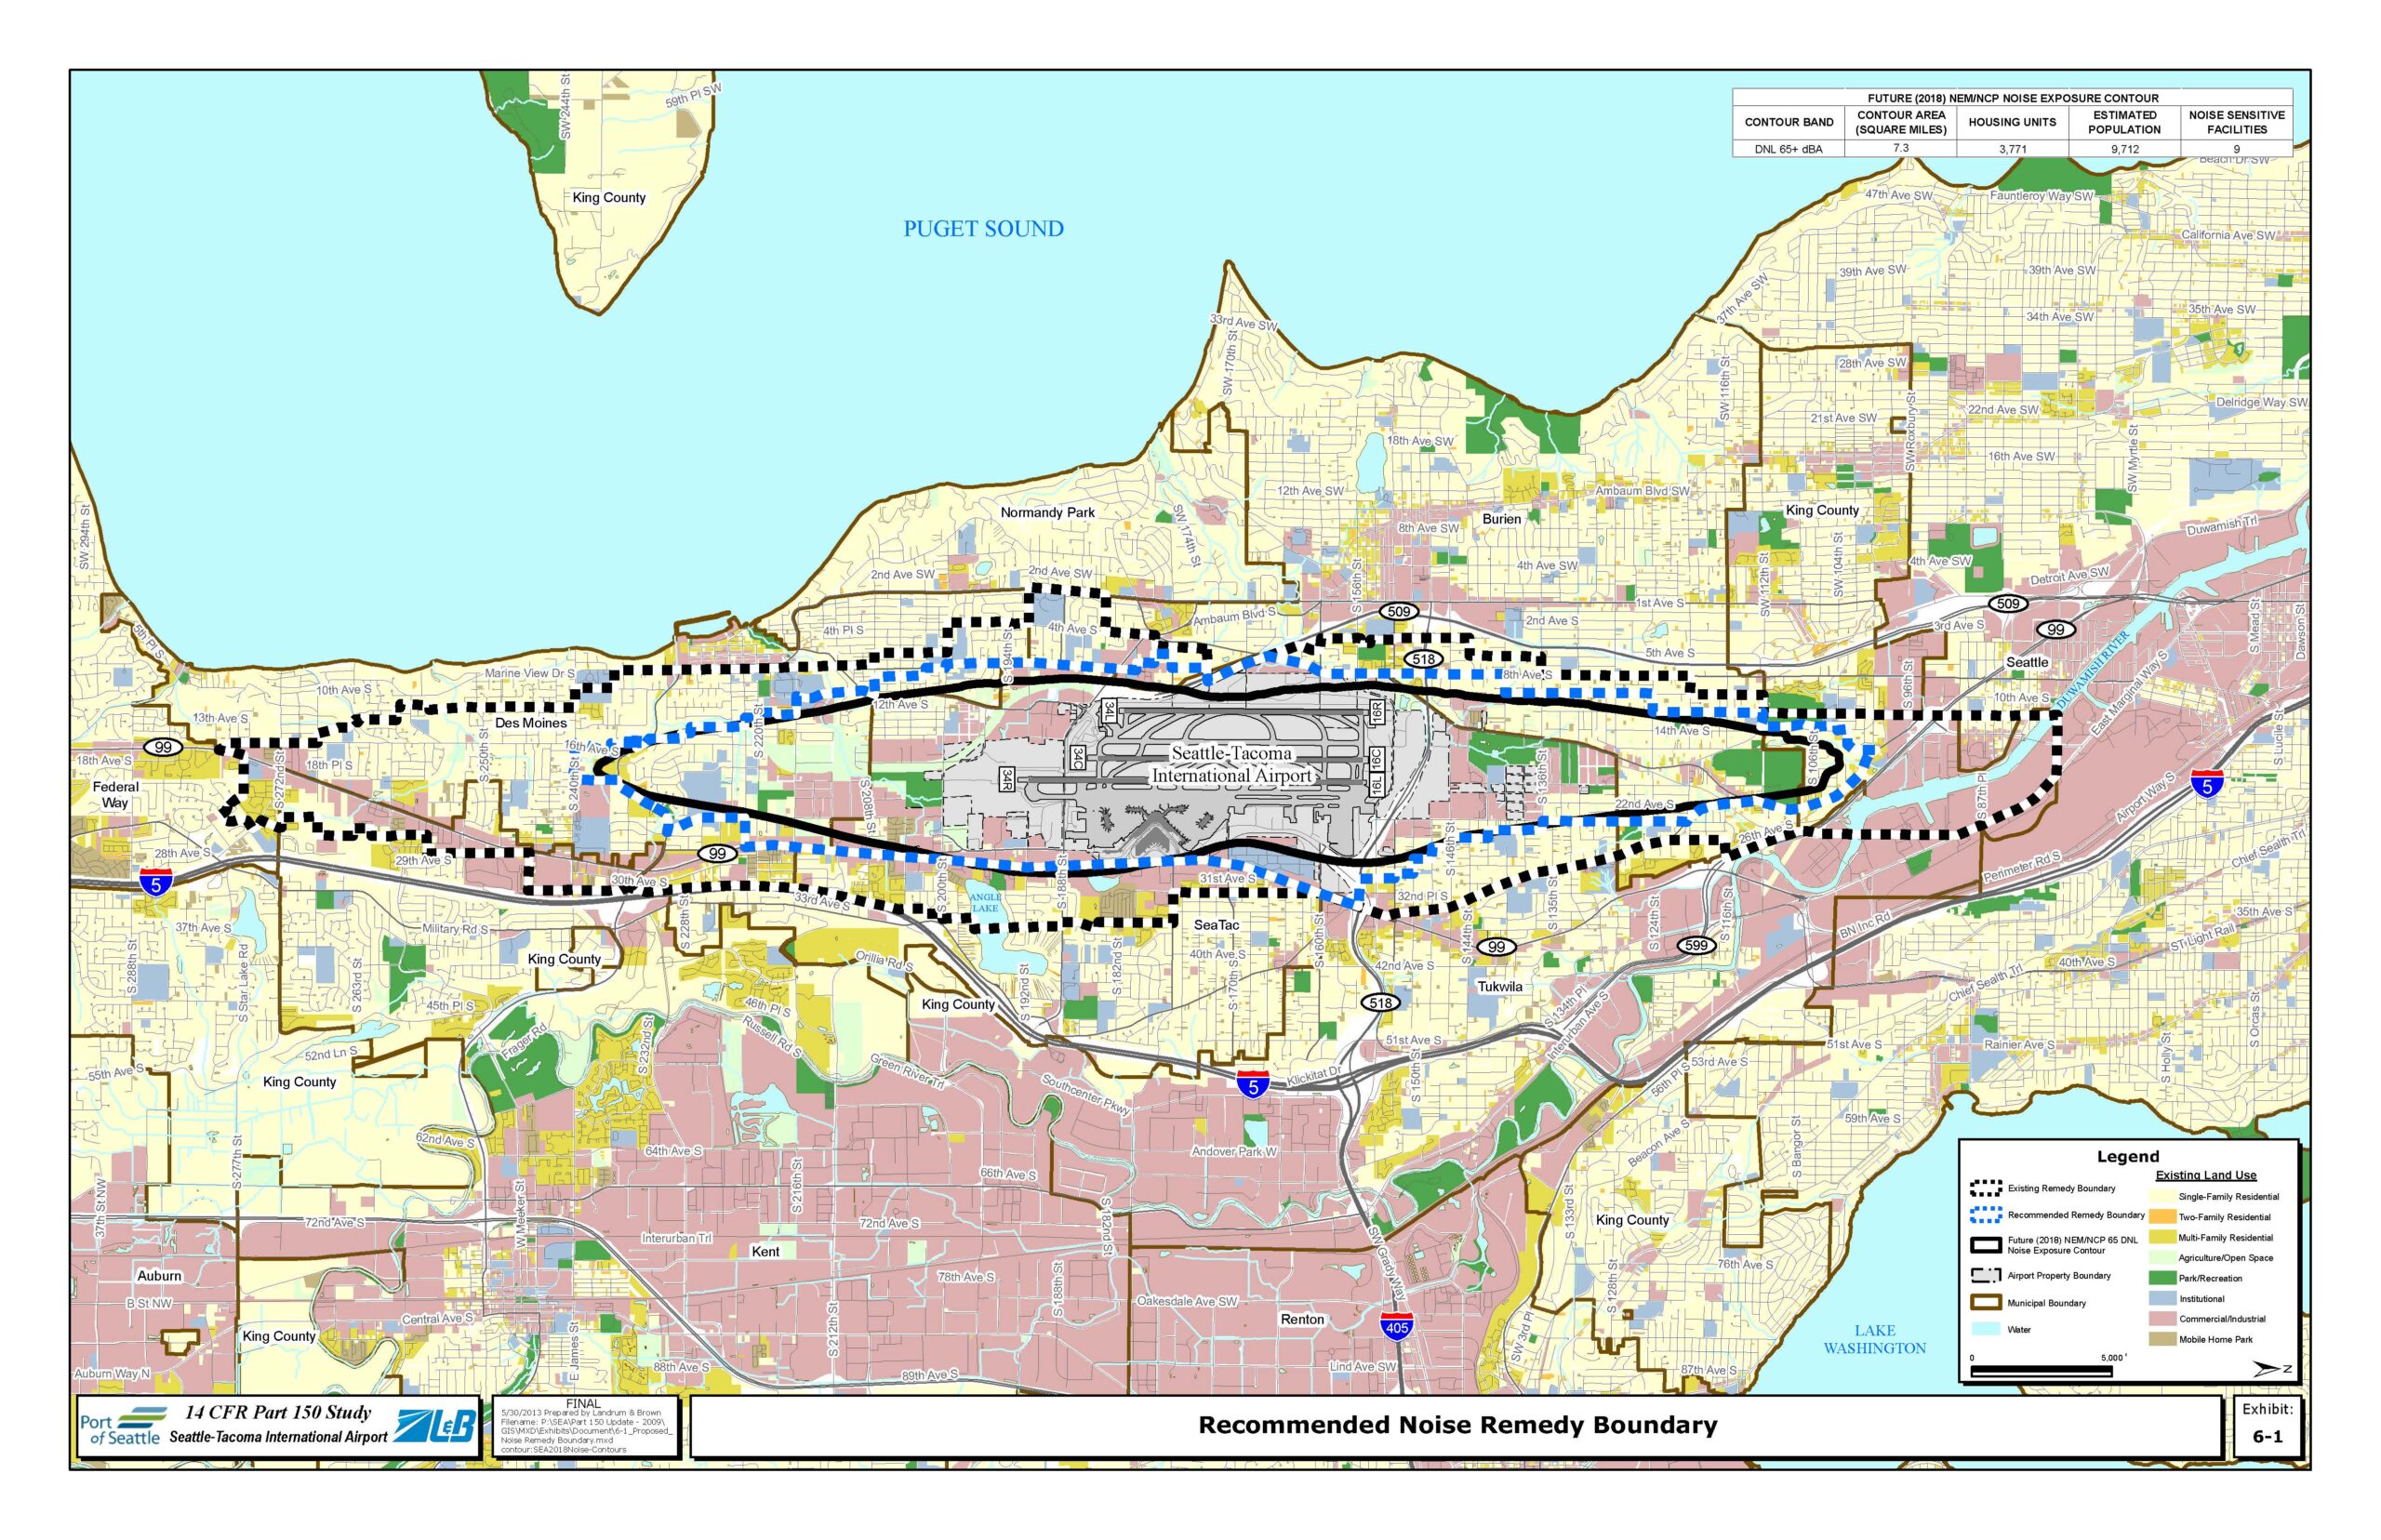
Recommended Noise Remedy Boundary Map — Sea-Tac Airport Part 150 Study
This map, prepared by Landrum & Brown for the Port of Seattle's 14 CFR Part 150 Study at Seattle-Tacoma International Airport, shows the Recommended Noise Remedy Boundary (blue dashed line) alongside the Existing Remedy Boundary (black dashed line) and the Future (2018) NEM/NCP 65 DNL Noise Exposure Contour. The future noise contour covers 7.3 square miles, encompassing an estimated 3,771 housing units, 9,712 residents, and 9 noise-sensitive facilities in communities including Des Moines, Burien, SeaTac, Normandy Park, and Tukwila. -
 2023-05-23
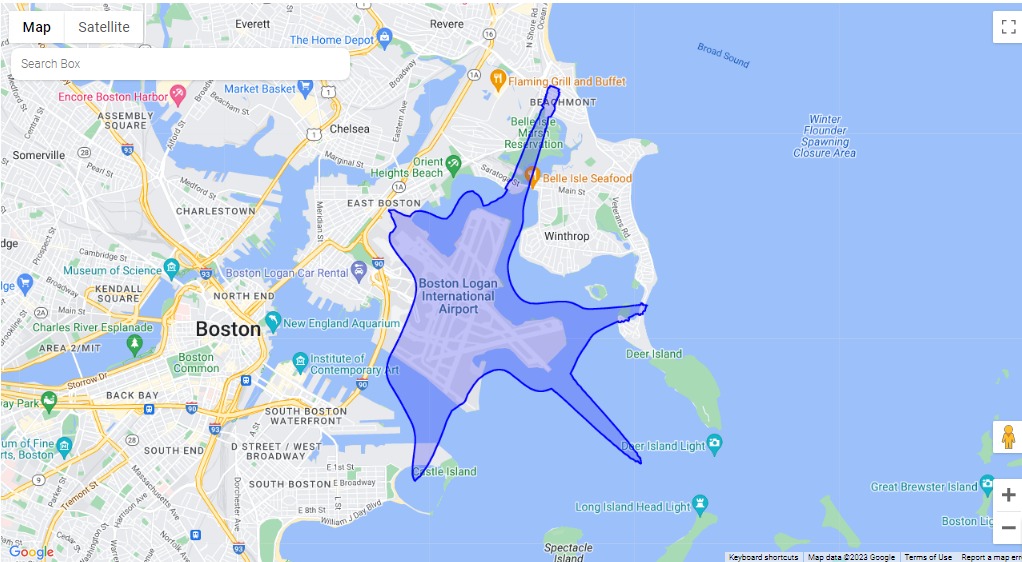
Boston Logan International Airport Noise or Flight Path Boundary Map
A Google Maps screenshot showing a blue polygon boundary drawn around Boston Logan International Airport (BOS) in East Boston, Massachusetts, extending over Boston Harbor toward Winthrop and Deer Island. The map includes visible labels for Boston Logan International Airport, surrounding neighborhoods, and landmarks such as Castle Island and Deer Island Light. -
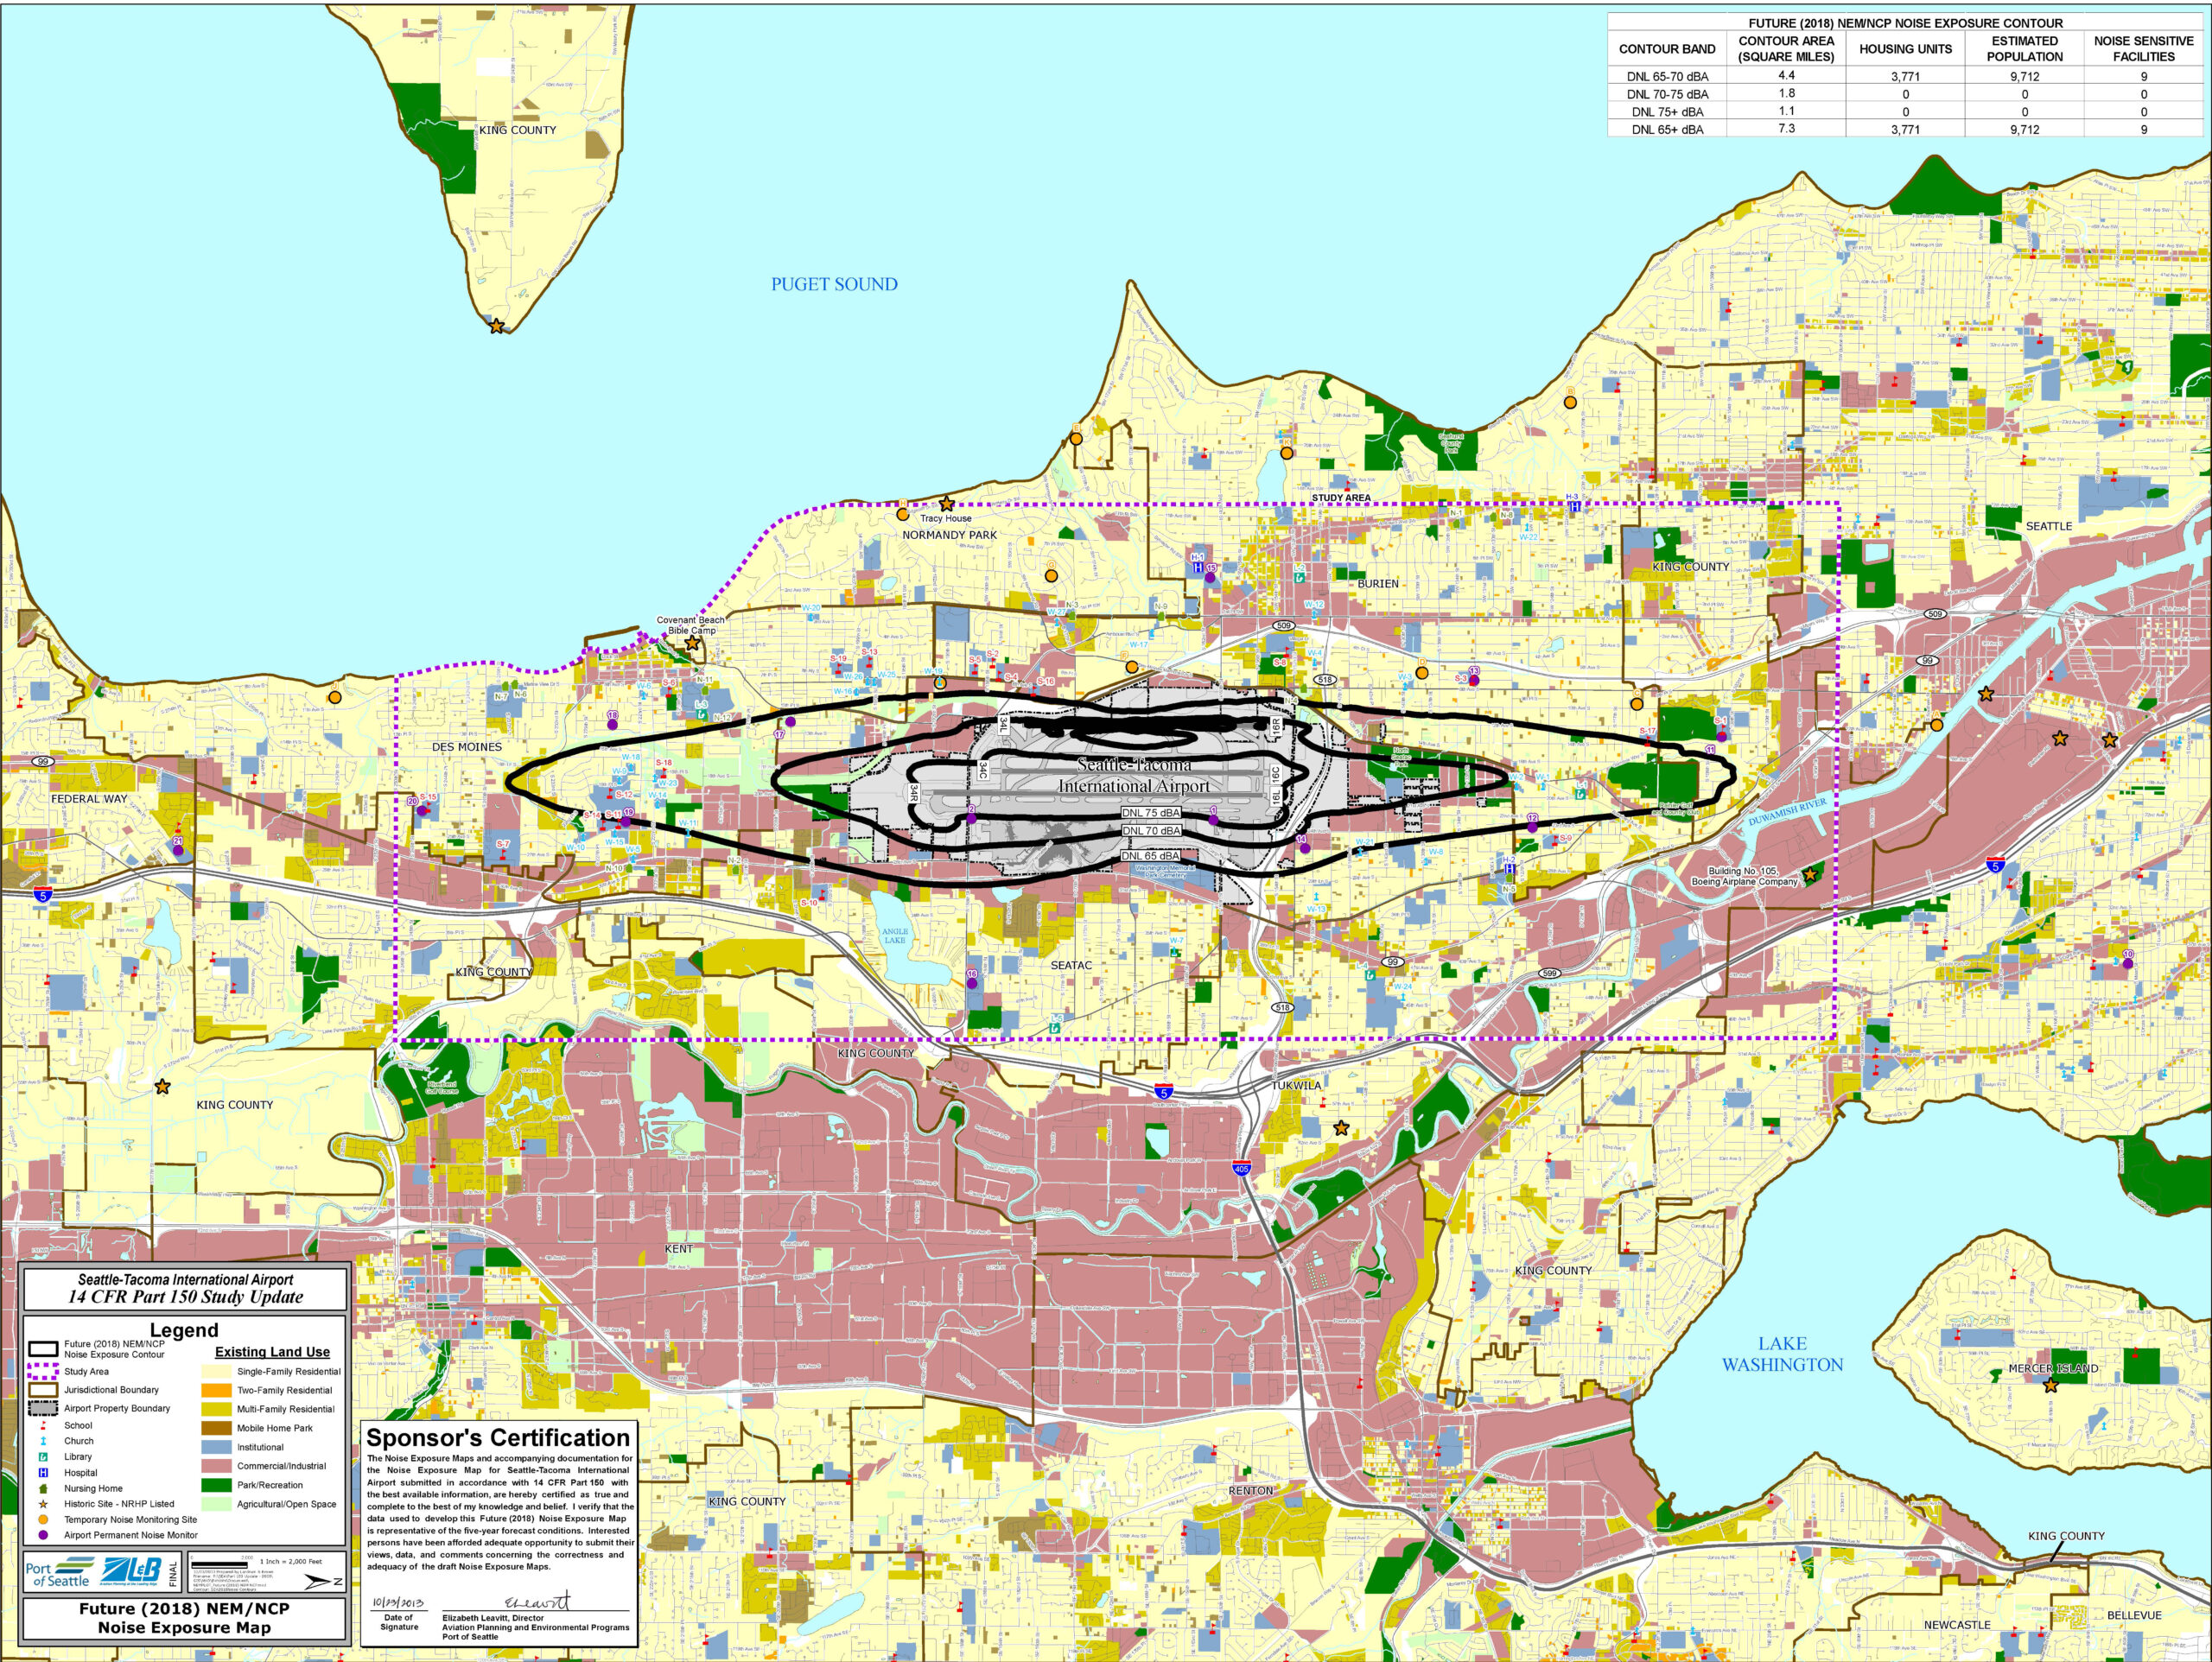
x2-NEMPLOT_Future (2018) NEM NCP
This is the Future (2018) Noise Exposure Map (NEM/NCP) for Seattle-Tacoma International Airport, produced as part of a 14 CFR Part 150 Study Update by the Port of Seattle. The map displays DNL noise contour bands (65–70, 70–75, and 75+ dBA) over surrounding communities including SeaTac, Des Moines, Normandy Park, Burien, and Tukwila, with a data table showing an estimated 9,712 residents and 3,771 housing units within the DNL 65+ dBA contour area of 7.3 square miles. -
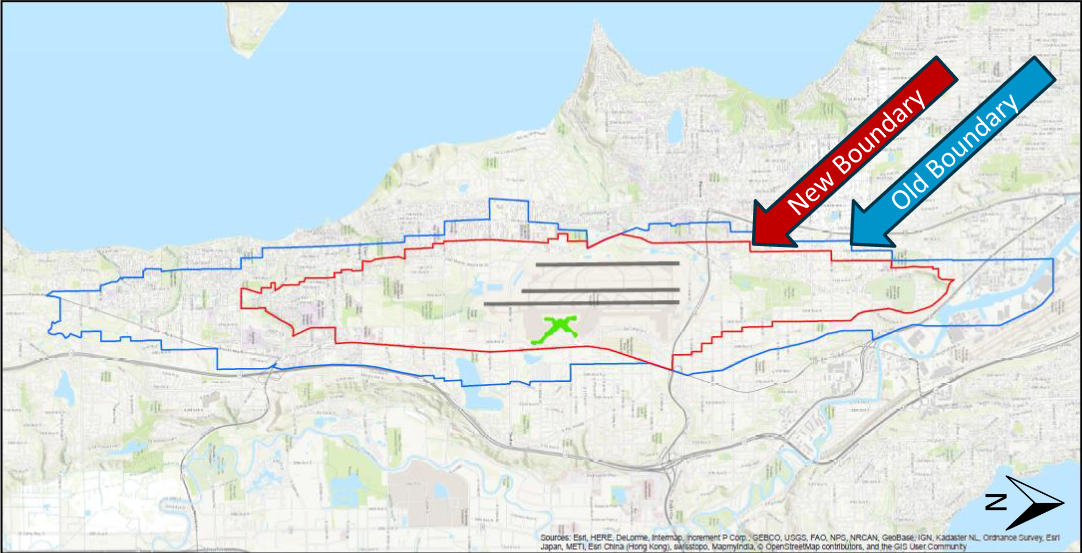
2021 Projected Noise Boundary Map
A GIS map comparing the old noise boundary (blue line) and new noise boundary (red line) around Seattle-Tacoma International Airport, with runway layout and airport symbol visible at center. Map data credited to Esri, HERE, DeLorme, Intermap, GEBCO, USGS, NPS, NRCAN, and other contributors. -
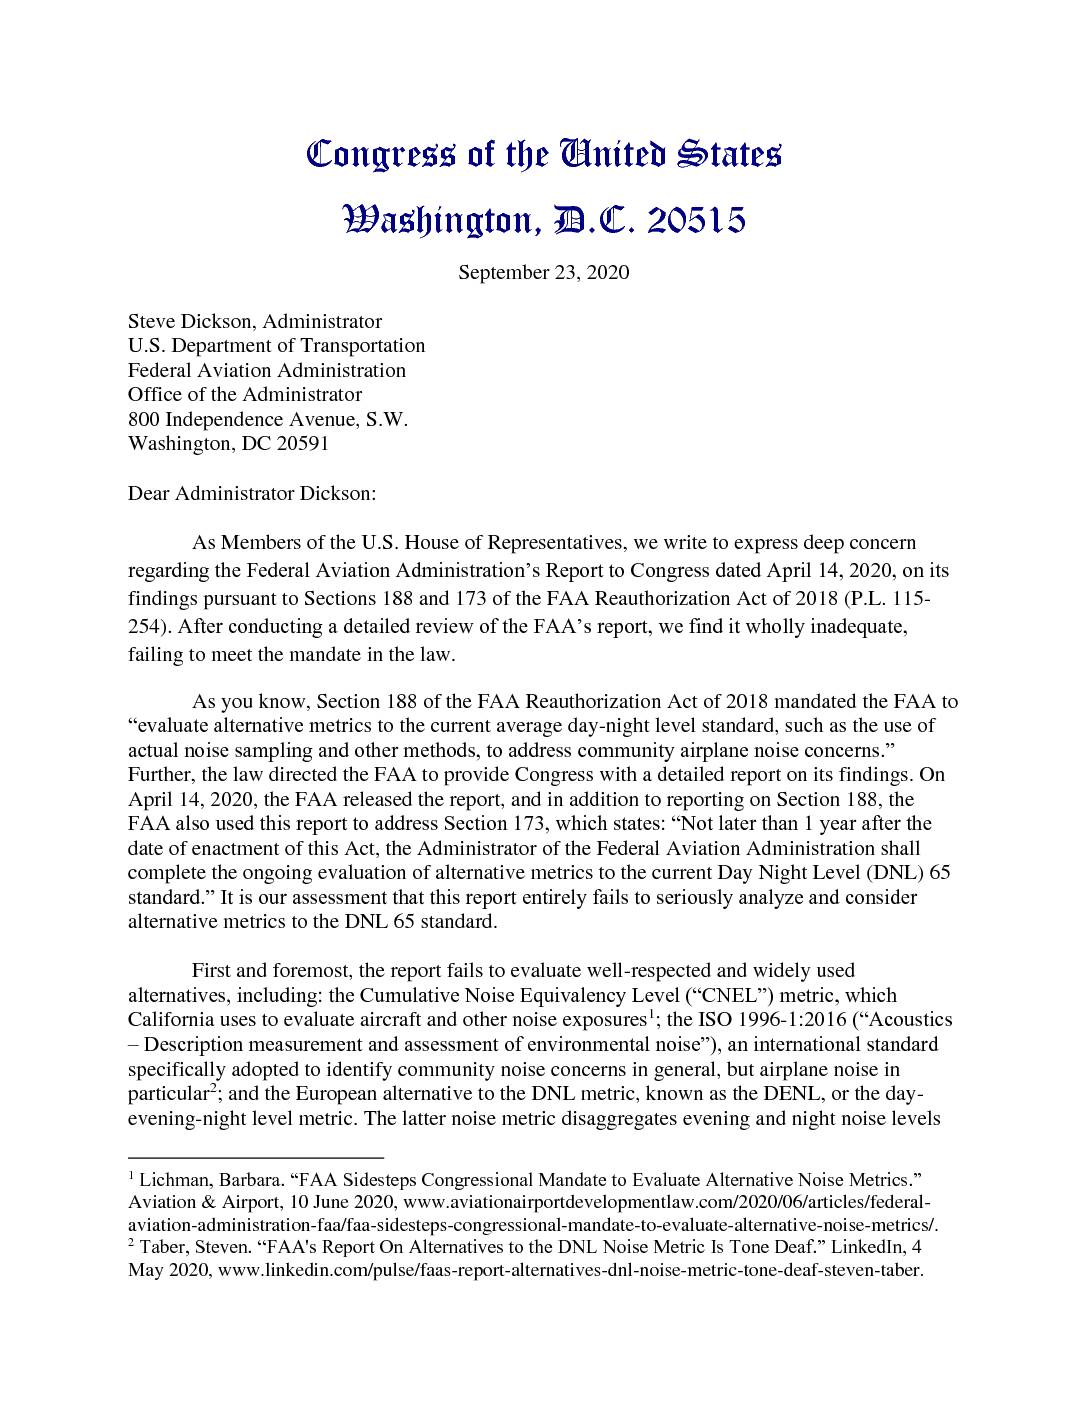 2020-09-23
Congressional letter to FAA Administrator Steve Dickson on alternative noise metrics report
Currently, FAA law has extremely complicated rules for establishing a noise boundary around airports. (A noise boundary is a geographic area inside which there is a certain acceptable noise level.) This is referred to as the DNL65. and it has several major flaws. The FAA Reauthorization Act Of 2018 attempted to address these flaws in several ways. This letter, from a caucus of Congressmen engaged on airport community issues complains to the Administrator that the spirit of the law is not being adhered to and demands that he make attempts to put his agency into compliance. The language is fairly technical, however there are a couple of basic points they raise: First, that the noise boundary be determined by actual noise measurements (currently the noise boundaries are 'modeled' and those calculations often do not reflect in any way the lived experience for residents.) Second, that the 'acceptable' noise level of sixty five decibels (hence DNL65) has been determined to be far too high to conform with current understandings of healthy living. -
DNL65 For Dummies
There is a geographic area around every large airport where, according to a formula developed by the Federal Aviation Administration (FAA), the ‘noise’ level is equal to or greater than 65 decibels DNL (Day Night Level). That area is depicted on a noise exposure map (NEM) and referred to as the Noise Boundary or just -
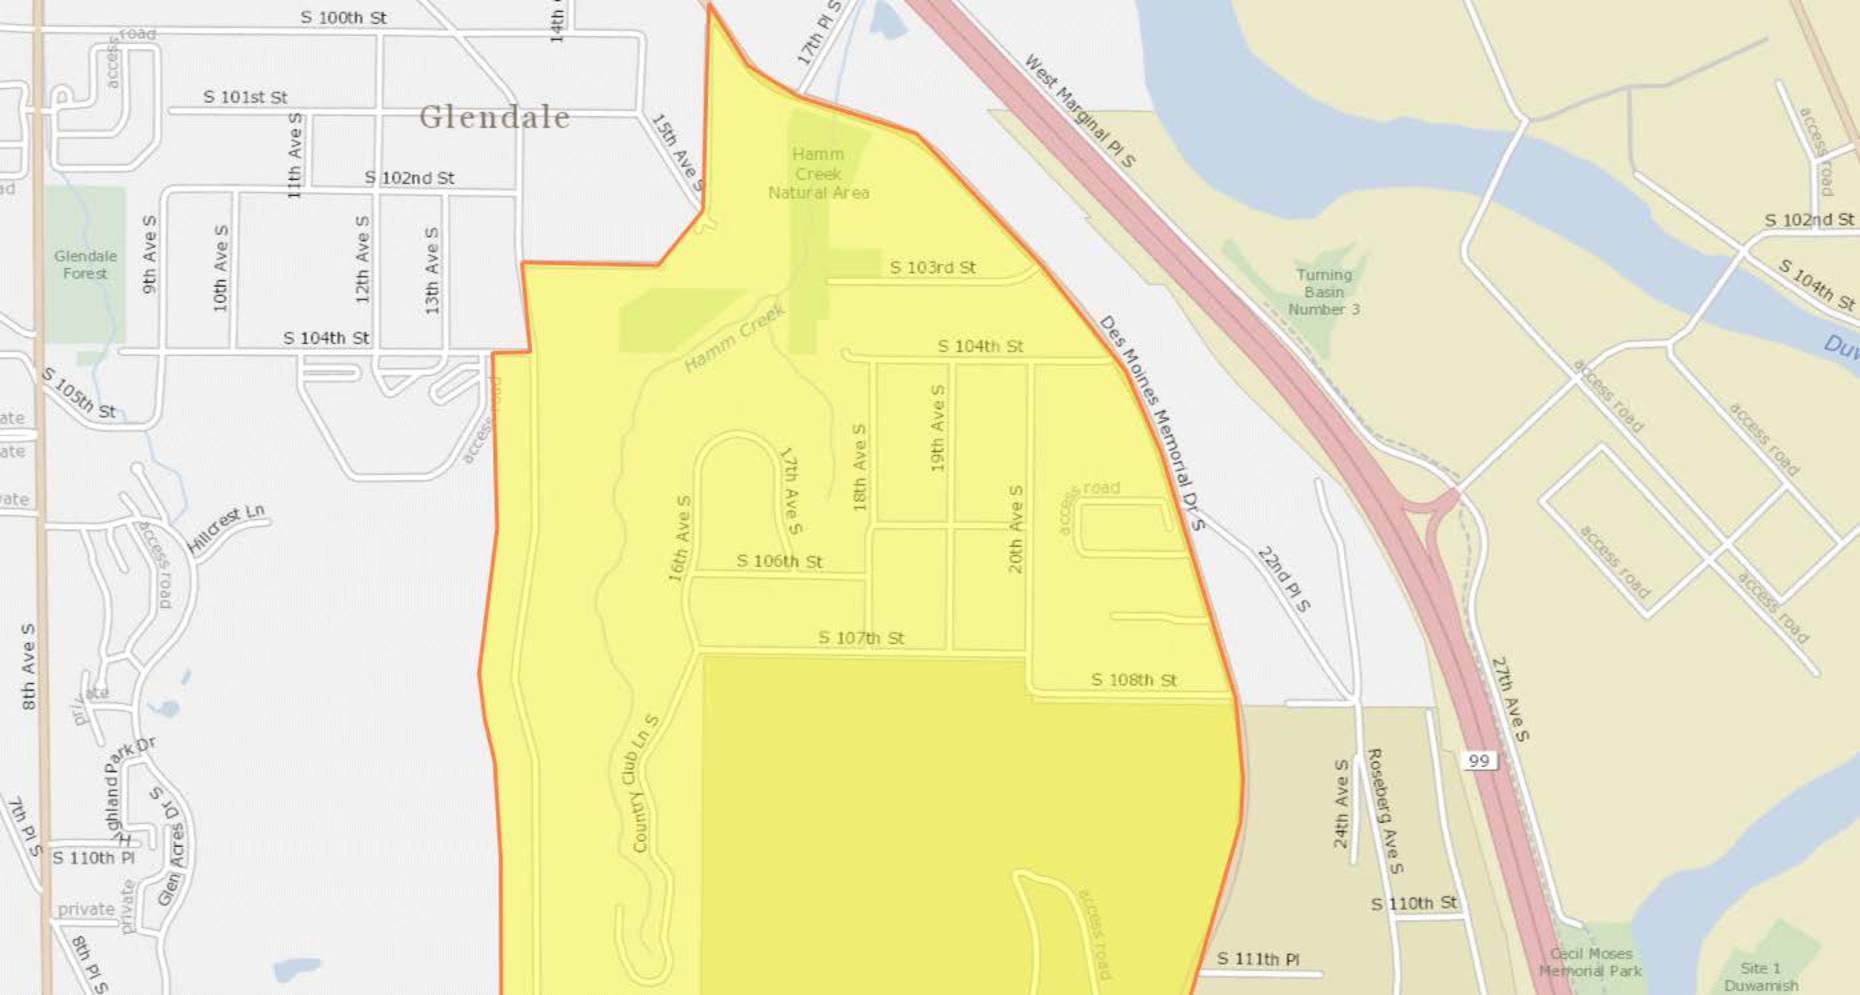 2018-01-01
DNL65 Boundary Map (2018)
This document contains a series of maps outlining a highlighted geographic zone spanning several Seattle-area neighborhoods, including Glendale, Southern Heights, Boulevard Park, and North SeaTac. The yellow-shaded areas, bordered in red, appear to delineate a specific study or policy boundary likely related to Sea-Tac Airport noise impact zones. Streets and landmarks such as Hamm Creek Natural Area, Des Moines Memorial Drive, and Southern Heights Park are visible within and around the designated boundary. -
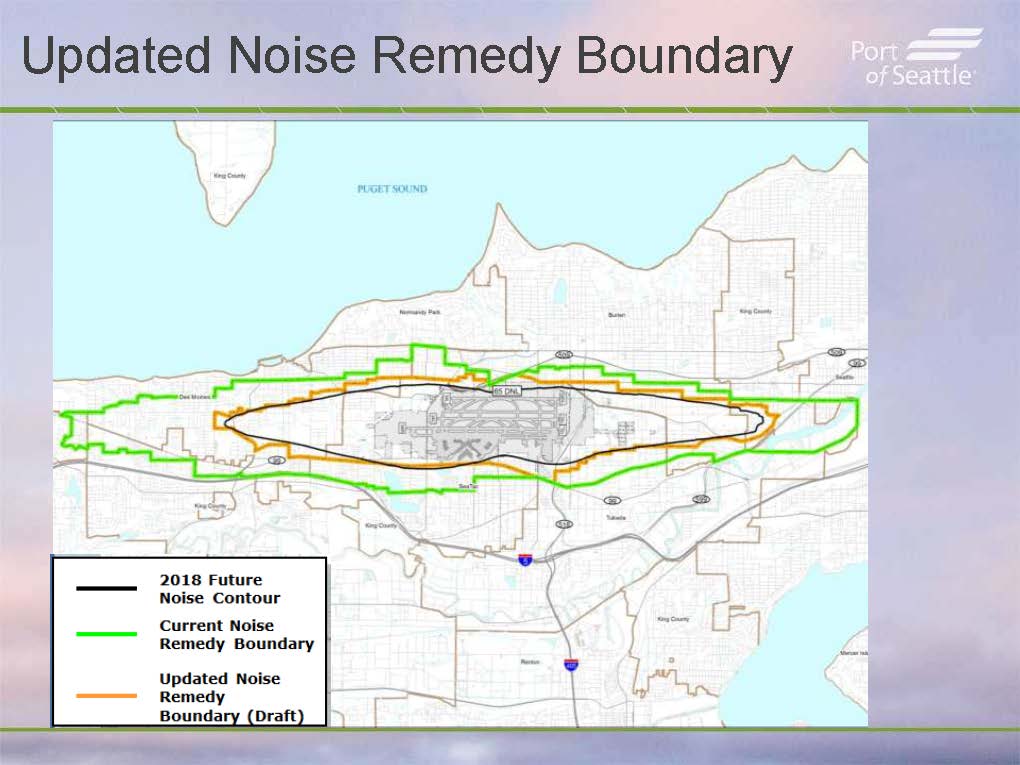 2013-09-24
Updated Noise Remedy Boundary Map — Port Of Seattle Commission Presentation (September 24, 2013) — Slide 2
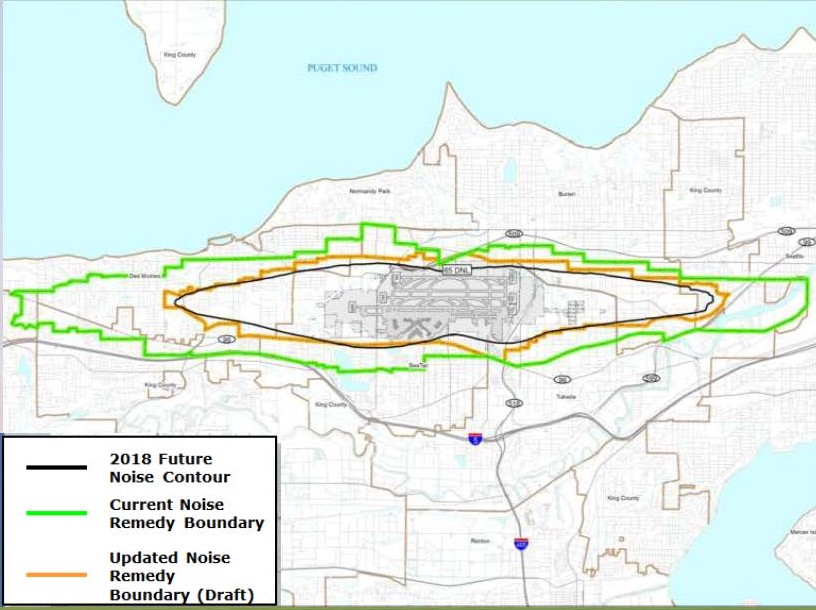
A Port of Seattle presentation slide titled 'Updated Noise Remedy Boundary' showing a map of the Sea-Tac Airport area with three overlaid boundaries: the 2018 Future Noise Contour (black), the Current Noise Remedy Boundary (green), and the draft Updated Noise Remedy Boundary (orange). The map covers surrounding communities including Des Moines, Burien, Normandy Park, and Tukwila along Puget Sound. -
 2013-09-24
Part 150 Noise Boundary Zones Map — Sea-Tac Airport Commission Presentation
Map showing three overlapping noise boundary zones around Seattle-Tacoma International Airport: the 2018 Future Noise Contour (black), the Current Noise Remedy Boundary (green), and the Updated Noise Remedy Boundary in draft form (orange). The map covers the surrounding communities including Des Moines, Normandy Park, Burien, SeaTac, and Tukwila, adjacent to Puget Sound.