TagForecast(44)
-
 2026-09-01
Emissions Forecast: Traffic Growth Outpaces Fleet Renewal Improvements
IBA ‘Sustainability Watch’ presentation from September 2026 forecasting aviation emissions trends, finding that air traffic growth outpaces efficiency gains from fleet renewal. Published by IBA (‘insights in flight’), the report addresses sustainable aviation, greenhouse gas emissions, and the gap between aircraft fleet modernization improvements and rising passenger demand driving total emissions higher. -
 2026-04-28
Washington State Unconstrained Forecast Report
A draft working document prepared by the Commercial Aviation Work Group presents an unconstrained air travel demand forecast for Washington State's 17 busiest commercial airports, with Seattle-Tacoma International Airport (SEA) leading at approximately 26.3 million enplanements in 2025 out of a statewide total of nearly 29.8 million. The report, dated April 28, 2026, covers market analysis and air traffic forecasts across airports ranging from large hubs like Sea-Tac and Spokane International to smaller facilities such as Renton Municipal and Roche Harbor. The forecast is described as 'unconstrained,' meaning it projects potential demand without accounting for limitations in airport capacity or infrastructure. -
 2026-04-28
Washington State Unconstrained Forecast: Draft Presentation
This draft report, prepared by the Commercial Aviation Work Group and consulting firm Steer, presents an unconstrained air travel demand forecast for Washington State's 17 busiest commercial airports, with Seattle-Tacoma International (SEA) accounting for the vast majority of the state's approximately 29.8 million enplaned passengers in 2025. The forecast combines a short-term bottom-up model based on airline schedules with a long-term top-down model driven by macroeconomic factors such as GDP, population, and airfares, ultimately producing airport-level traffic projections. While focused on statewide aviation demand planning, the findings have direct relevance to Sea-Tac noise policy discussions given SEA's dominant share of regional air traffic. -
 2026-02-25
Introduction to aviation forecasting
This presentation, delivered on February 25, 2026, introduces the fundamentals of aviation forecasting as part of the airport planning process. It outlines how planners forecast passenger demand, aircraft operations, and automobile traffic, then identify physical, operational, and level-of-service constraints before developing and evaluating alternatives. The material emphasizes that while predicting future demand is inherently uncertain, structured forecasting is a critical first step in guiding airport infrastructure decisions. -
 2025-10-28
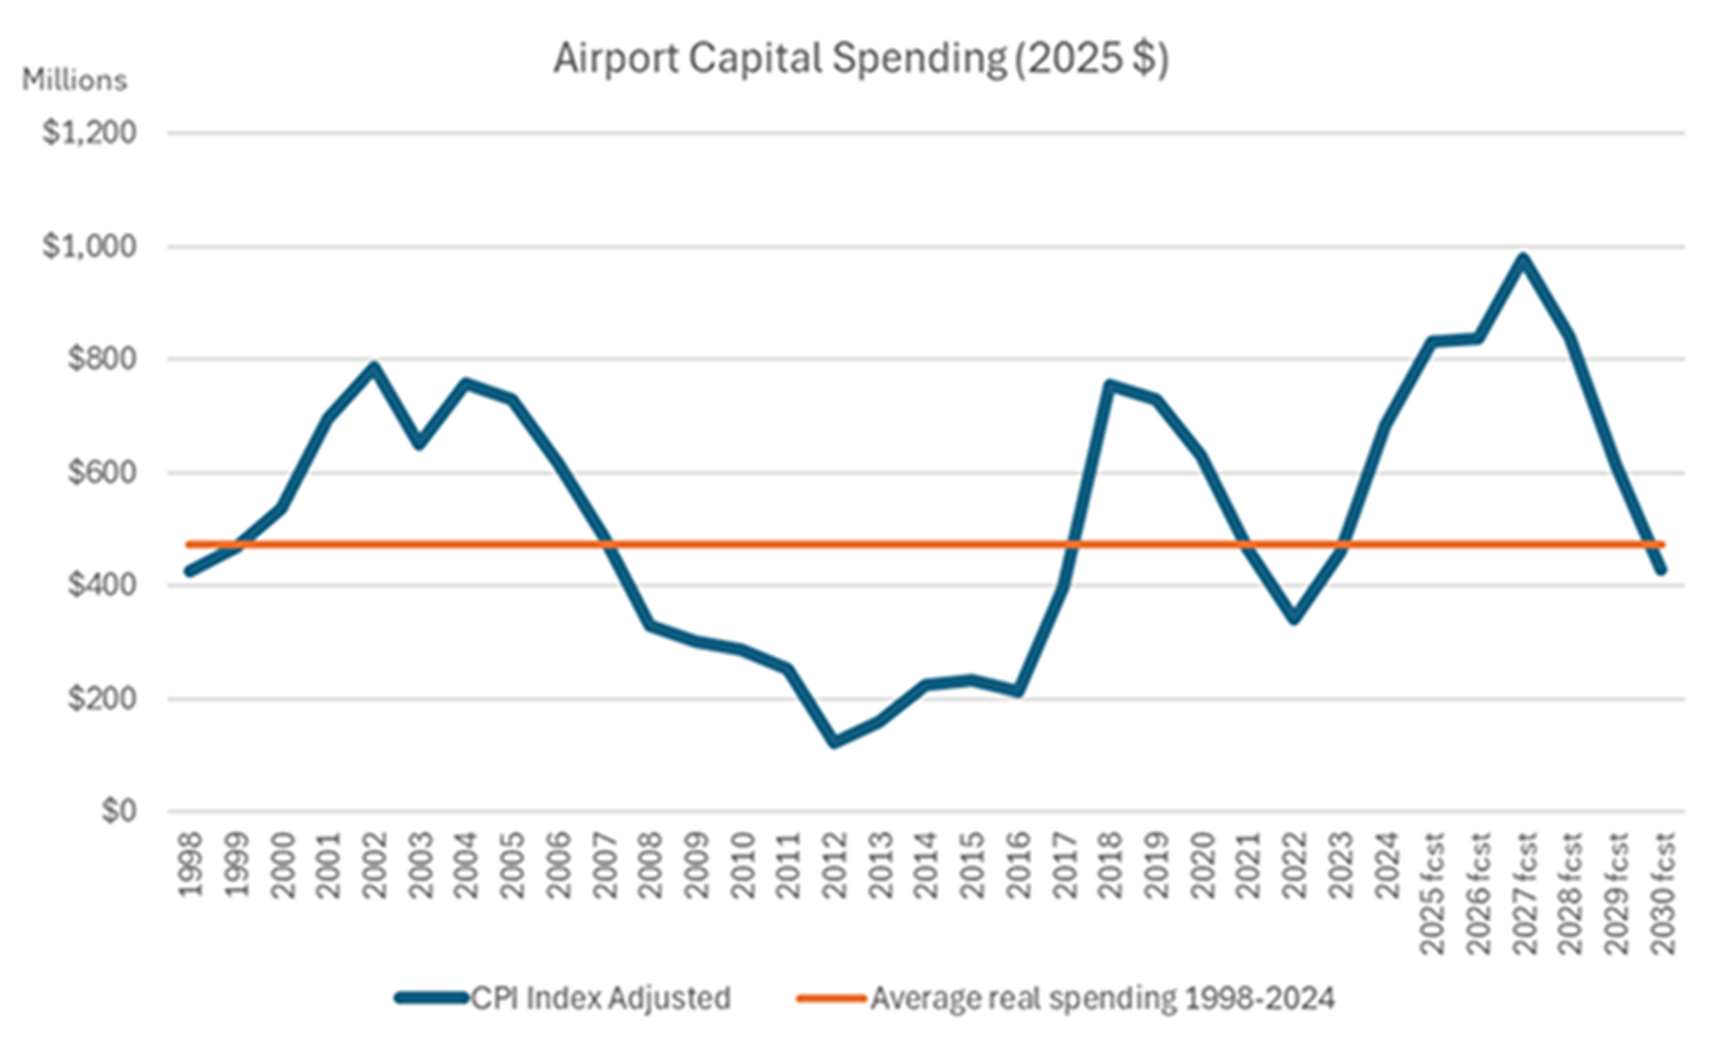
Airport Capital Spending (2025 $)
A line graph showing CPI-adjusted airport capital spending in millions of 2025 dollars from 1998 through 2030 (with years 2025–2030 as forecasts), alongside a flat orange reference line representing average real spending from 1998–2024 at approximately $470 million. Spending peaked around 2002–2005 near $800 million, dropped to a low near $125 million in 2012, recovered to approximately $750 million by 2018–2019, and is forecast to peak near $975 million around 2027 before declining. -
 2025-10-28
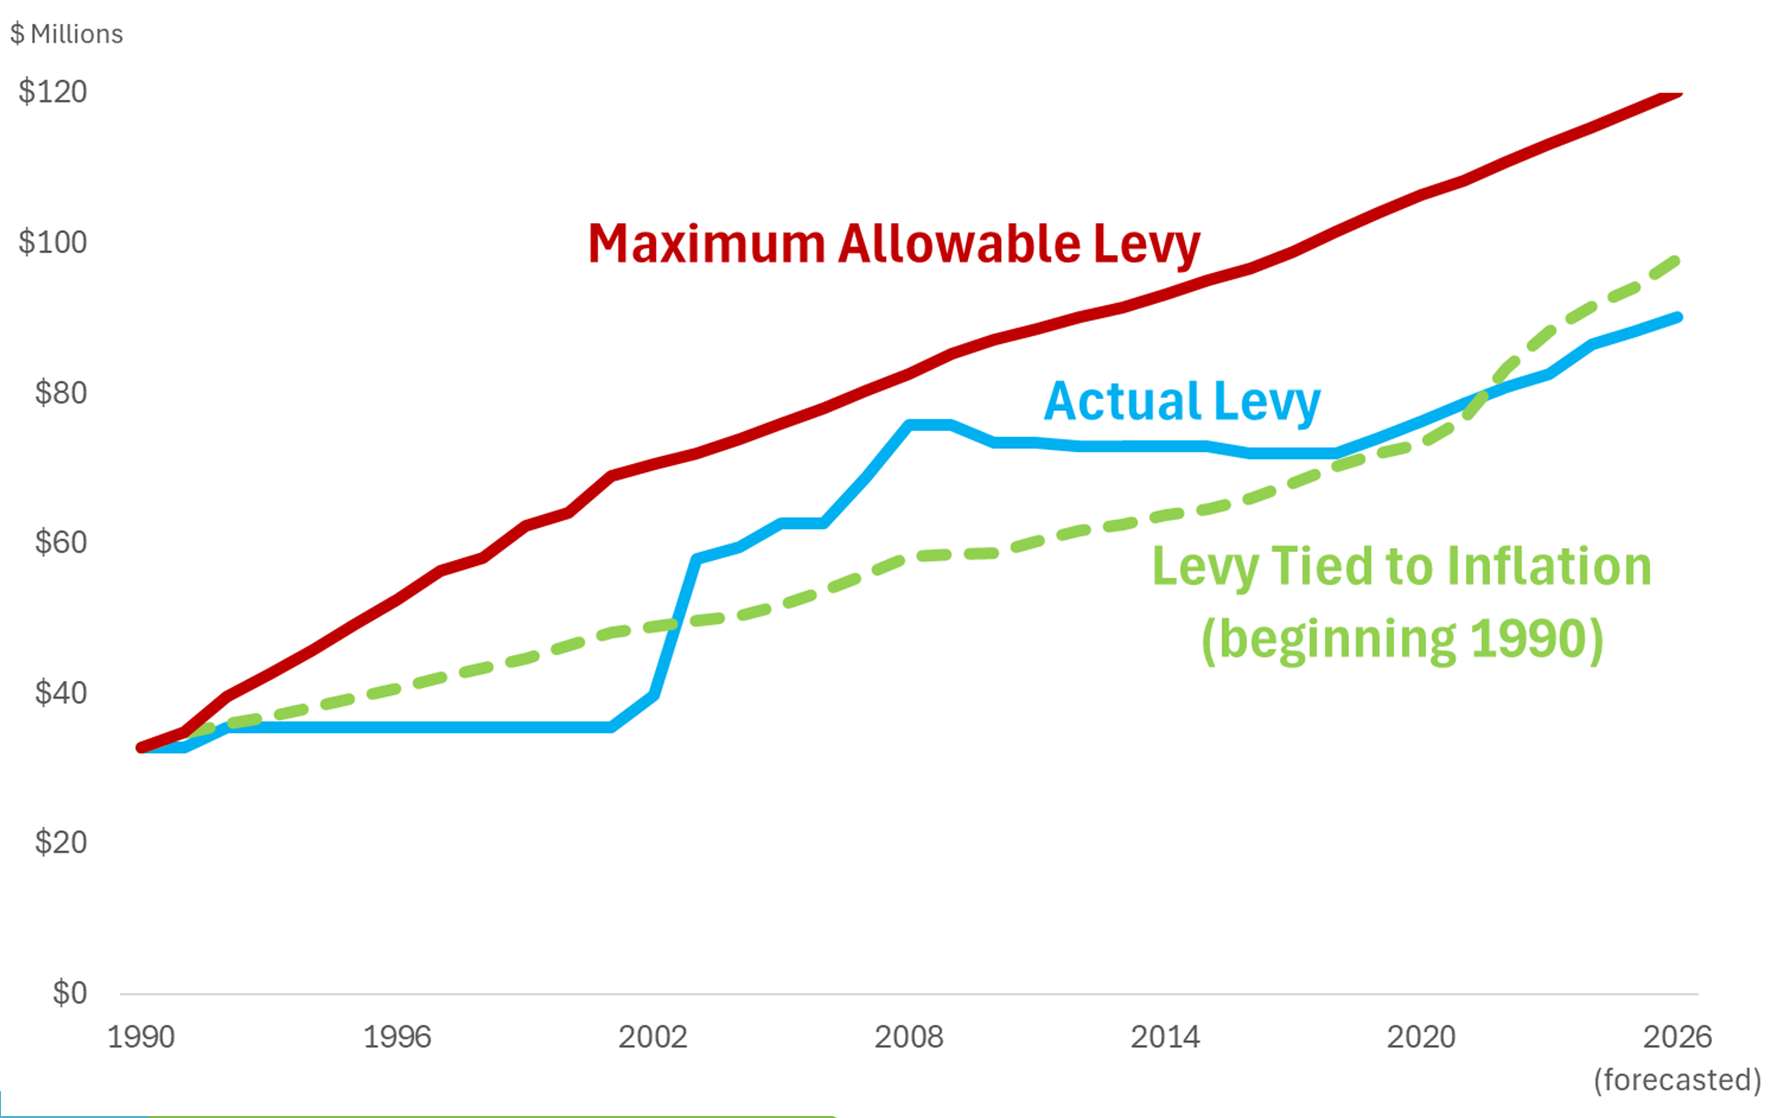
Maximum Allowable Levy vs Actual Levy Comparison (1990-2026)
A line graph comparing three levy trajectories in millions of dollars from 1990 to 2026 (forecasted): the Maximum Allowable Levy (red), the Actual Levy (blue), and a hypothetical Levy Tied to Inflation beginning in 1990 (green dashed). The Actual Levy remained well below the Maximum Allowable throughout the period, with both projected to converge toward approximately $90–$120 million by 2026. -
 2025-10-14
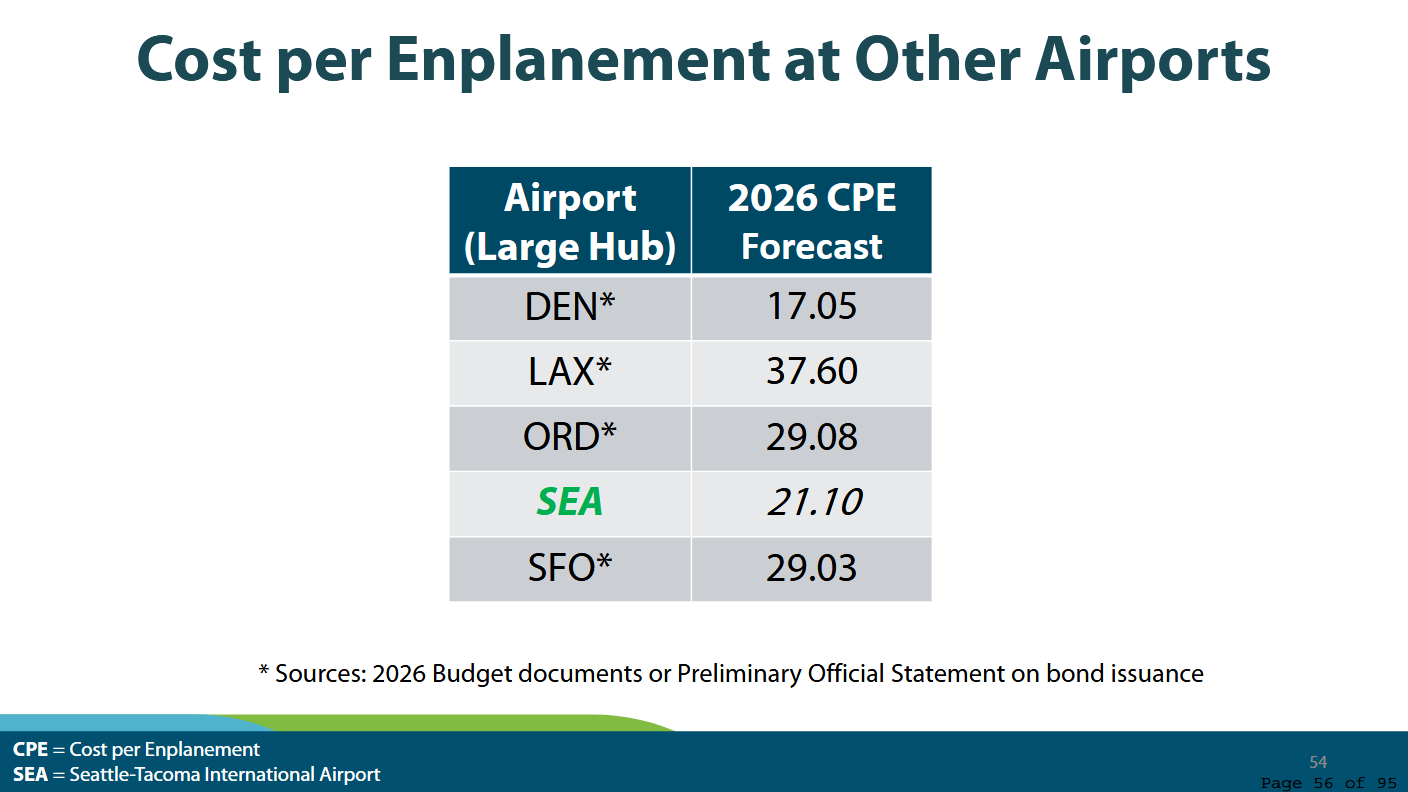
Sea-Tac 2026 Budget CPE Comparison Across Large-Hub Airports
Slide 54 (page 56 of 95) from a Seattle-Tacoma International Airport (SEA) presentation compares 2026 forecast Cost per Enplanement (CPE) across five large-hub airports: DEN ($17.05), LAX ($37.60), ORD ($29.08), SEA ($21.10), and SFO ($29.03). Sources are cited as 2026 Budget documents or Preliminary Official Statements on bond issuance. -
 2025-08-12
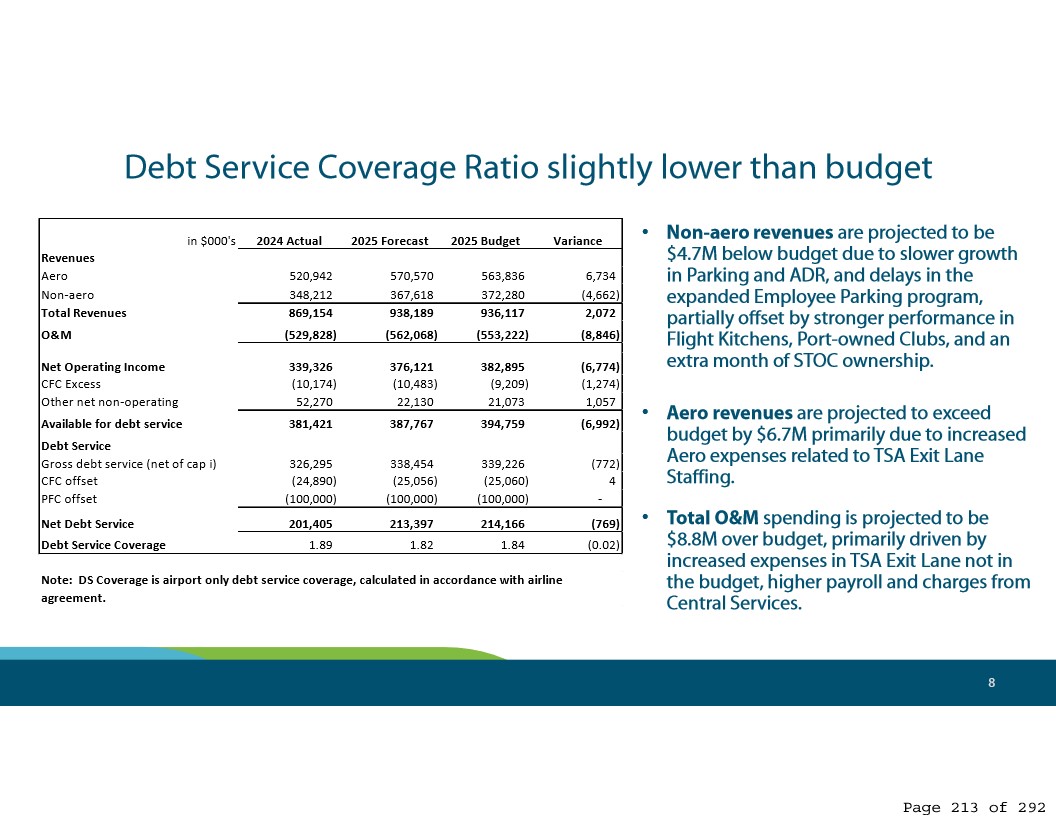
Port Of Seattle Debt Service Coverage Ratio — 2025 Forecast vs. Budget (Page 213)
A financial presentation slide from the Port of Seattle (Sea-Tac Airport) showing the Debt Service Coverage Ratio for 2025, comparing actual 2024 figures, 2025 forecast, and 2025 budget. The slide indicates the debt service coverage ratio is 1.82 (forecast) versus a budgeted 1.84, with total revenues of $938,189K forecasted, and notes that non-aero revenues are projected $4.7M below budget while O&M spending is projected $8.8M over budget. This is page 213 of 292 of a larger document. -
 2025-08-12
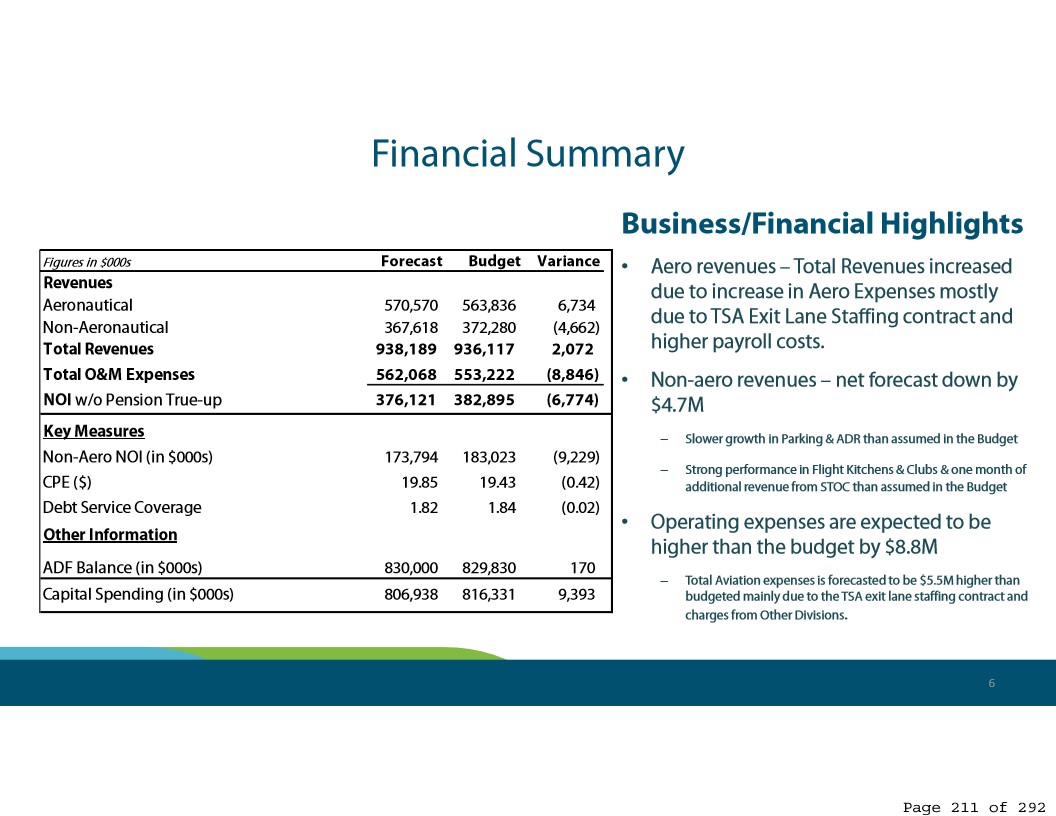
Sea-Tac Airport Financial Summary: Revenue and O&M Expense Forecast vs. Budget — Slide 211
A financial summary presentation slide showing revenue, O&M expenses, and key measures comparing forecast versus budget figures in thousands of dollars. Total revenues forecast at $938,189K versus budget of $936,117K, with operating expenses expected to exceed budget by $8.8M, partly attributed to TSA exit lane staffing contracts. -
 2025-08-12
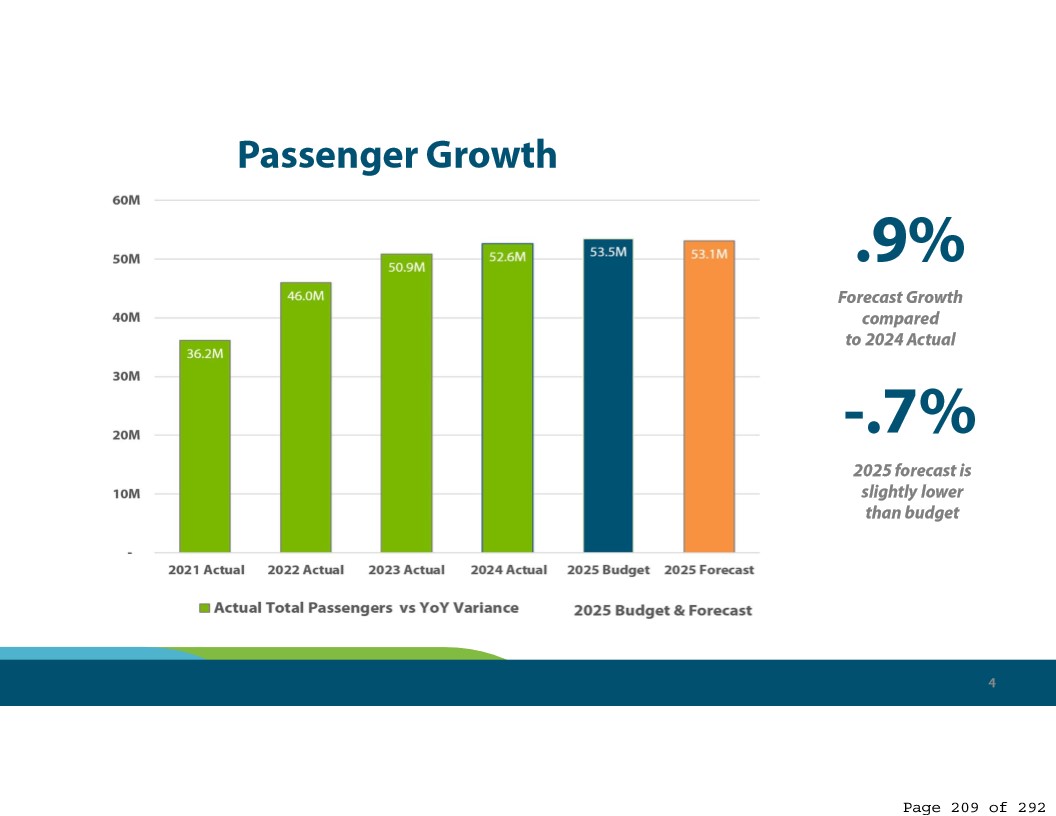
Sea-Tac Airport 2025 Passenger Forecast vs. Budget — RM Packet (Page 209)
A bar chart from a Sea-Tac Airport budget/forecast presentation (page 209 of 292) showing actual total passengers from 2021 (36.2M) through 2024 (52.6M), alongside a 2025 budget of 53.5M and 2025 forecast of 53.1M. The slide notes a 0.9% forecast growth compared to 2024 actual, and that the 2025 forecast is 0.7% lower than budget.