I understand that you will never share my information with anyone, you will only use it to keep me updated on relevant events and that I may unsubscribe at any time.
Since 2016, working to obtain justice for everyone living under the flight path.
Less Noise. Cleaner Air. Better Public Health. Compensation.
Everything you think you know about the airport is wrong.
Flow and Flight Tracks
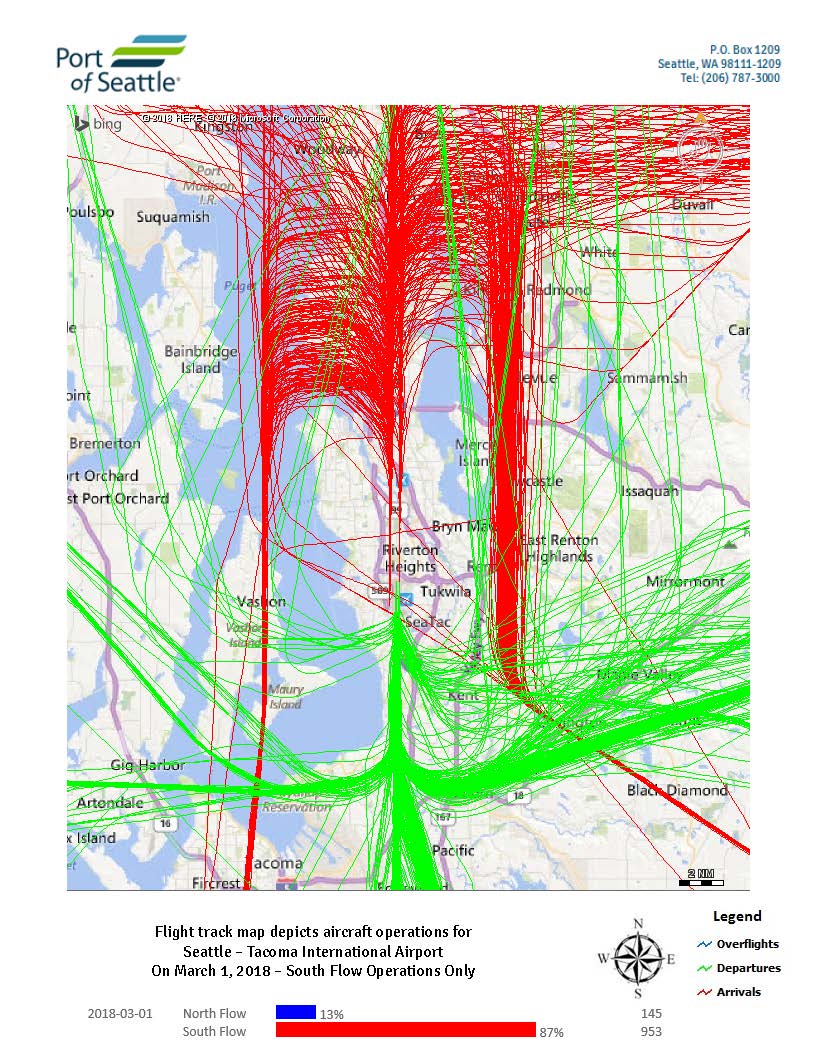
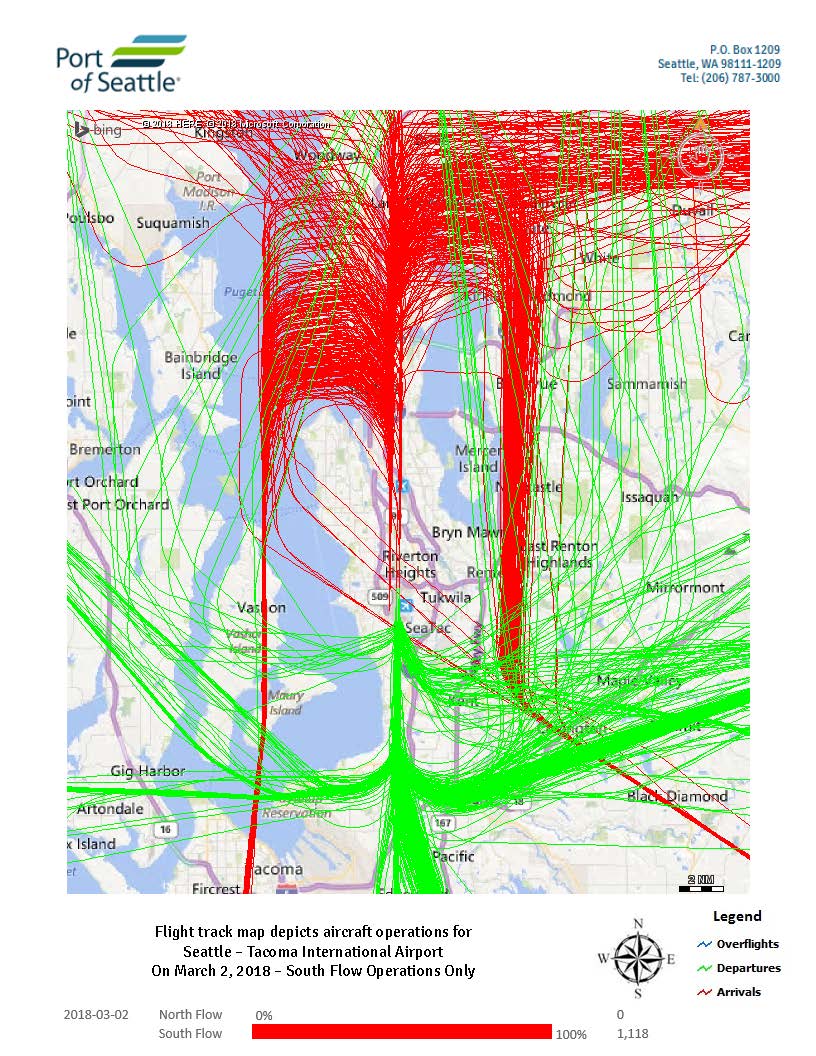
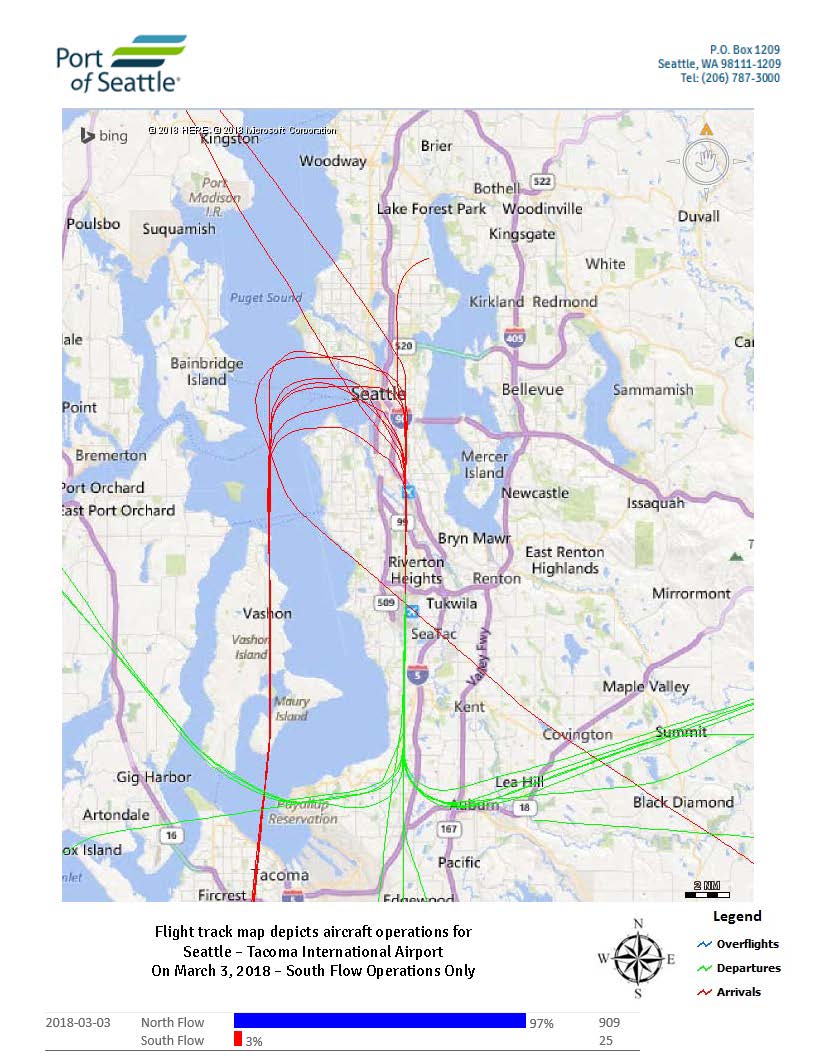
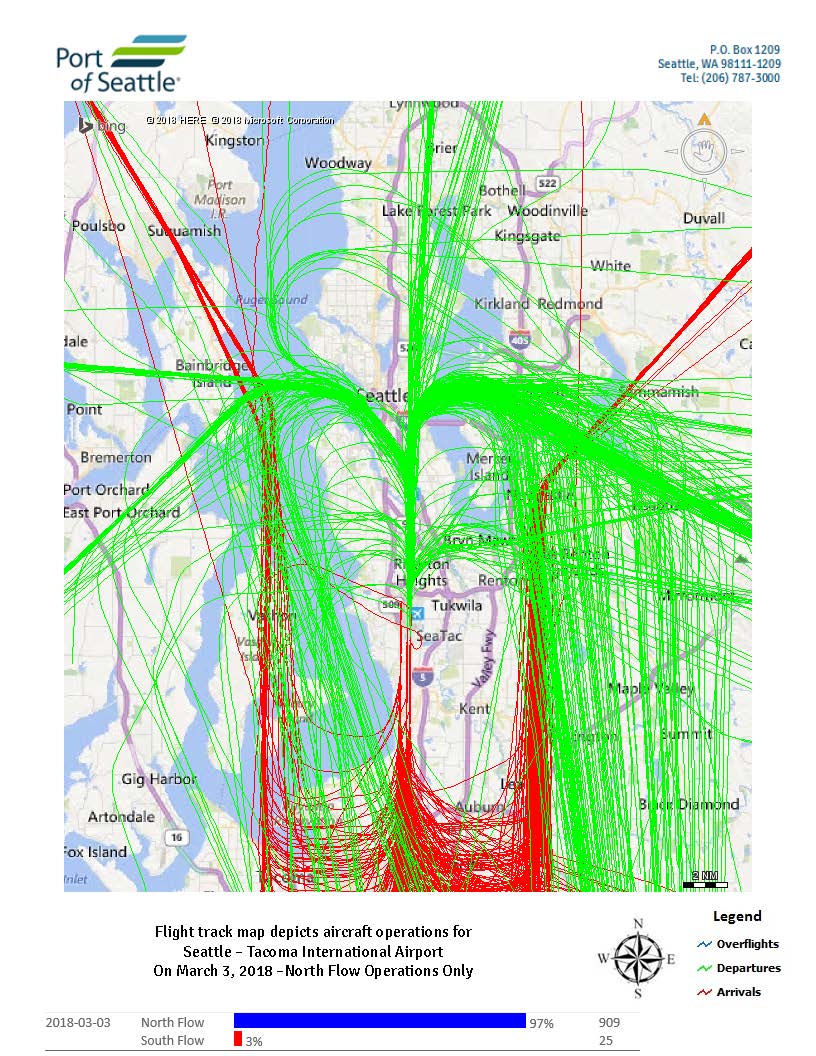
A set of daily tracks from March 1 to March 18, 2018, giving a representation of North Flow and South Flow departure and arrivals. To make sense of these we suggest reading our article on runways and flow.
People who complain about the flight concentration immediately notice the pattern to ‘the funnel’, ie. the points of convergence six miles north and south of the airport which lead to the concentration over Sea-Tac discussed in this article. If you want to learn more, here is our NextGen Explainer.
Port of Seattle flight track map showing aircraft operations at Seattle-Tacoma International Airport on March 1, 2018, during South Flow operations only. The map displays arrivals (red), departures (green), and overflights (blue) with South Flow accounting for 87% of operations (953 flights) and North Flow 13% (145 flights).
Port of Seattle flight track map depicting aircraft operations at Seattle-Tacoma International Airport on March 2, 2018, showing South Flow Operations Only (100%, 1,118 operations). Green lines represent departures, red lines represent arrivals, and blue lines represent overflights, with tracks concentrated along the north-south runway axis over Puget Sound and surrounding communities.
Port of Seattle flight track map depicting aircraft operations at Seattle-Tacoma International Airport on March 3, 2018, showing South Flow operations only (3%, 25 flights) alongside the dominant North Flow operations (97%, 909 flights). The map distinguishes overflights, departures (green), and arrivals (red) over the greater Seattle-Tacoma region.
Port of Seattle flight track map depicting aircraft operations at Seattle-Tacoma International Airport on March 3, 2018, showing North Flow operations only. Green lines indicate departures, red lines indicate arrivals, and blue/purple lines indicate overflights; North Flow accounted for 97% of operations (909 flights) versus 3% South Flow (25 flights).
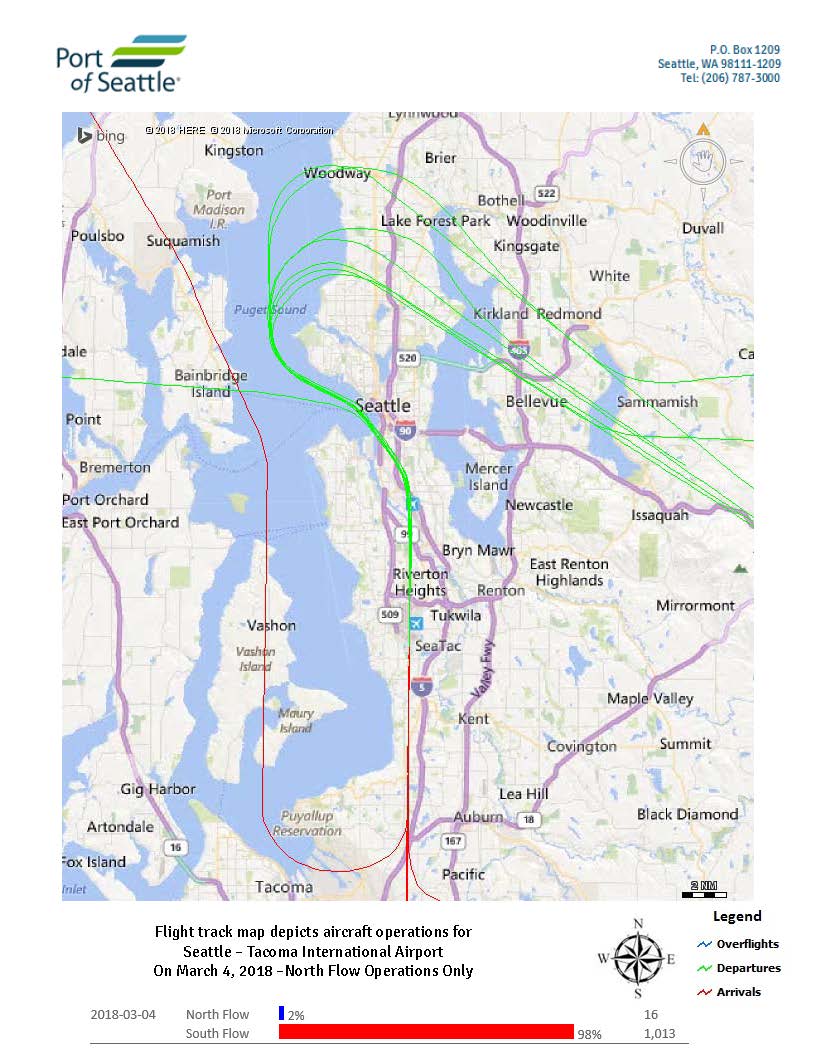
Port of Seattle flight track map depicting aircraft operations at Seattle-Tacoma International Airport on March 4, 2018 under North Flow Operations Only. The map shows 16 north flow operations (2%) and 1,013 south flow operations (98%), with green tracks indicating departures, red tracks indicating arrivals, and blue tracks indicating overflights over the greater Seattle-Tacoma region.
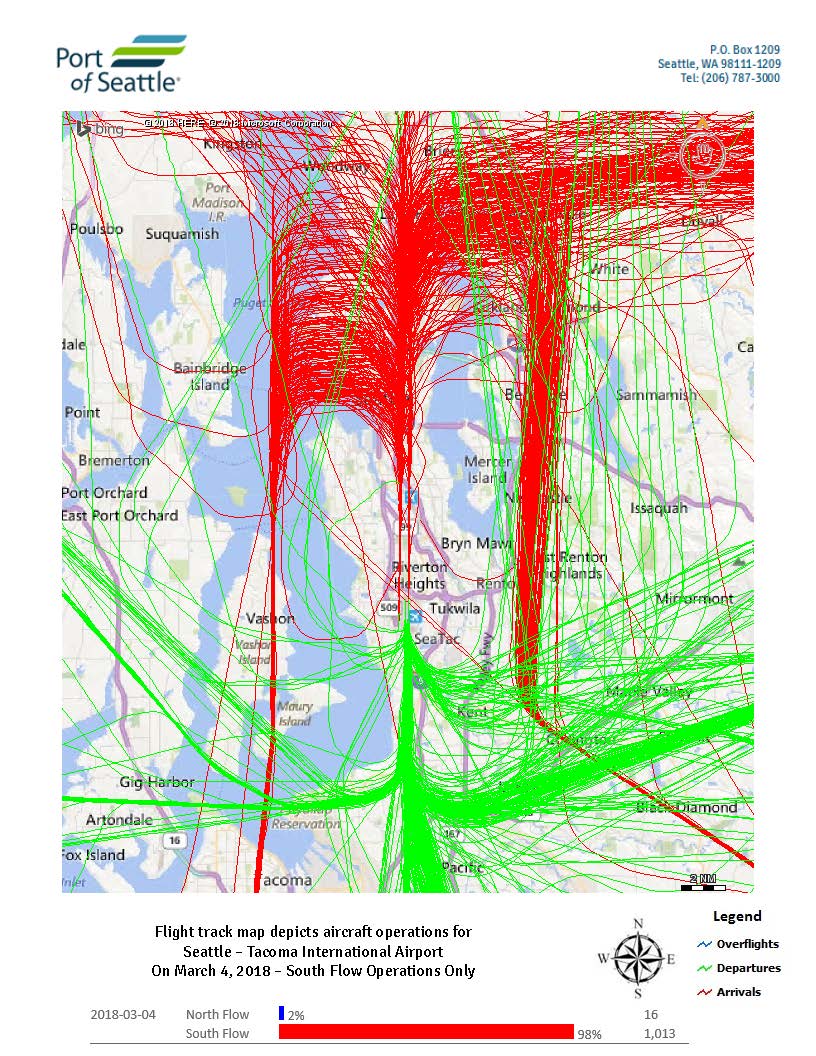
Flight track map produced by the Port of Seattle depicting all aircraft operations at Seattle-Tacoma International Airport on March 4, 2018 under South Flow conditions only. The map shows 1,013 South Flow operations (98%) and 16 North Flow operations (2%), with red tracks indicating arrivals, green tracks indicating departures, and blue tracks indicating overflights.
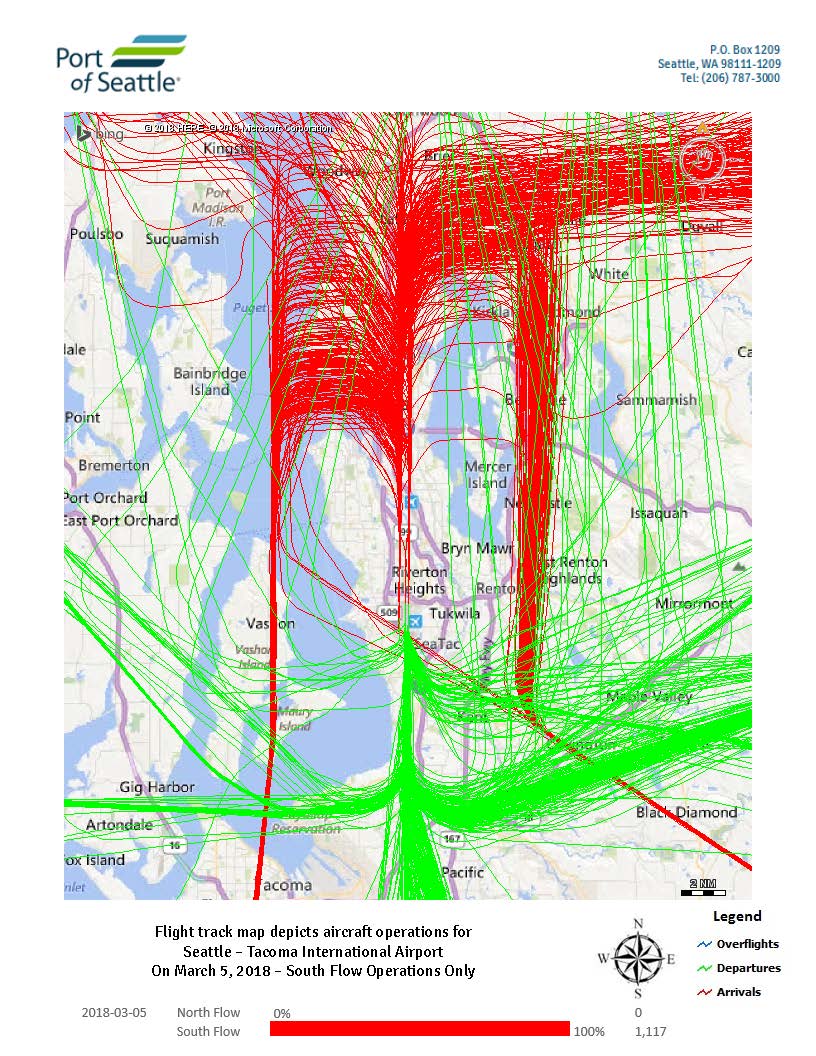
Flight track map produced by the Port of Seattle depicting all aircraft operations at Seattle-Tacoma International Airport on March 5, 2018, during South Flow operations only (1,117 total operations, 100% South Flow). The map shows arrival tracks in red and departure tracks in green overlaid on a Bing/HERE base map of the greater Seattle-Tacoma region.
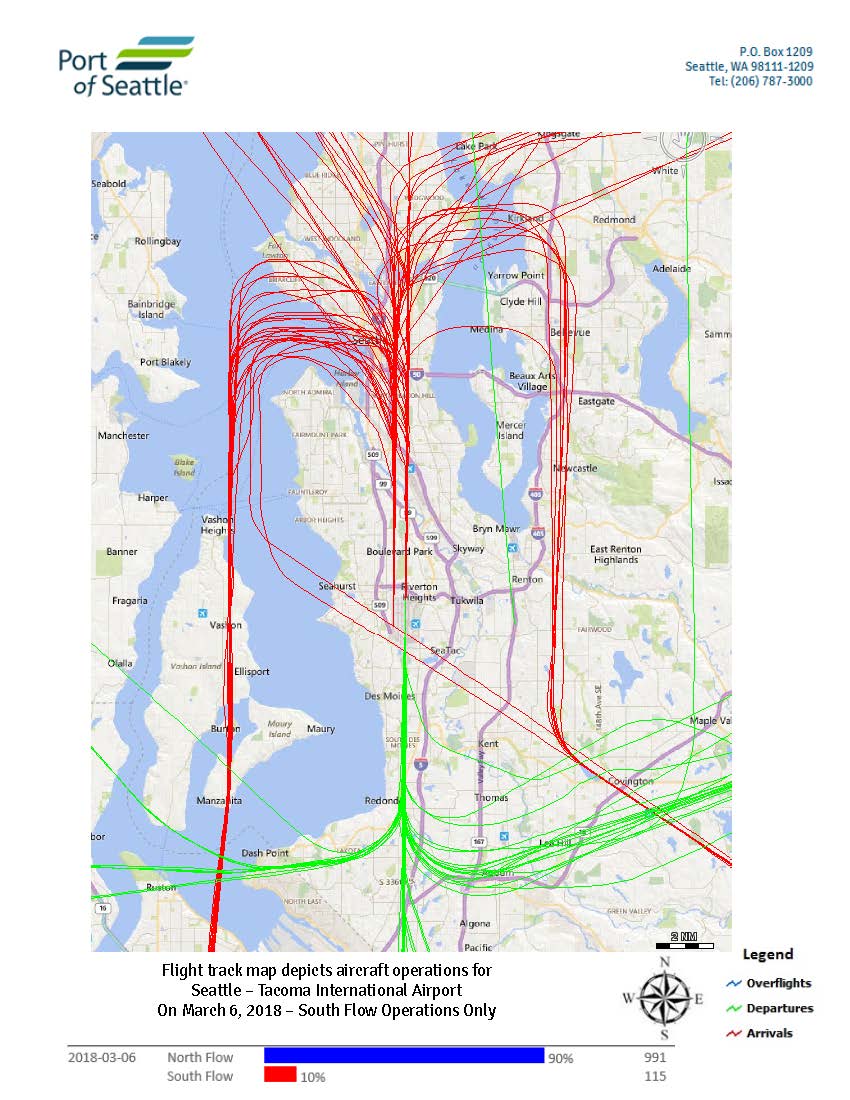
Port of Seattle flight track map depicting aircraft operations at Seattle-Tacoma International Airport on March 6, 2018, showing South Flow operations only. The map indicates arrivals (red), departures (green), and overflights (blue), with South Flow comprising 10% (115 operations) and North Flow comprising 90% (991 operations) of that day's traffic.
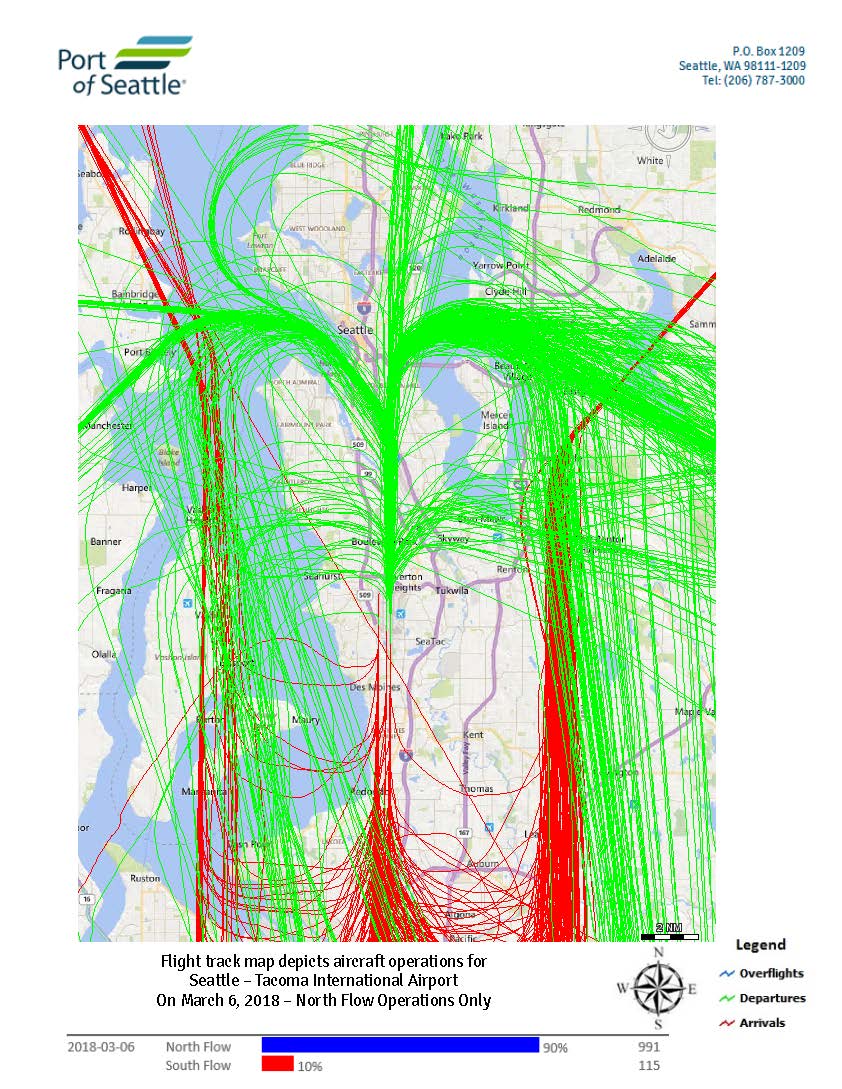
Port of Seattle flight track map depicting aircraft operations at Seattle–Tacoma International Airport on March 6, 2018, showing North Flow Operations Only. On that date, North Flow accounted for 90% of operations (991 flights) and South Flow 10% (115 flights), with departure tracks shown in green and arrival tracks in red.
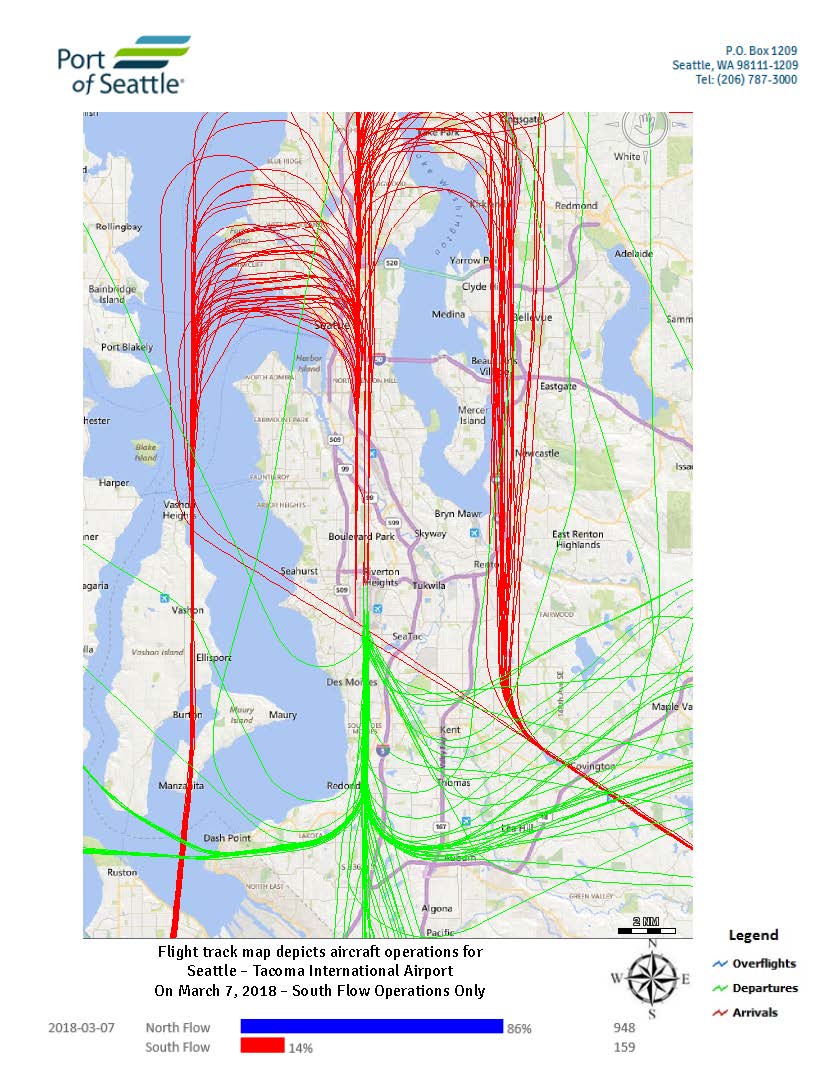
Port of Seattle flight track map depicting aircraft operations at Seattle-Tacoma International Airport on March 7, 2018, showing South Flow operations only. On that date, North Flow accounted for 86% of operations (948 flights) and South Flow 14% (159 flights), with arrival tracks shown in red, departures in green, and overflights in blue.
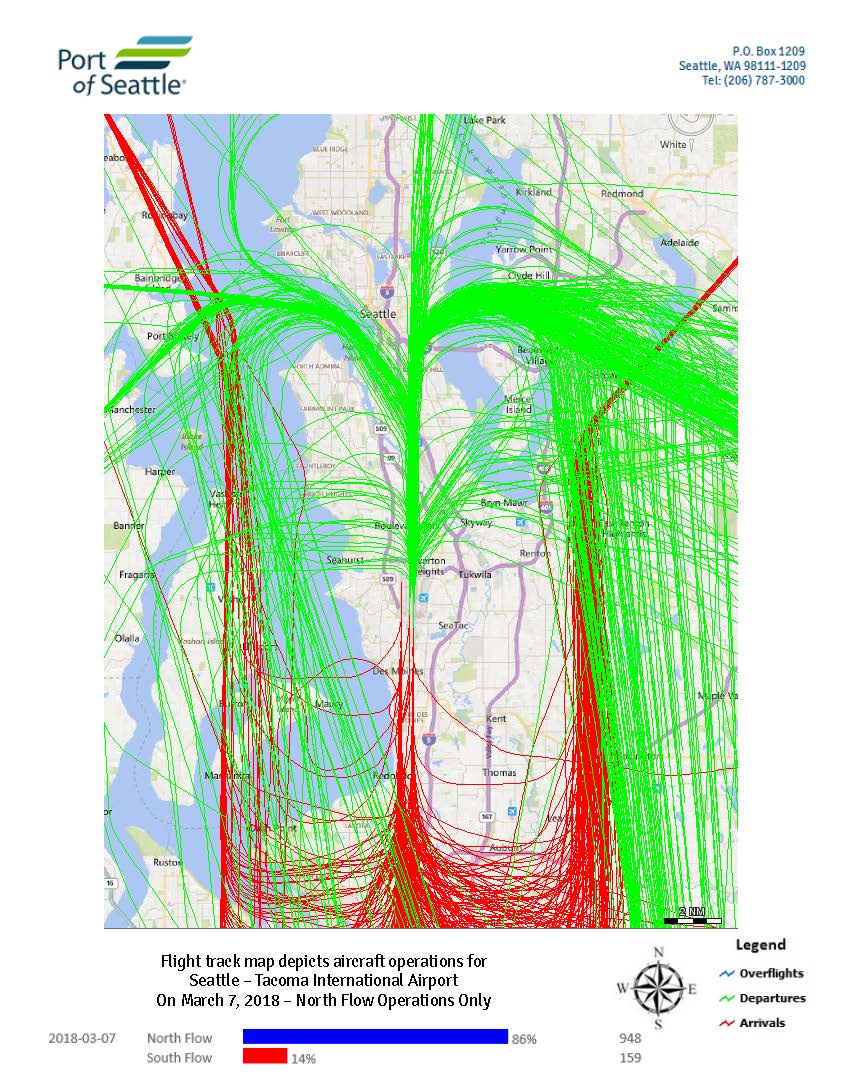
Port of Seattle flight track map depicting aircraft operations at Seattle-Tacoma International Airport on March 7, 2018, showing North Flow Operations only. Green lines indicate departures, red lines indicate arrivals, and blue lines indicate overflights; North Flow accounted for 86% of operations (948 flights) and South Flow 14% (159 flights).
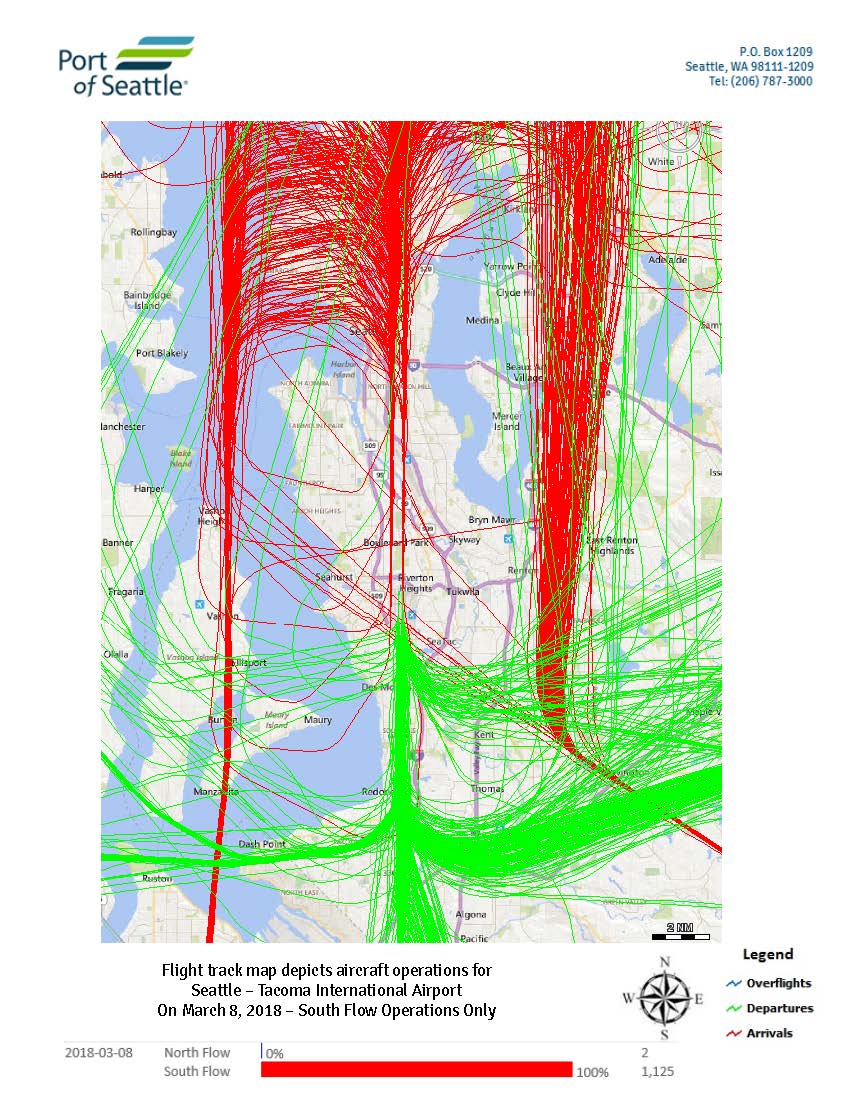
Flight track map produced by the Port of Seattle depicting aircraft operations at Seattle-Tacoma International Airport on March 8, 2018, showing South Flow Operations Only (100%, 1,125 operations) with zero North Flow operations. The map distinguishes arrivals (red), departures (green), and overflights (blue) over the greater Seattle-Tacoma area.
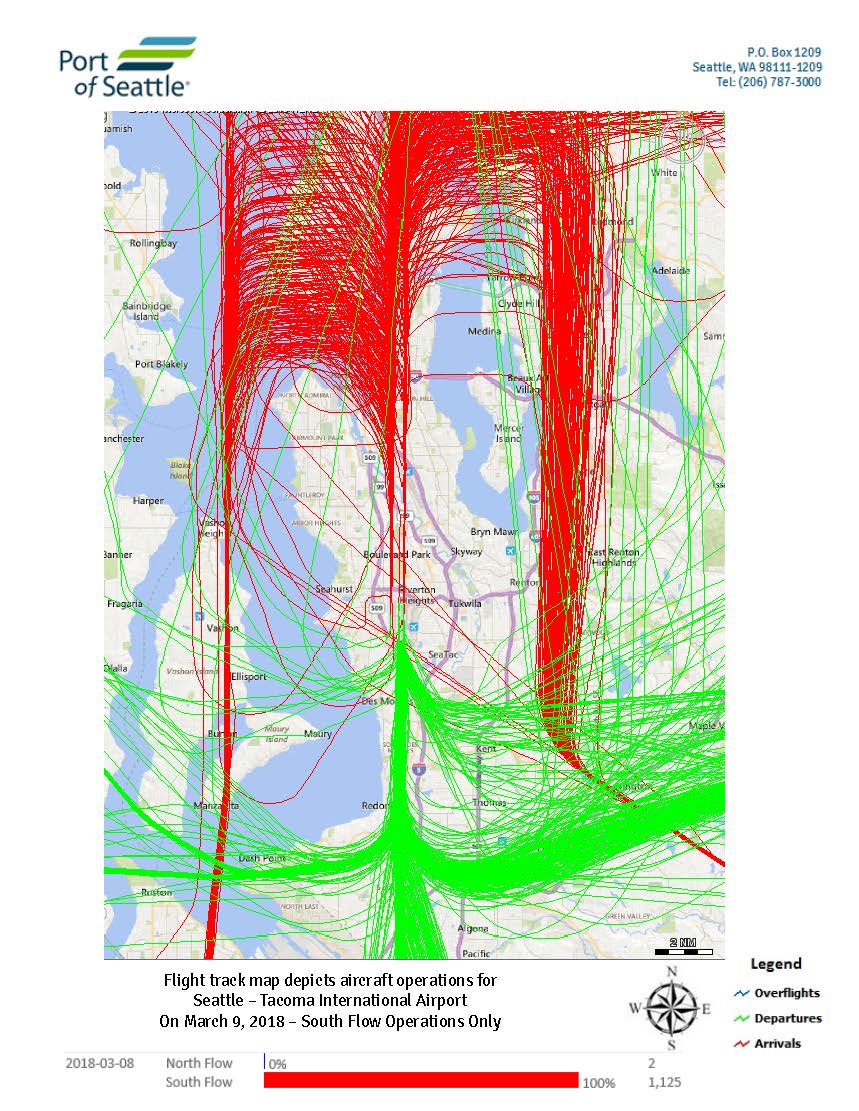
Port of Seattle flight track map depicting aircraft operations at Seattle-Tacoma International Airport on March 9, 2018, showing South Flow operations only (100%, 1,125 operations). The map displays arrivals (red), departures (green), and overflights (blue) overlaid on a geographic map of the greater Seattle-Tacoma area.
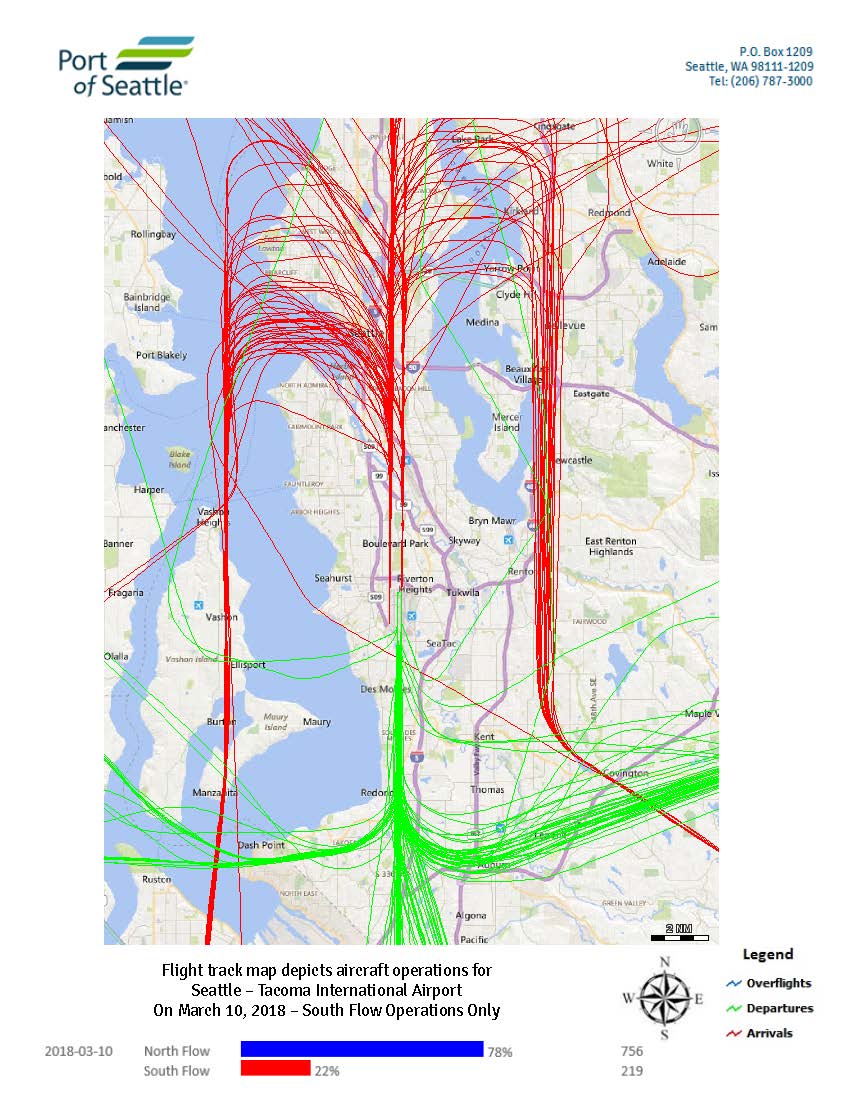
A Port of Seattle flight track map depicting aircraft operations at Seattle-Tacoma International Airport on March 10, 2018, showing South Flow operations only. The map displays arrival tracks in red and departure tracks in green, with a bar chart indicating North Flow accounted for 78% (756 operations) and South Flow 22% (219 operations) of total traffic that day.
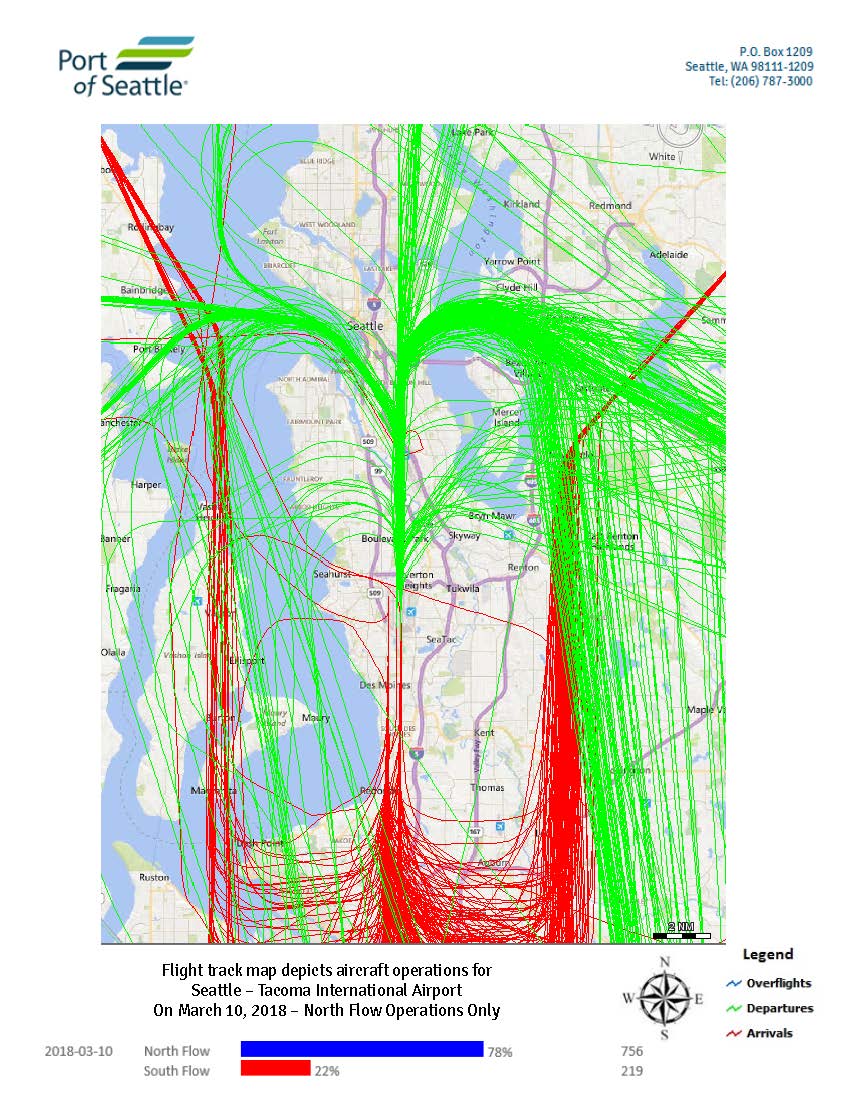
Port of Seattle flight track map showing aircraft operations at Seattle-Tacoma International Airport on March 10, 2018, depicting North Flow operations at 78% (756 operations) and South Flow at 22% (219 operations). Green lines indicate departures, red lines indicate arrivals, and blue/gray lines indicate overflights.
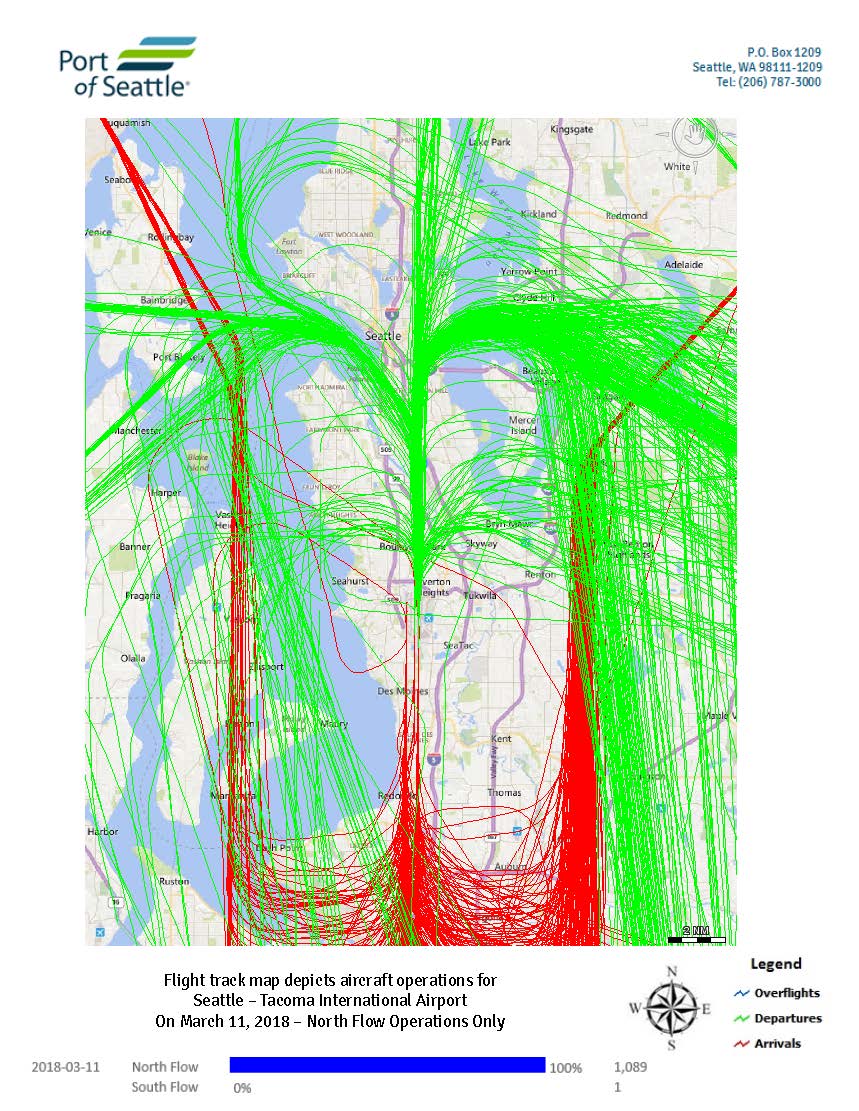
A Port of Seattle flight track map depicting all aircraft operations at Seattle-Tacoma International Airport on March 11, 2018, during North Flow operations only. The map shows 1,089 total operations (100% North Flow), with green lines indicating departures, red lines indicating arrivals, and blue lines indicating overflights, overlaid on a geographic map of the greater Seattle-Tacoma area.
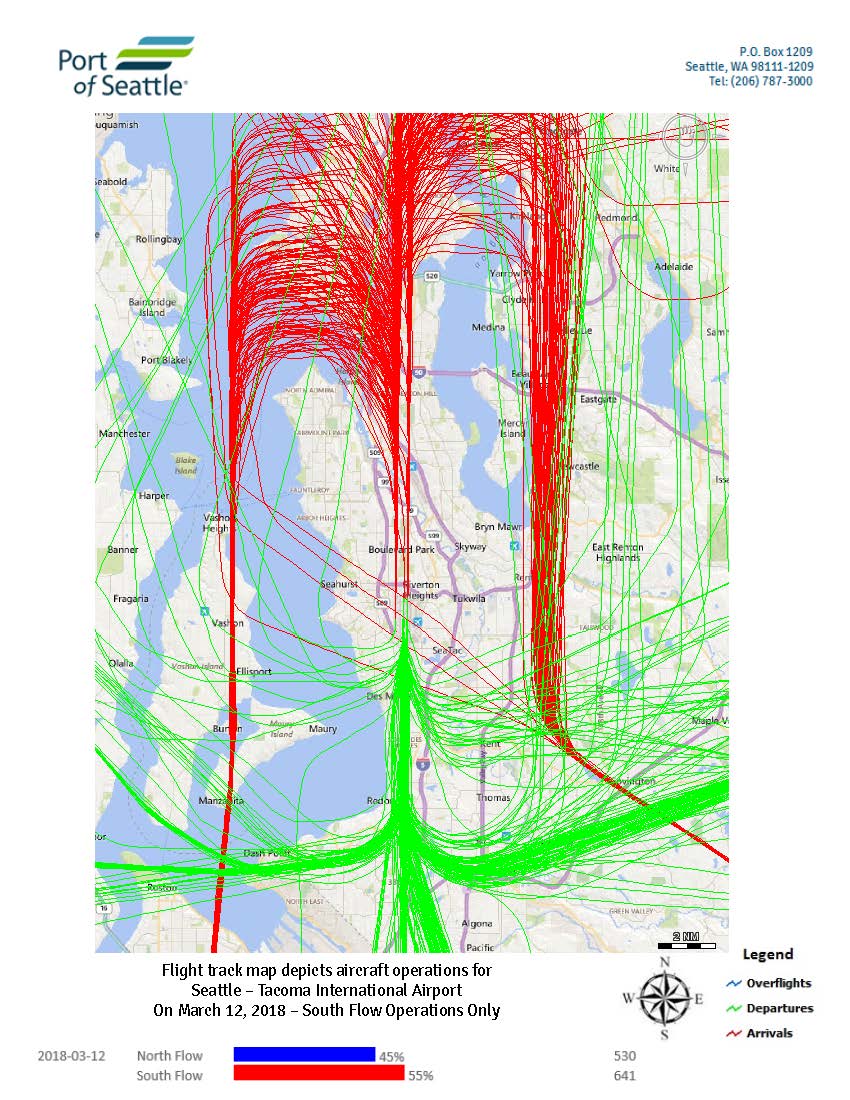
Port of Seattle flight track map depicting aircraft operations at Seattle-Tacoma International Airport on March 12, 2018, showing South Flow operations only. On that date, North Flow accounted for 45% of operations (530 flights) and South Flow accounted for 55% (641 flights); arrival tracks are shown in red and departure tracks in green.
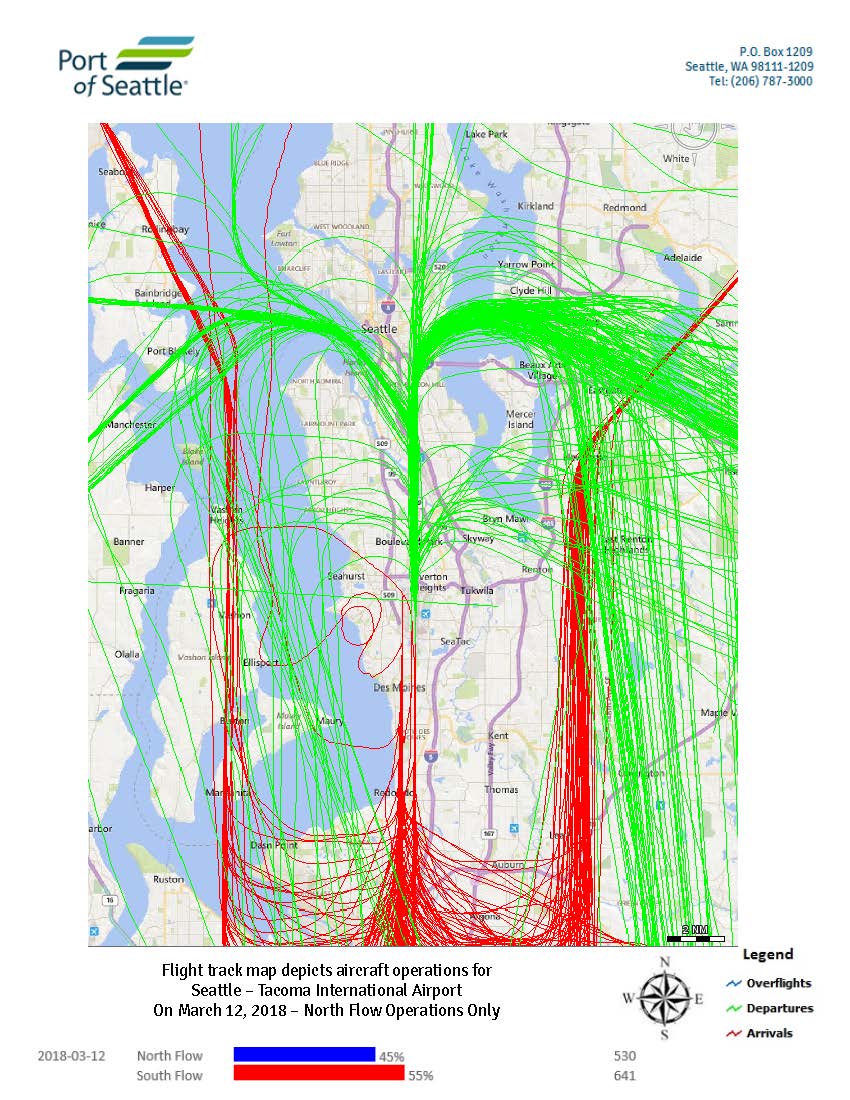
Port of Seattle flight track map showing aircraft operations at Seattle-Tacoma International Airport on March 12, 2018, depicting North Flow operations only. Green lines indicate departures and red lines indicate arrivals; North Flow accounted for 45% (530 operations) and South Flow 55% (641 operations) of the day's traffic.
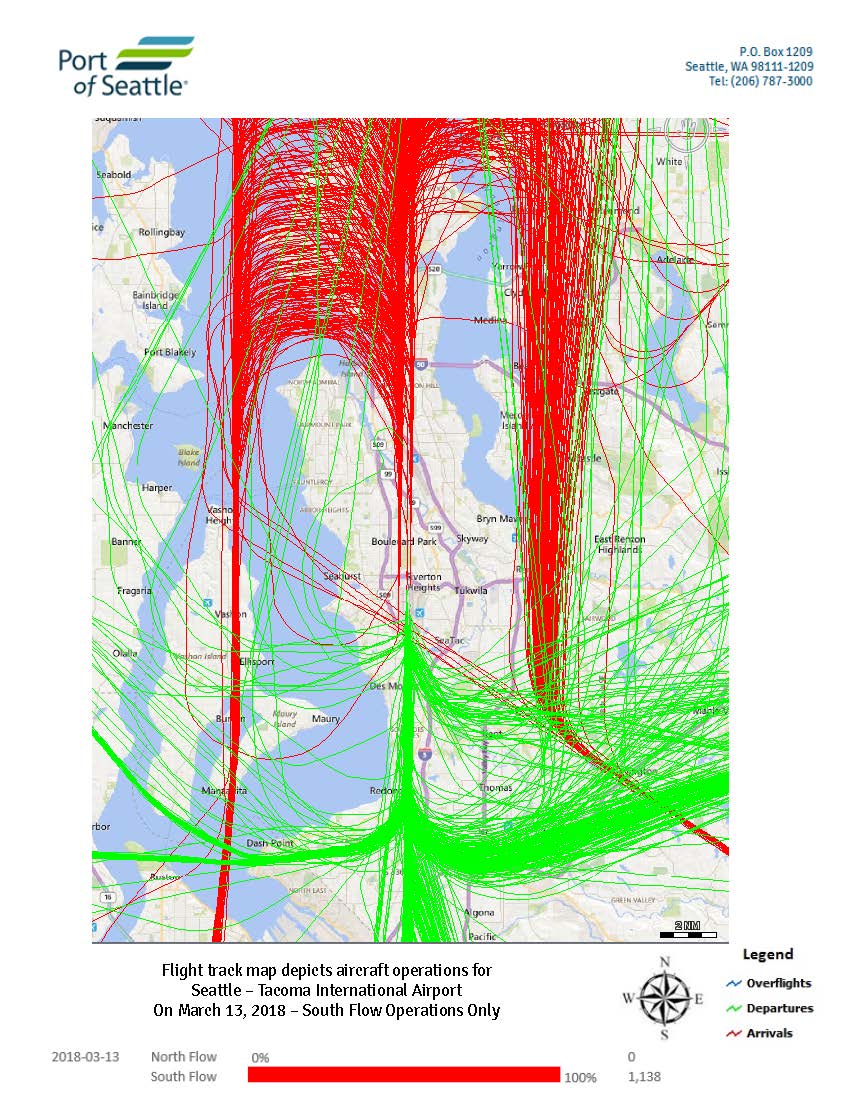
A Port of Seattle flight track map depicting all aircraft operations at Seattle-Tacoma International Airport on March 13, 2018, during South Flow operations only. The map shows 1,138 total operations at 100% South Flow, with green lines indicating departures, red lines indicating arrivals, and blue lines indicating overflights, overlaid on a geographic map of the greater Seattle-Tacoma area.
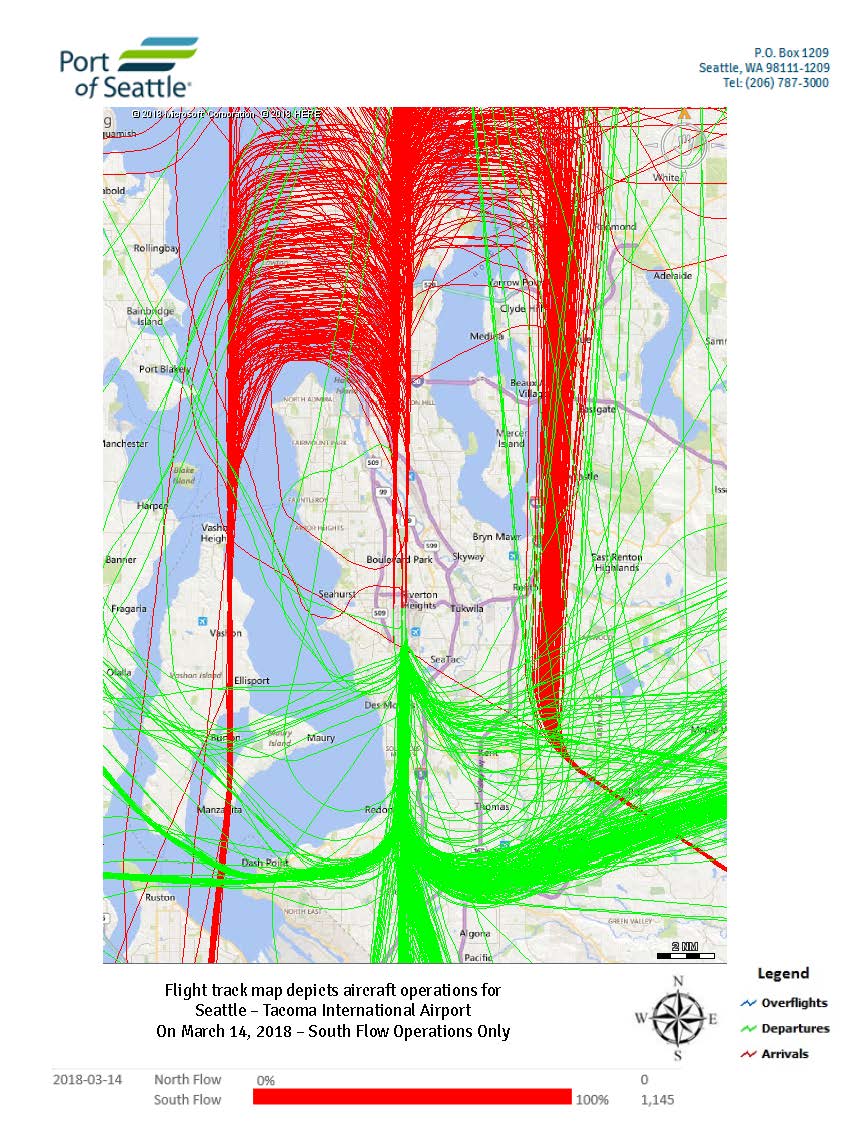
Port of Seattle flight track map depicting aircraft operations at Seattle-Tacoma International Airport on March 14, 2018, showing 100% South Flow operations totaling 1,145 flights. The map displays arrivals (red), departures (green), and overflights (blue) over the greater Seattle-Tacoma area.
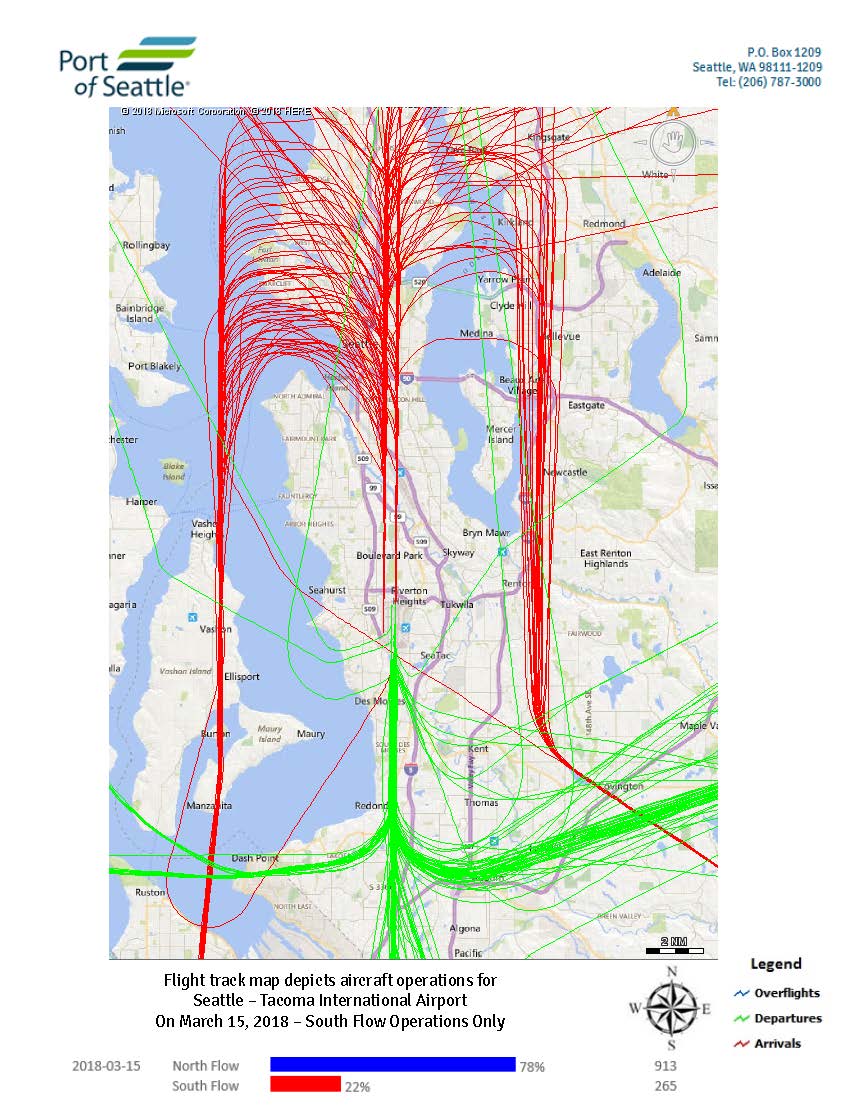
A Port of Seattle flight track map depicting aircraft operations at Seattle-Tacoma International Airport on March 15, 2018, showing South Flow operations only. The map displays arrivals (red), departures (green), and overflights (blue), with data indicating 78% North Flow (913 operations) and 22% South Flow (265 operations) for that date.
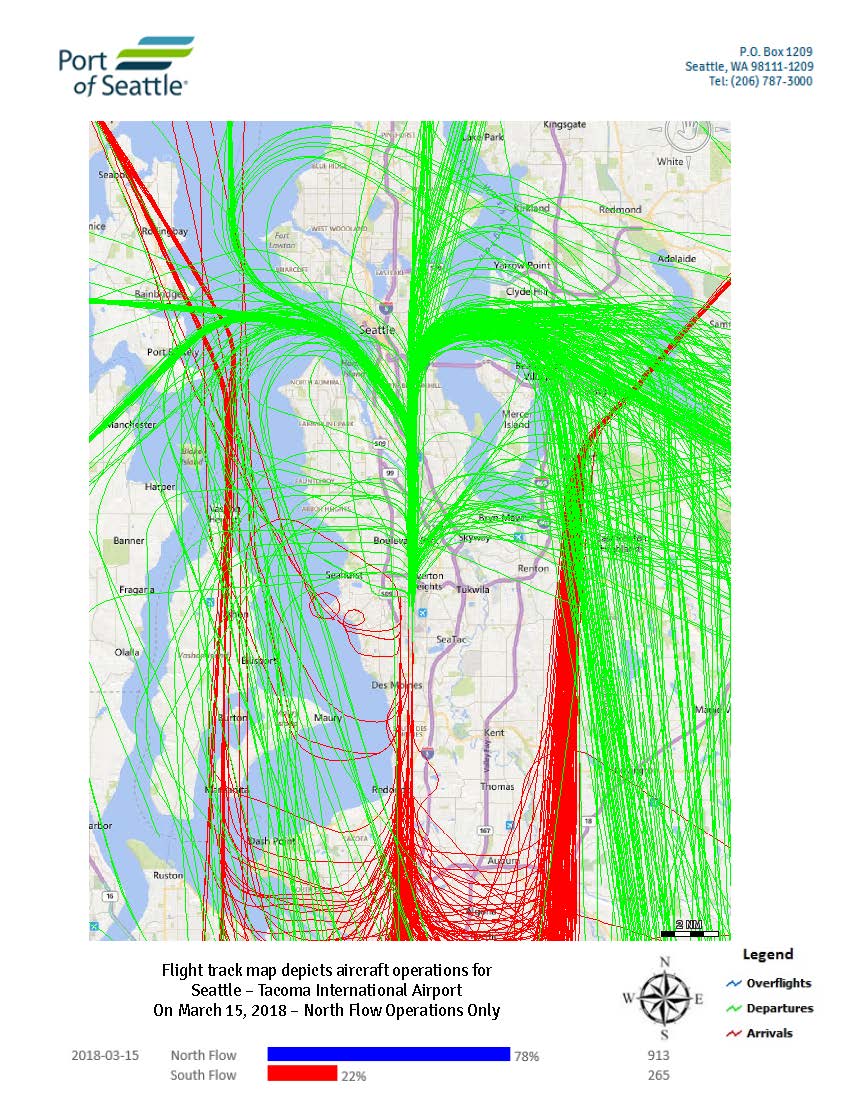
Port of Seattle flight track map depicting aircraft operations at Seattle-Tacoma International Airport on March 15, 2018, showing North Flow operations only (78%, 913 flights) and South Flow (22%, 265 flights). Green lines indicate departures, red lines indicate arrivals, and blue lines indicate overflights, with tracks shown over the greater Seattle-Tacoma metropolitan area.
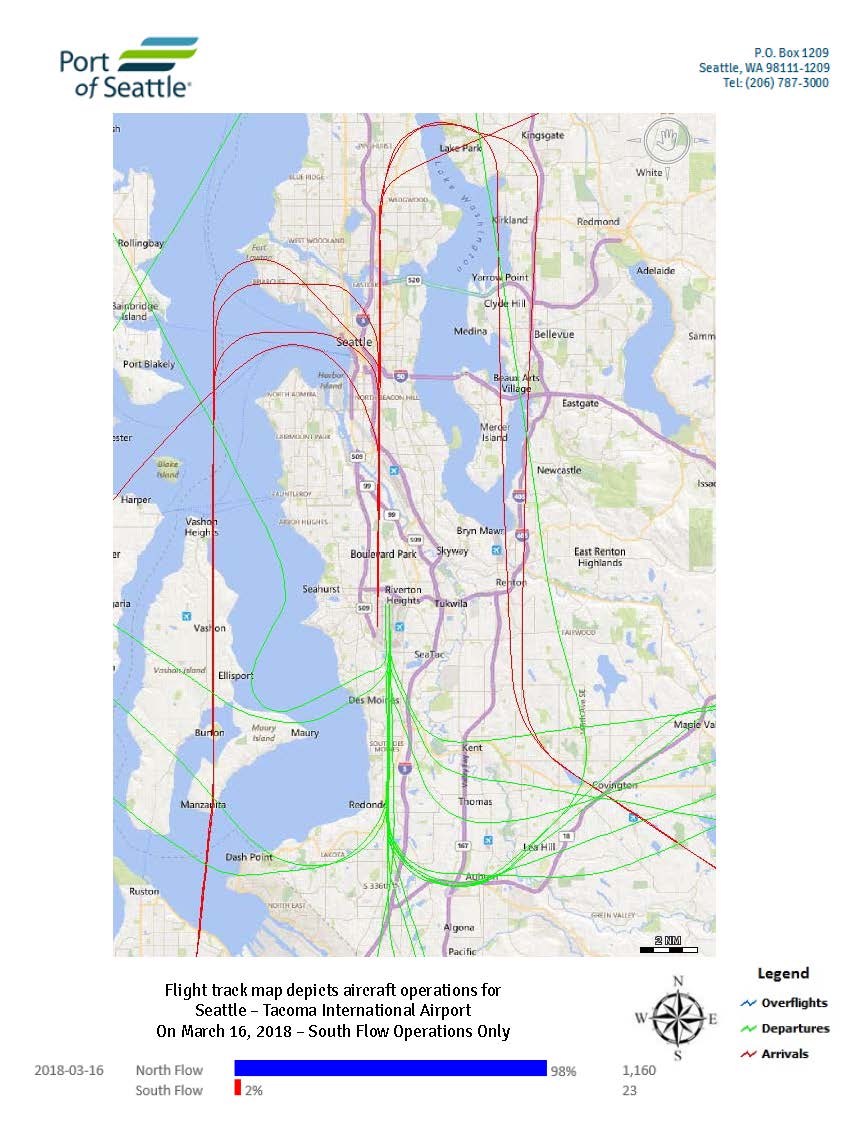
Port of Seattle flight track map depicting aircraft operations at Seattle-Tacoma International Airport on March 16, 2018, showing South Flow Operations Only. On that date, North Flow accounted for 98% of operations (1,160 flights) while South Flow accounted for 2% (23 flights); the map displays overflights (blue), departures (green), and arrivals (red) across the greater Seattle-Tacoma area.
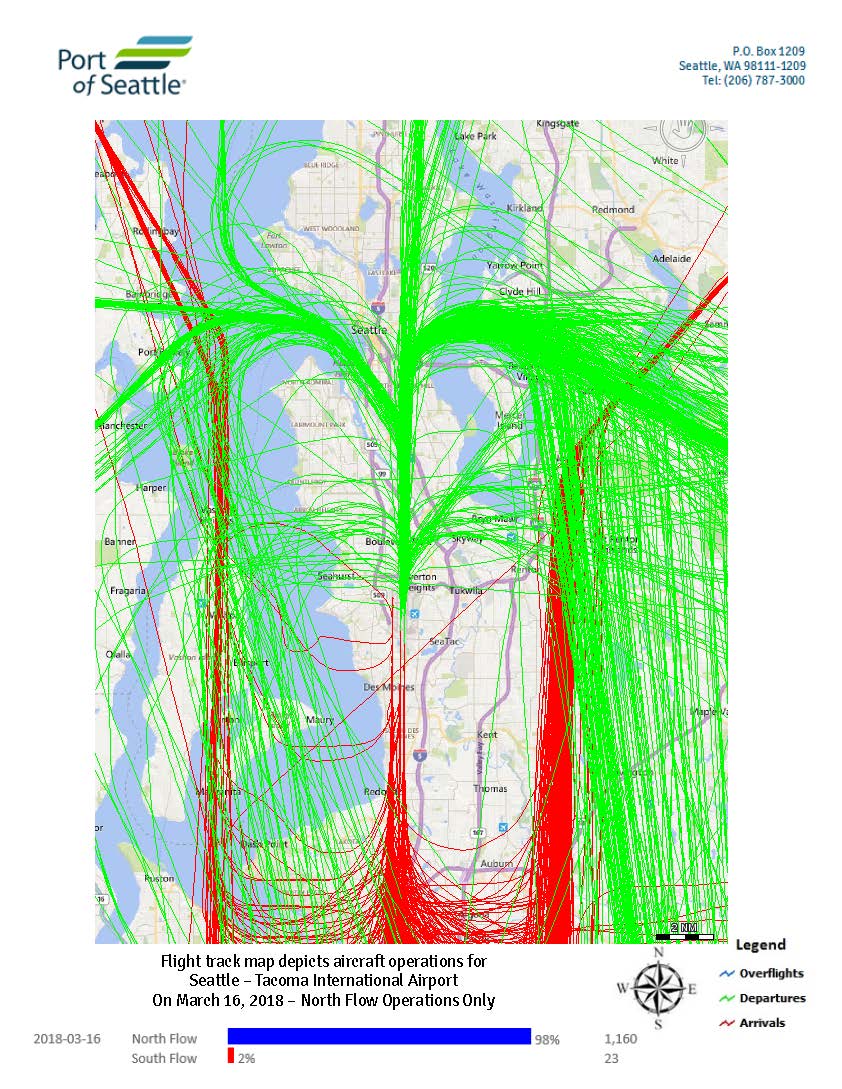
Flight track map produced by the Port of Seattle depicting aircraft operations at Seattle-Tacoma International Airport on March 16, 2018, North Flow Operations Only. On that date, North Flow accounted for 98% of operations (1,160 flights) and South Flow 2% (23 flights); green lines indicate departures, red lines indicate arrivals, and blue lines indicate overflights.
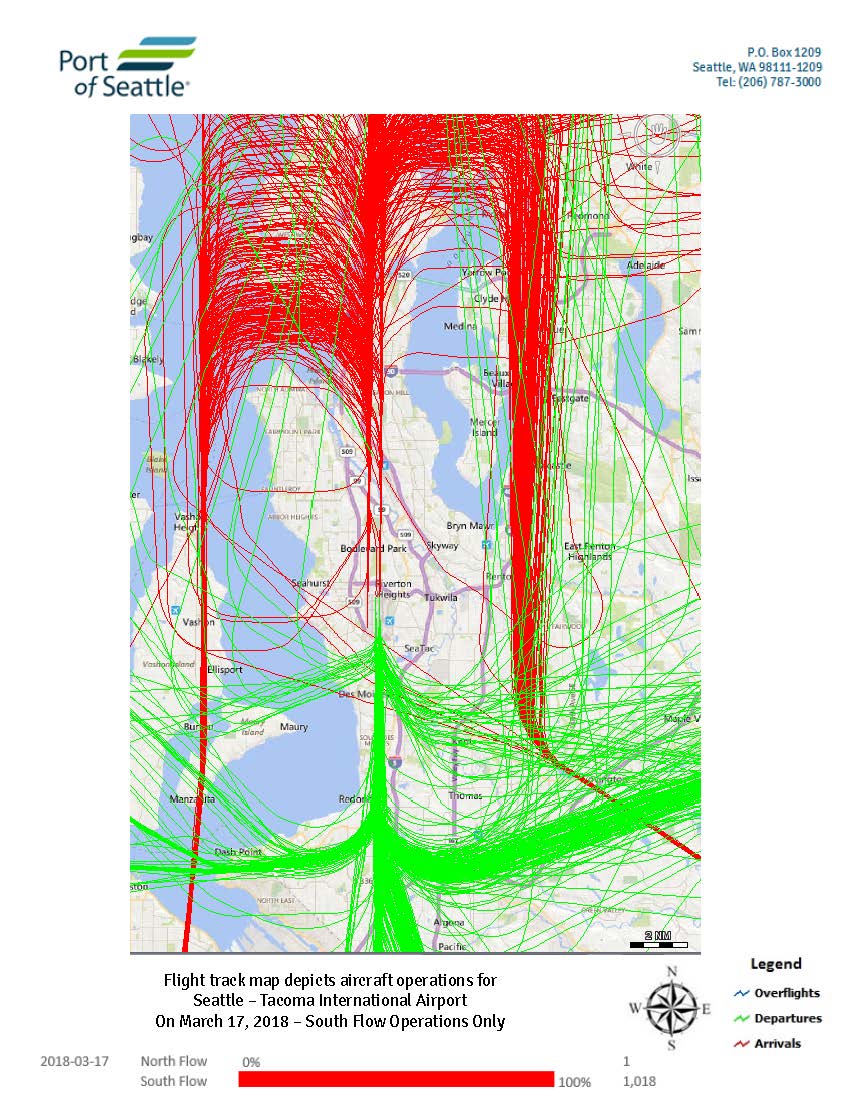
This Port of Seattle flight track map depicts all aircraft operations at Seattle-Tacoma International Airport on March 17, 2018, during 100% South Flow conditions, totaling 1,018 operations. Green lines represent departures, red lines represent arrivals, and blue lines represent overflights, with flight paths concentrated over the Puget Sound region and surrounding communities.
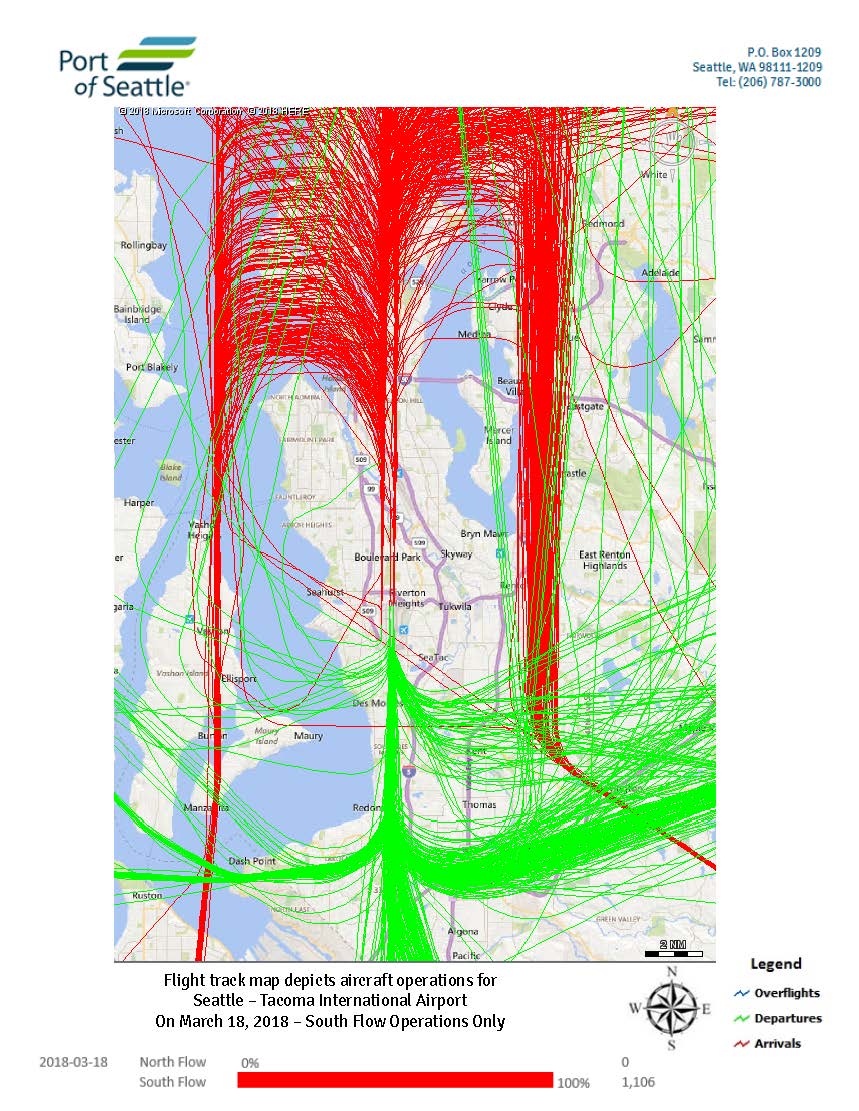
A Port of Seattle flight track map depicting aircraft operations at Seattle-Tacoma International Airport on March 18, 2018, showing 100% South Flow operations with 1,106 total operations. Green lines represent departures, red lines represent arrivals, and blue lines represent overflights, with tracks fanning out from the airport toward Puget Sound and the greater Seattle-Tacoma region.
We use cookies to provide basic functionality. We also provide access to search engines in order to provide site analytics. We do not sell or share your data.