A
After years of headlines about air pollution, we’ve been misled on a few things about the world’s biggest environmental health problem. For example, we’re told that “PM2.5” – solid pollution particles measuring 2.5 micrometres or less – can pass through our lungs and into our blood stream.
But, in fact, the vast majority of them can’t.
We’ve also been told NOx gases – including nitrogen dioxide – are the biggest threat to health within cities. However, NOx is responsible for just 14% of deaths attributed to air pollution in Europe.
The biggest killer of all never makes the headlines, isn’t regulated, and is barely talked about beyond niche scientific circles (despite their best efforts to change that narrative): it’s nanoparticles.
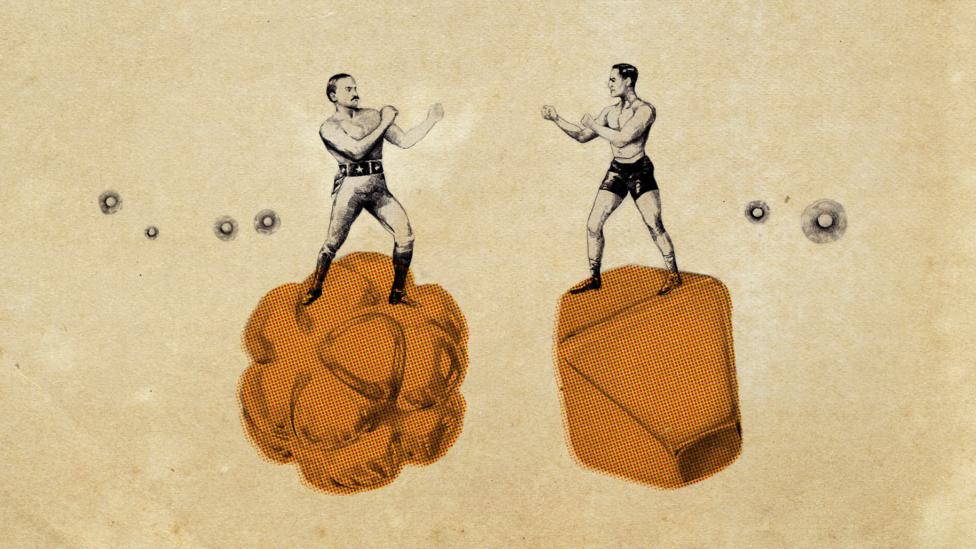
PM2.5 may be too small to see, being roughly 30 times smaller than the width of a human hair. But it’s a relative heavyweight. PM2.5 stomps in at 2,500 nanometres (nm), while nanoparticles are 100nm or below. PM2.5 and PM10 (10,000nm) are killers in their own right, typically causing lung and respiratory conditions. Yet nanoparticles can reach, and wreak havoc in, any organ in the body. And because government authorities monitor PM2.5 by mass (million of nanoparticles may not even register a measurement by microgram) – their reports underrepresent the true risks.
The science of why we should be concerned about the total number of particles that we breathe in, not just their mass, has been known for some time. In 2003, Surbjit Kaur was a young researcher finishing her Masters at Imperial College London, when her supervisor suggested she join the Dapple experiment (the Dispersion of Air Pollution and its Penetration into the Local Environment). Kaur designed a personal exposure study, with a team of six volunteers “dressed up like Christmas trees” with various different air pollution sensors, and asked them to travel a set route in central London every day for four weeks.
You might also like:
- How air pollution is doing more than killing us
- How dirty air can affect your gut health
- The tiny changes air pollution makes inside you
The volunteers “were a combination of friends and people in the department” says Kaur, who has since left science and now works as a management consultant. “But I couldn’t really ask people to do this if I wasn’t doing it myself.” She joined them out on the roadside, which centred around Marylebone Road, a major seven-lane highway and home to the Madame Tussauds waxwork museum, and its lengthy queues waiting outside. “We went out there knowing that we were going to get ill because of that constant exposure. We began to feel quite grotty after a while.”
The equipment draped over the volunteers and inside backpacks measured the standard air pollutants, PM2.5 and CO (carbon monoxide). But Kaur also included a brand-new piece of kit that had only just come on the market: a ‘P-Trak’ nanoparticle counter. “We needed to get all sorts of approvals to use them [in the field work] because they looked a bit like Geiger-counters and there were concerns that the public might panic,” she laughs. The device could count nanoparticles right down to 2nm (many times smaller than a human blood cell) by sucking in air, spraying alcohol onto the surface of the particles to make them visible and individually counting by laser beam. Influenced by work emerging from University of Rochester, New York, and the National Public Health Institute, Finland, Kaur had a hunch that counting these “ultrafine particles” could add some interesting data. She wasn’t wrong.

Surbjit Kaur’s 2003 study in London found volunteers were subjected to up to 130,000 particles at a time (Credit: Emmanuel Lafont)
“I expected a certain level of variation [in particle number]”, she says, “but the level of fluctuation really surprised me… The volume of cars that went past had very little impact on people’s exposure to PM2.5. But it had a massive impact on ultrafines.” As the volunteers pounded the pavements, they were exposed to a minimum of 36,000 particles at a time, up to a maximum of 130,000. When they took the same route by bicycle (tricky, but not impossible, with all the equipment), the maximums and minimums went up by another 20,000.
However, the highest averages were recorded inside the cars and buses: the closer to the source of the pollution, the exhaust pipes spewing out the fumes, the higher the total number of nanoparticles. The difference between walking by the kerbside of the road, and by the building side, on the same pavement – just a few short steps – was an average of 82,000 particles versus 69,000. The same readings registered no change in PM2.5.
Around 2006, just as Kaur was stepping away from science – her findings having made no difference to how government authorities measured air pollution exposure – a doctoral student at the University of Cambridge picked up the baton. Prashant Kumar had already studied PM2.5 and PM10 for his Masters at the Indian Institute of Technology (IIT) in Delhi. But upon arriving in England for his PhD, “in discussions with my supervisors we found there as very little, or almost nothing, done on the understanding [of nanoparticles]: their measurements, the concentrations in different environments. So I took up that topic as a challenge.” His subsequent flurry of papers published from 2008 onwards have become seminal work on nanoparticle exposure, and led to his professorship at the University of Surrey.
A cloud of a billion 10nm particles has the same mass as just one PM10 particle, but a combined surface area a million times larger
“The first study I carried out in 2008 was an exploratory analysis,” recalls Kumar. “When the exhaust fumes come out of vehicles, they come out as gases and cool into smaller [nano] particles. Then they start to accumulate to make bigger particles. From the tailpipe you can get 10-to-the-power-of-six (one million) particles per centimetre cubed of air. On the road 100,000, by the roadside 10,000.” His studies found that up 90% of all particles by busy roads are nanoparticles below 100nm.
This is a problem for our health, explains Kumar, “because the smaller particles you have, you have a greater surface area. A greater surface area means more [potential] toxicity, as they are in touch with a greater surface area inside your body.”
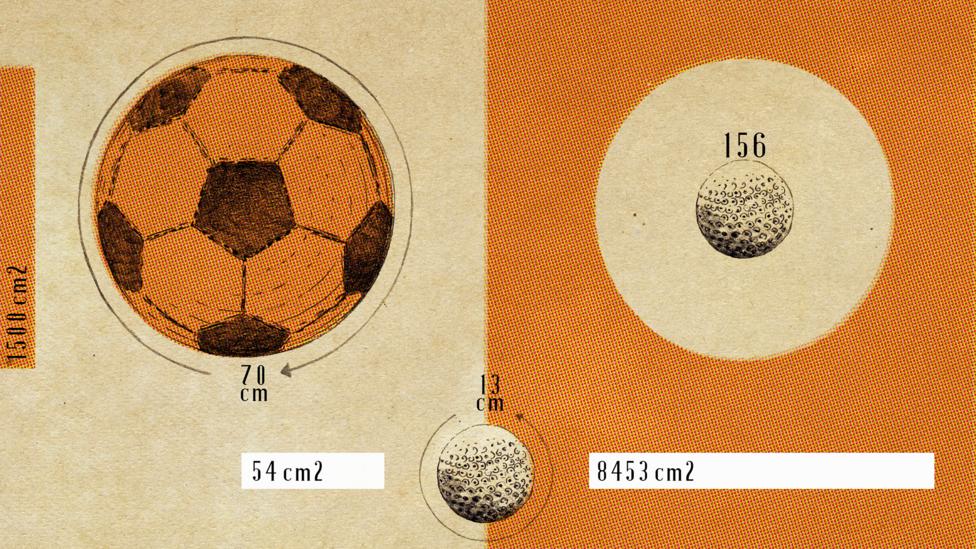
To visualise this, imagine footballs versus golf balls. A football (or soccer ball, for North American readers) has a circumference of 70cm (28in) and a surface area of around 1,500 cm2 (91.5in2). A golf ball is obviously much smaller, with a circumference of about 13cm (5.2in), making its surface area 54cm2 (3.3in2). By volume, you could fit 156 golf balls into the same space as a football, but the total surface area of all those golf balls would be 8,453cm2 – a substantial 6.9 square metres more than the football. On a nano-scale, that difference is amplified. A cloud of a billion 10nm particles has the same mass as just one PM10 particle, but a combined surface area a million times larger. And that surface area comes coated with toxic, unburnt fuel from vehicle exhausts.

People inside cars are thought to be subjected to more nanoparticles than those cycling or walking on the pavement (Credit: Emmanuel Lafont)
Another of Professor Kumar’s studies looked at the exposure of children being pushed in prams along the roadside of a small town. “We found that you get a high exposure when waiting at traffic lights, and children get a much higher exposure compared to adults… In some cases it was 20-30% higher exposure [at pram height compared to adult height]. Because their immune system is still developing, they are more vulnerable to the health impact.” The Californian Children’s Health Study, for example, finds that children growing up within half a kilometre of a busy road suffer a significant loss in lung capacity.
Nanoparticles can also pass through the walls of the lungs and into the bloodstream, in a way that larger PM2.5s cannot. Once in the bloodstream they cause the same inflammation damage they inflict on the lungs, except now they can reach any organ or artery in the body. Until recently it wasn’t known exactly what size of particle could make it through, and which remained stuck in the lungs or upper airways.
First, the Edinburgh team got mice to breathe in the gold nanoparticles; next, it was the human volunteers’ turn
That final piece of the jigsaw was put in place by a team led by Professor David Newby at the University of Edinburgh in 2017. Dr Jen Raftis, who was part of the research team, says: “There were various ideas about how we could show these nanoparticles [in the blood], various imaging techniques. But no imaging technique really has that kind of resolution. So we decided to use gold.”
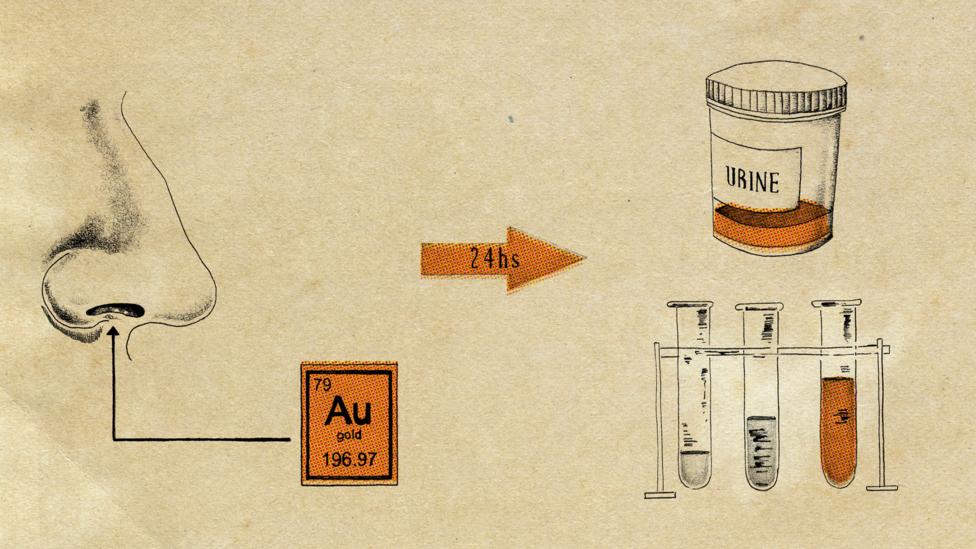
A machine borrowed from the Netherlands used electrodes to scatter gold into nanoparticles right down to 2nm in size. First, the Edinburgh team got mice to breathe in the gold nanoparticles; next, it was the human volunteers’ turn. “We used gold because we know it is really safe”, explains Raftis, reassuringly. “It is used clinically because it is inert, it doesn’t react to things or cause oxidative stress in the body.” It is also easy to detect, unlike carbon particles which are effectively camouflaged within our carbon-based bodies.
The volunteers gave blood and urine samples 15 minutes and 24 hours after they inhaled the particles. Lo and behold, there was gold in them there samples. The team discovered a 30nm cut-off point; anything below that could be found swimming around in the bloodstream, but anything above that failed to get past the lungs.
“Obviously with humans we couldn’t perform a biopsy, but with the mice we did”, says Raftis. “We found the biggest accumulations [of particles] in the lungs primarily, but the liver next, because your liver is where the blood passes through first… the pore size in the kidney is 5nm, so nothing bigger than that would pass through the kidney… There could be accumulations in other parts of the body as well, because pore sizes across the body differ.” Gold was still present in the urine of the volunteers three months later.

Gold particles were used to see if nanoparticles accumulated in other parts of the body (Credit: Emmanuel Lafont)
David Newby, funded by the British Heart Foundation, then took the study further. Again, it had been theorised – but not proven – that nanoparticle build-up in the arteries could lead to strokes and heart disease. He approached hospital patients who were due to undergo surgery to remove a fat deposit (known as a ‘plaque’) from an artery. If they breathed in gold nanoparticles, would these be found on the plaque removed during surgery a day later?
“Yes, we found gold in the plaque,” says Raftis, still excited by the finding. “It was indicative that air pollution particles of this size and structure can be delivered to a plaque within 24 hours of inhaling them. That’s quite a big risk for patients with heart disease… as air pollution is a whole of life exposure. We just did a one-off experiment, but this is happening every single day.”
Think of a plaque as the scene of a car crash, and the artery as a road; nanoparticles are more cars piling up behind it, causing a bigger blockage. The nanoparticles can also be the cause of the crash, inflaming the artery with toxic chemicals stuck to their surface (Newby’s predecessor Professor Ken Donaldson had highlighted the toxicity of nanoparticles back in the 1990s). The Global Burden of Diseases study estimates that air pollution could account for 21% of all deaths due tostroke and 24% of deaths from ischaemic heart disease. Traffic fumes had long been considered the smoking gun, but the bullet had proved elusive. Now, many think that the bullet is nanoparticles.
A low PM2.5 reading on government website or mobile phone app can therefore give a false impression of clean air when it is, in fact, swirling with particles entering our arteries
Most countries including the US and the EU have legal limits for the most harmful air pollutants, including PM2.5, NOx, carbon monoxide and sulphur dioxide. But no similar regulatory limits exist for nanoparticles. The typical rebuttal is that “PM2.5 includes everything down to 1nm”, which technically it does, but as we have seen, literally millions of nanoparticles still give a low PM2.5 reading. A low PM2.5 reading on government website or mobile phone app can therefore give a false impression of clean air when it is, in fact, swirling with particles entering our arteries.
A 2018 report on ultrafine particles below 100nm for the UK Department for Environment, Food and Rural Affairs (Defra), found that because “there are currently no emissions ceilings or emission reduction targets set on [nanoparticles]… there are no guidelines or common sources of emission factors of [nanoparticles] to enable inventories to be developed.” The one regulation that does exist, the Euro 6 vehicle emissions test, includes a particle number limit, and measures down to 23nm. But that means, says the Defra report, “more than 30% of [nanoparticles] in urban environments may not be included”, and covers only a fraction of those below the 30nm threshold identify by the Edinburgh gold study.

The smaller particles actually have a greater collective surface area because there are more of them – and they have a more toxic effect (Credit: Emmanuel Lafont)
Perhaps the only good news is that while particle number doesn’t correlate well with particle mass (PM2.5) measurements, it does tend to correlate with NOx readings. Like nanoparticles, NO2 is highest closest to its source, and then quickly dissipates. NO2 even reacts with other gases in the air to form some of the nanoparticles. So tackling NO2 can often work as a proxy to reduce nanoparticles. “They do correlate well,” says Kumar, “because they are coming from the same source.”
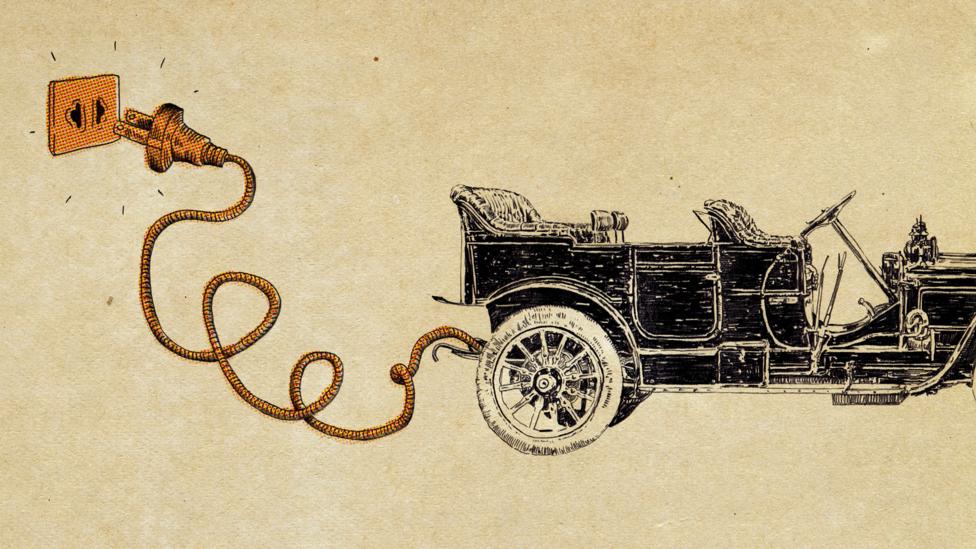
The solution for NOx and nanoparticles are also the same: replacing combustion with electrification. Electric cars still kick up road dust, but they emit no combustion-derived nanoparticles or NOx; and while power stations are needed to take the electricity, we spend far more time standing by roads than we do standing by power station chimneys (although this is all the more reason to rapidly move to 100% renewable energy). True zero-emissions transport, such as walking and cycling, are even better. The quicker we can make this transition, the more lives will be saved. In the interim, we also need to reduce our exposure by physically separating people from combustion-based traffic, via segregated cycle lanes, and green barriers – trees, hedges and climbing plants – inbetween pavements and roads.
I stopped burning candles in my house. I don’t use or have a log burner at home, even though I like them… I always have the extraction on when I cook food – Jen Raftis
Kaur still finds her own habits influenced by her nanoparticle research, over a decade later. “My friends find it hilarious that I’m hugging the building side when I walk along a pavement!” she laughs. “Wherever possible I cut through the park or I take the side roads.”
In Edinburgh, Raftis goes a step further. “I stopped burning candles in my house. I don’t use or have a log burner at home, even though I like them… I always have the extraction on when I cook food. I don’t go for runs along roads, I always run in a park. I don’t drive and don’t think I consciously could do unless it was an electric car.” She cycles, despite the proximity to high particle counts, because “even if you cycle in heavy traffic you are offsetting the exposure to air pollution with exercise.”
I ask her if emissions regulation and policy should shift more towards nanoparticle exposure. She is not a policy person, she tells me, but quickly adds: “I just don’t know why they haven’t. I mean, you feel like you are researching and researching and producing data and nothing gets done about it, only lip service. I feel it has to move along with the technology. PM2.5 is [just] what the monitors measure.”

Within the same town or city, our daily exposure to air pollution can differ greatly by person, by mode of transport, by the routes we take (Credit: Emmanuel Lafont)
Within the same town or city, our daily exposure to air pollution can differ greatly by person, by mode of transport, by the routes we take. Most cities or countries measure this with a handful of stationary monitoring stations, which can only test the air immediately next to them. We don’t, however, spend our lives standing still.
“I still find it fascinating”, says Kaur, speaking to me from her Thames-side offices, overlooking the London Mayor’s office. “If you are introducing air pollution policy for the wellbeing of humans, and you base that guidance on data that isn’t relevant, are you really helping people or are you actually hindering?”
—
Tim Smedley is the author of Clearing The Air, published by Bloomsbury.