We wrote an article called Anatomy of An Air Quality Monitoring Network. This article explains why building that system is so important to the future of Sea-Tac Airport Communities. It also describes a far more generalized problem in obtaining environmental mitigation.
History
In the world of engineering there is an expression: “No data, no problem.” If you are not required to regulate something, you don’t bother testing for it. But if you don’t test for something, you can’t know whether or not you need to regulate it.
As far back as 1976, researchers understood the need to establish a matched network of air quality monitoring devices around Sea-Tac Airport. Even then they understood that long term, 360 degree monitoring of the entire air shed, would provide an invaluable source of data for both researchers and policy makers and for every airport community.
The map
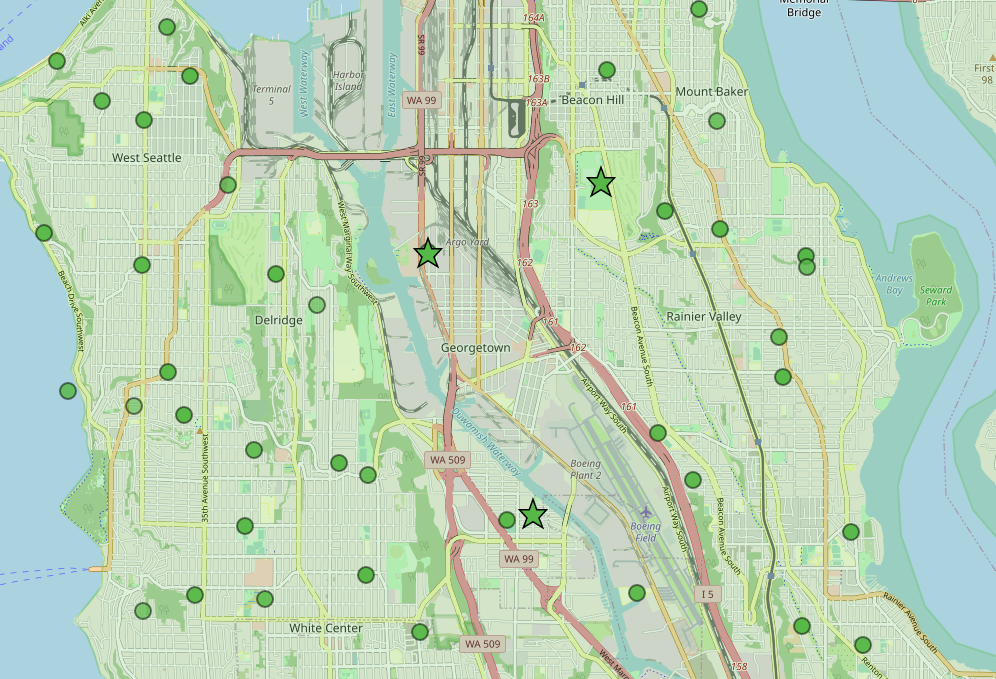
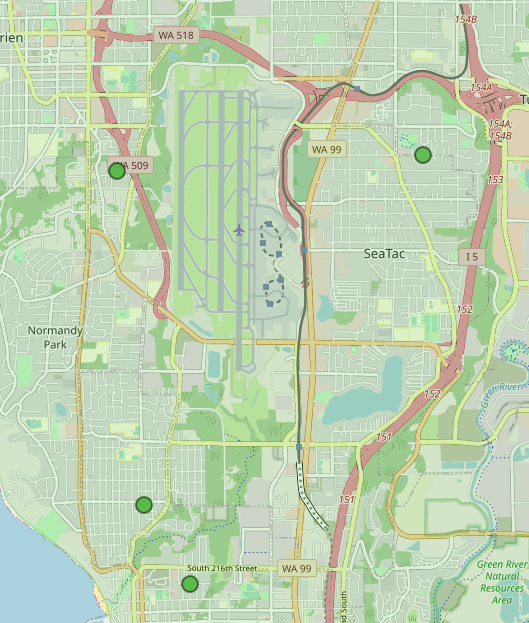
As the name implies, the Puget Sound Clean Air Agency is responsible for monitoring air quality around here. If you go to their web site, you’ll find an AQM network map like the one above. You’ll see lots of little dots and a few bigger green stars.
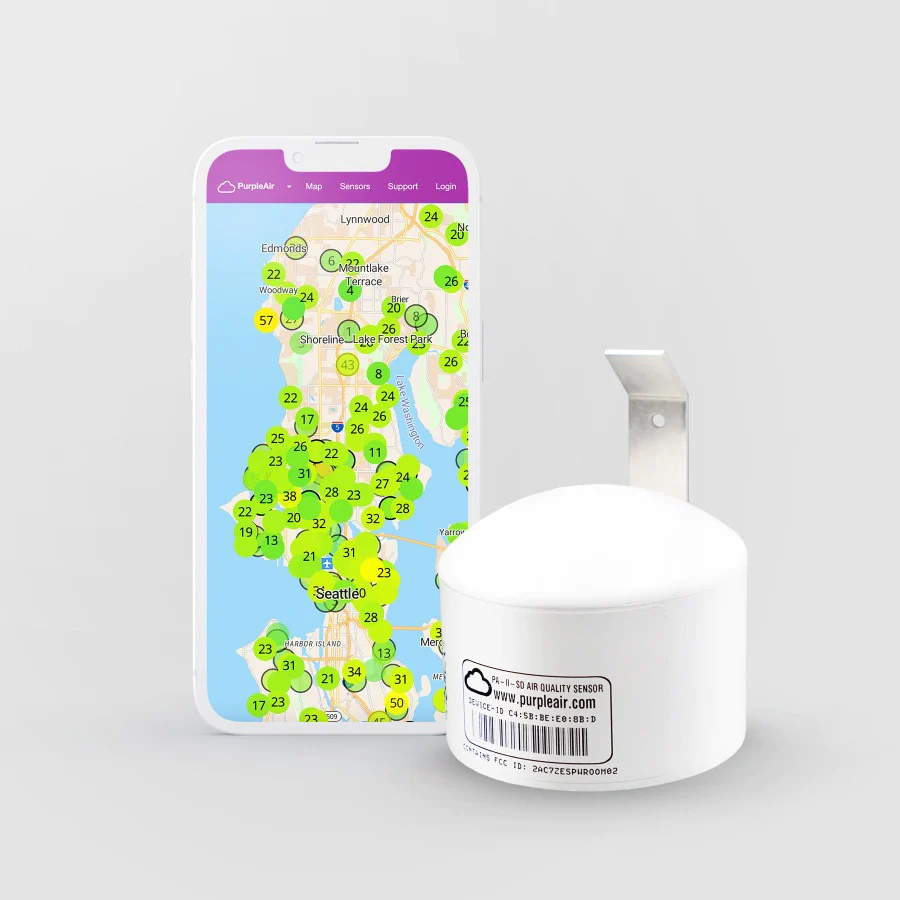
 All the little dots are PurpleAir sensors–owned by the public. They’re fine for informational purposes.
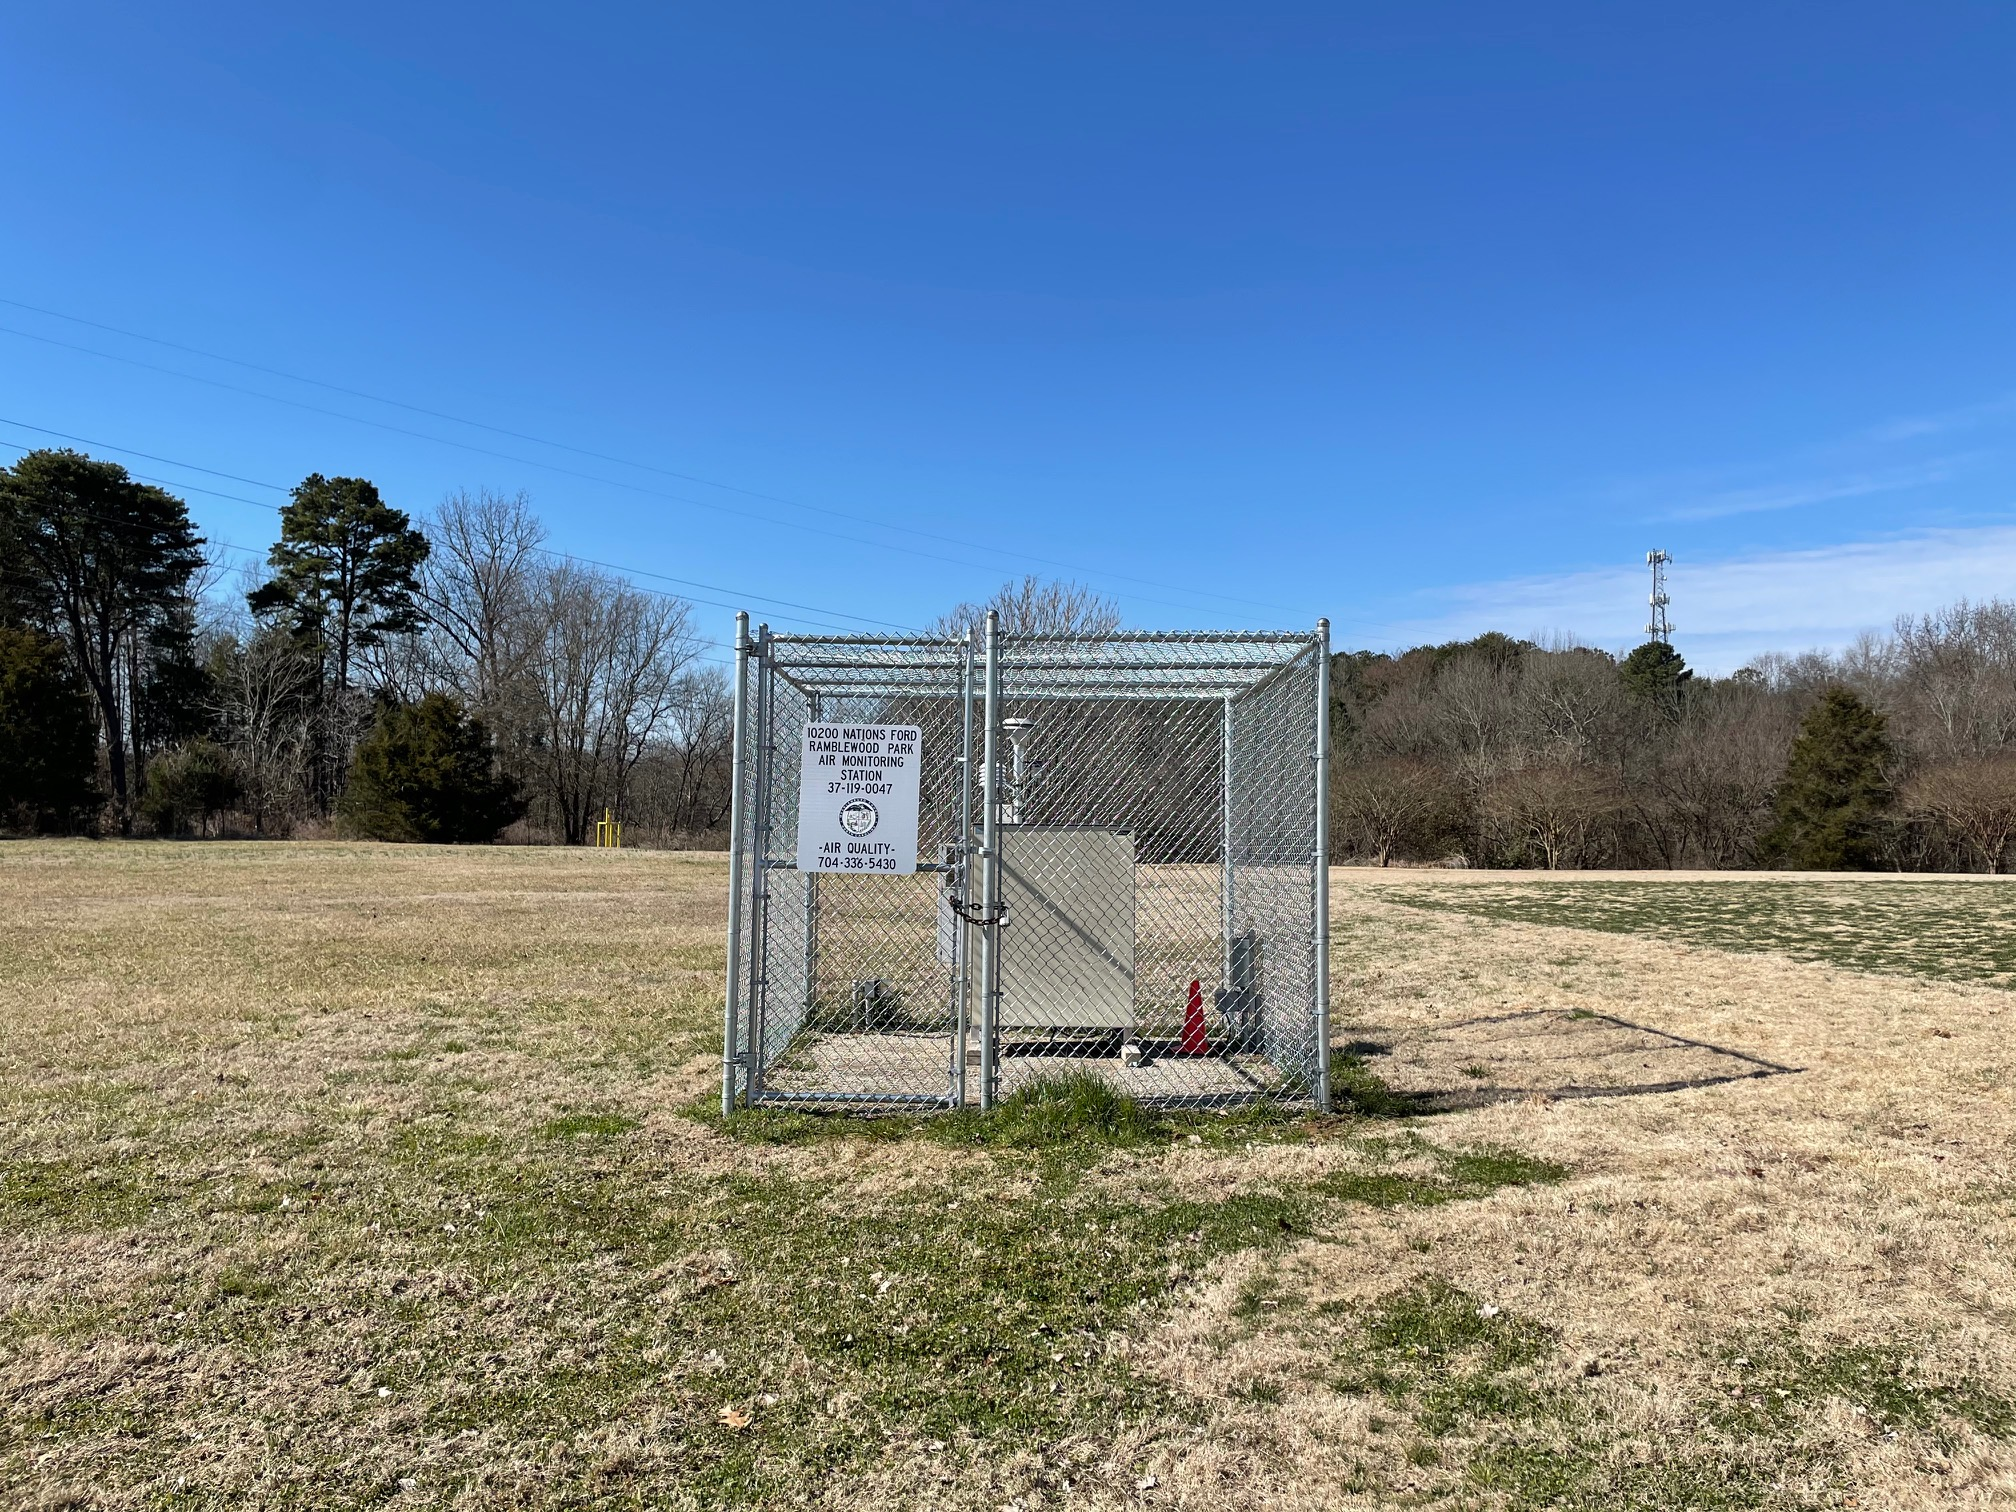
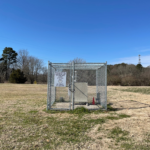 But the big stars? Those are PSCAA’s fixed site monitoring stations. They have a fence and a little hut with lots of sophisticated equipment inside. Those are the ones regulators pay attention to when making the law.
Now let’s scroll down to the PSCAA monitors near Sea-Tac Airport. Notice something missing? No big stars. There are literally no fixed-site PSCAA monitors anywhere near Sea-Tac Airport.
And whether they’re dots or stars, notice that all those sensors are green. Which means ‘Good’, right?
Green = Good!
According to every map published by any arm of the State and Federal government (including the new AirNow.Gov) the air over Sea-Tac Airport is almost always in the best possible range.

These are not Tricorders
 Fans of Star Trek remember the Tricorder. A wonderful device that can somehow instantly analyze everything in the surroundings.
Sadly, there is no such gizmo in the 21st Century. All those sensors (expensive fixed site or inexpensive PurpleAir) are designed to detect one1very specific thing. That one thing is a major component of emissions from cars and trucks and wildfires. But. Wait for it. Not aviation emissions. These devices cannot detect 2emissions specific to commercial aviation.
This bears repeating: until now, PSCAA has not measured aviation emissions because they have no authority to regulate aviation-related emissions. Their job was (and still is) to measure what they can do something about.
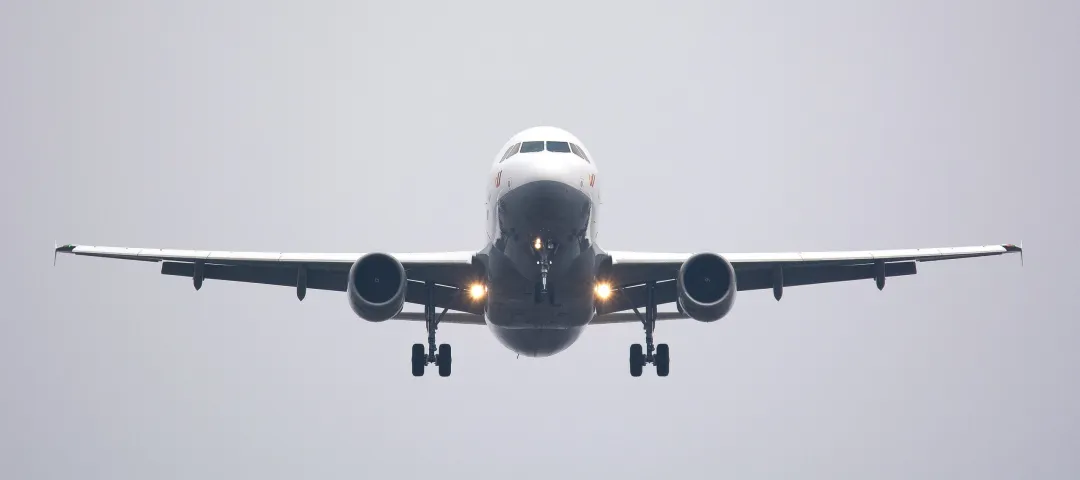 So even during the peak periods when aircraft are flying over our heads every 60 seconds, with all those tons of emissions, all those sensors will almost always show ‘green’. And that is because they are literally not measuring what is actually flying over our heads.
No data, no problem
You cannot regulate a problem if you do not have the evidence required by statute to show that it exists. And yet you cannot gather the evidence necessary to create the statute. Oy.
And that is why we need an AQM Network around Sea-Tac Airport, one that captures aviation emissions, across the entire air shed, over time. Just like we do for wildfires and roadway emissions. To get to a regulatory standard, somehow, we need to capture the data before those regulations actually exist.
If we had a proper Air Quality Monitoring Network, one that does capture aviation emissions, here is how a typical day might look around Sea-Tac Airport.
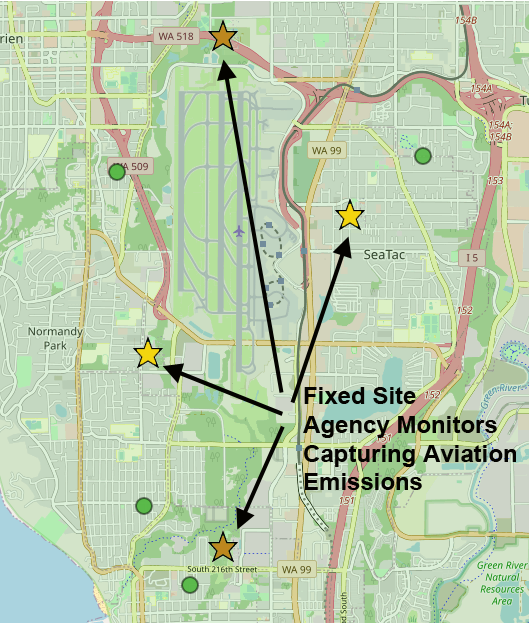
On this new map, the dots (the PurpleAir sensors) still show green because they don’t capture aviation emissions. But some of the 1big stars (the monitors run by PSCAA) would now more accurately show yellow and sometimes even orange to reflect the presence of all those ultrafine particulates. They would track emissions on each side of the airport so researchers could see how operations across the entire air space contribute to the overall load we all breathe in.
One picture. One thousand words.
The same challenges occurred back in the 1970’s with roadway emissions. Because there were no sensors to properly measure various pollutants, it took decades longer than it should have to develop the necessary data to regulate roadway emissions. And because there were no easy to understand graphics like this, it took even longer for decision makers to act.
But the most important thing to understand is this: After legislators were (finally) able to see rigorous,incontrovertible proof concerning tailpipe emissions regulations began emerging quickly. Once the necessary level of data was there, it became impossible to ignore.
Human beings grasp complex information far better with pictures than words. So this isn’t just for researchers. The public, and electeds all need be able to see this in action to get to regulatory authority and cleaner air for everyone.
We’ve been waiting forty five years for this.
1Not the actual sites. The precise location of each station would be determined by researchers.
2Something called PM25, which refers to the size of the particles (2.5 microns), not their components. What almost all these gizmos actually do is to count the number of particles of one particular size. PM25 refers to pollutants of the size most common in tailpipe emissions. If you count a large number of PM25s you assume they are coming from a tailpipe. Aviation emissions are much smaller and thus are not undetectable by any of the machines on the current PSCAA map. And again, these sensors do not tell you the chemistry of those particles. In short, these sensors are as far from a tricorder as you can imagine.