TagMap(375)
-
 2018-01-01
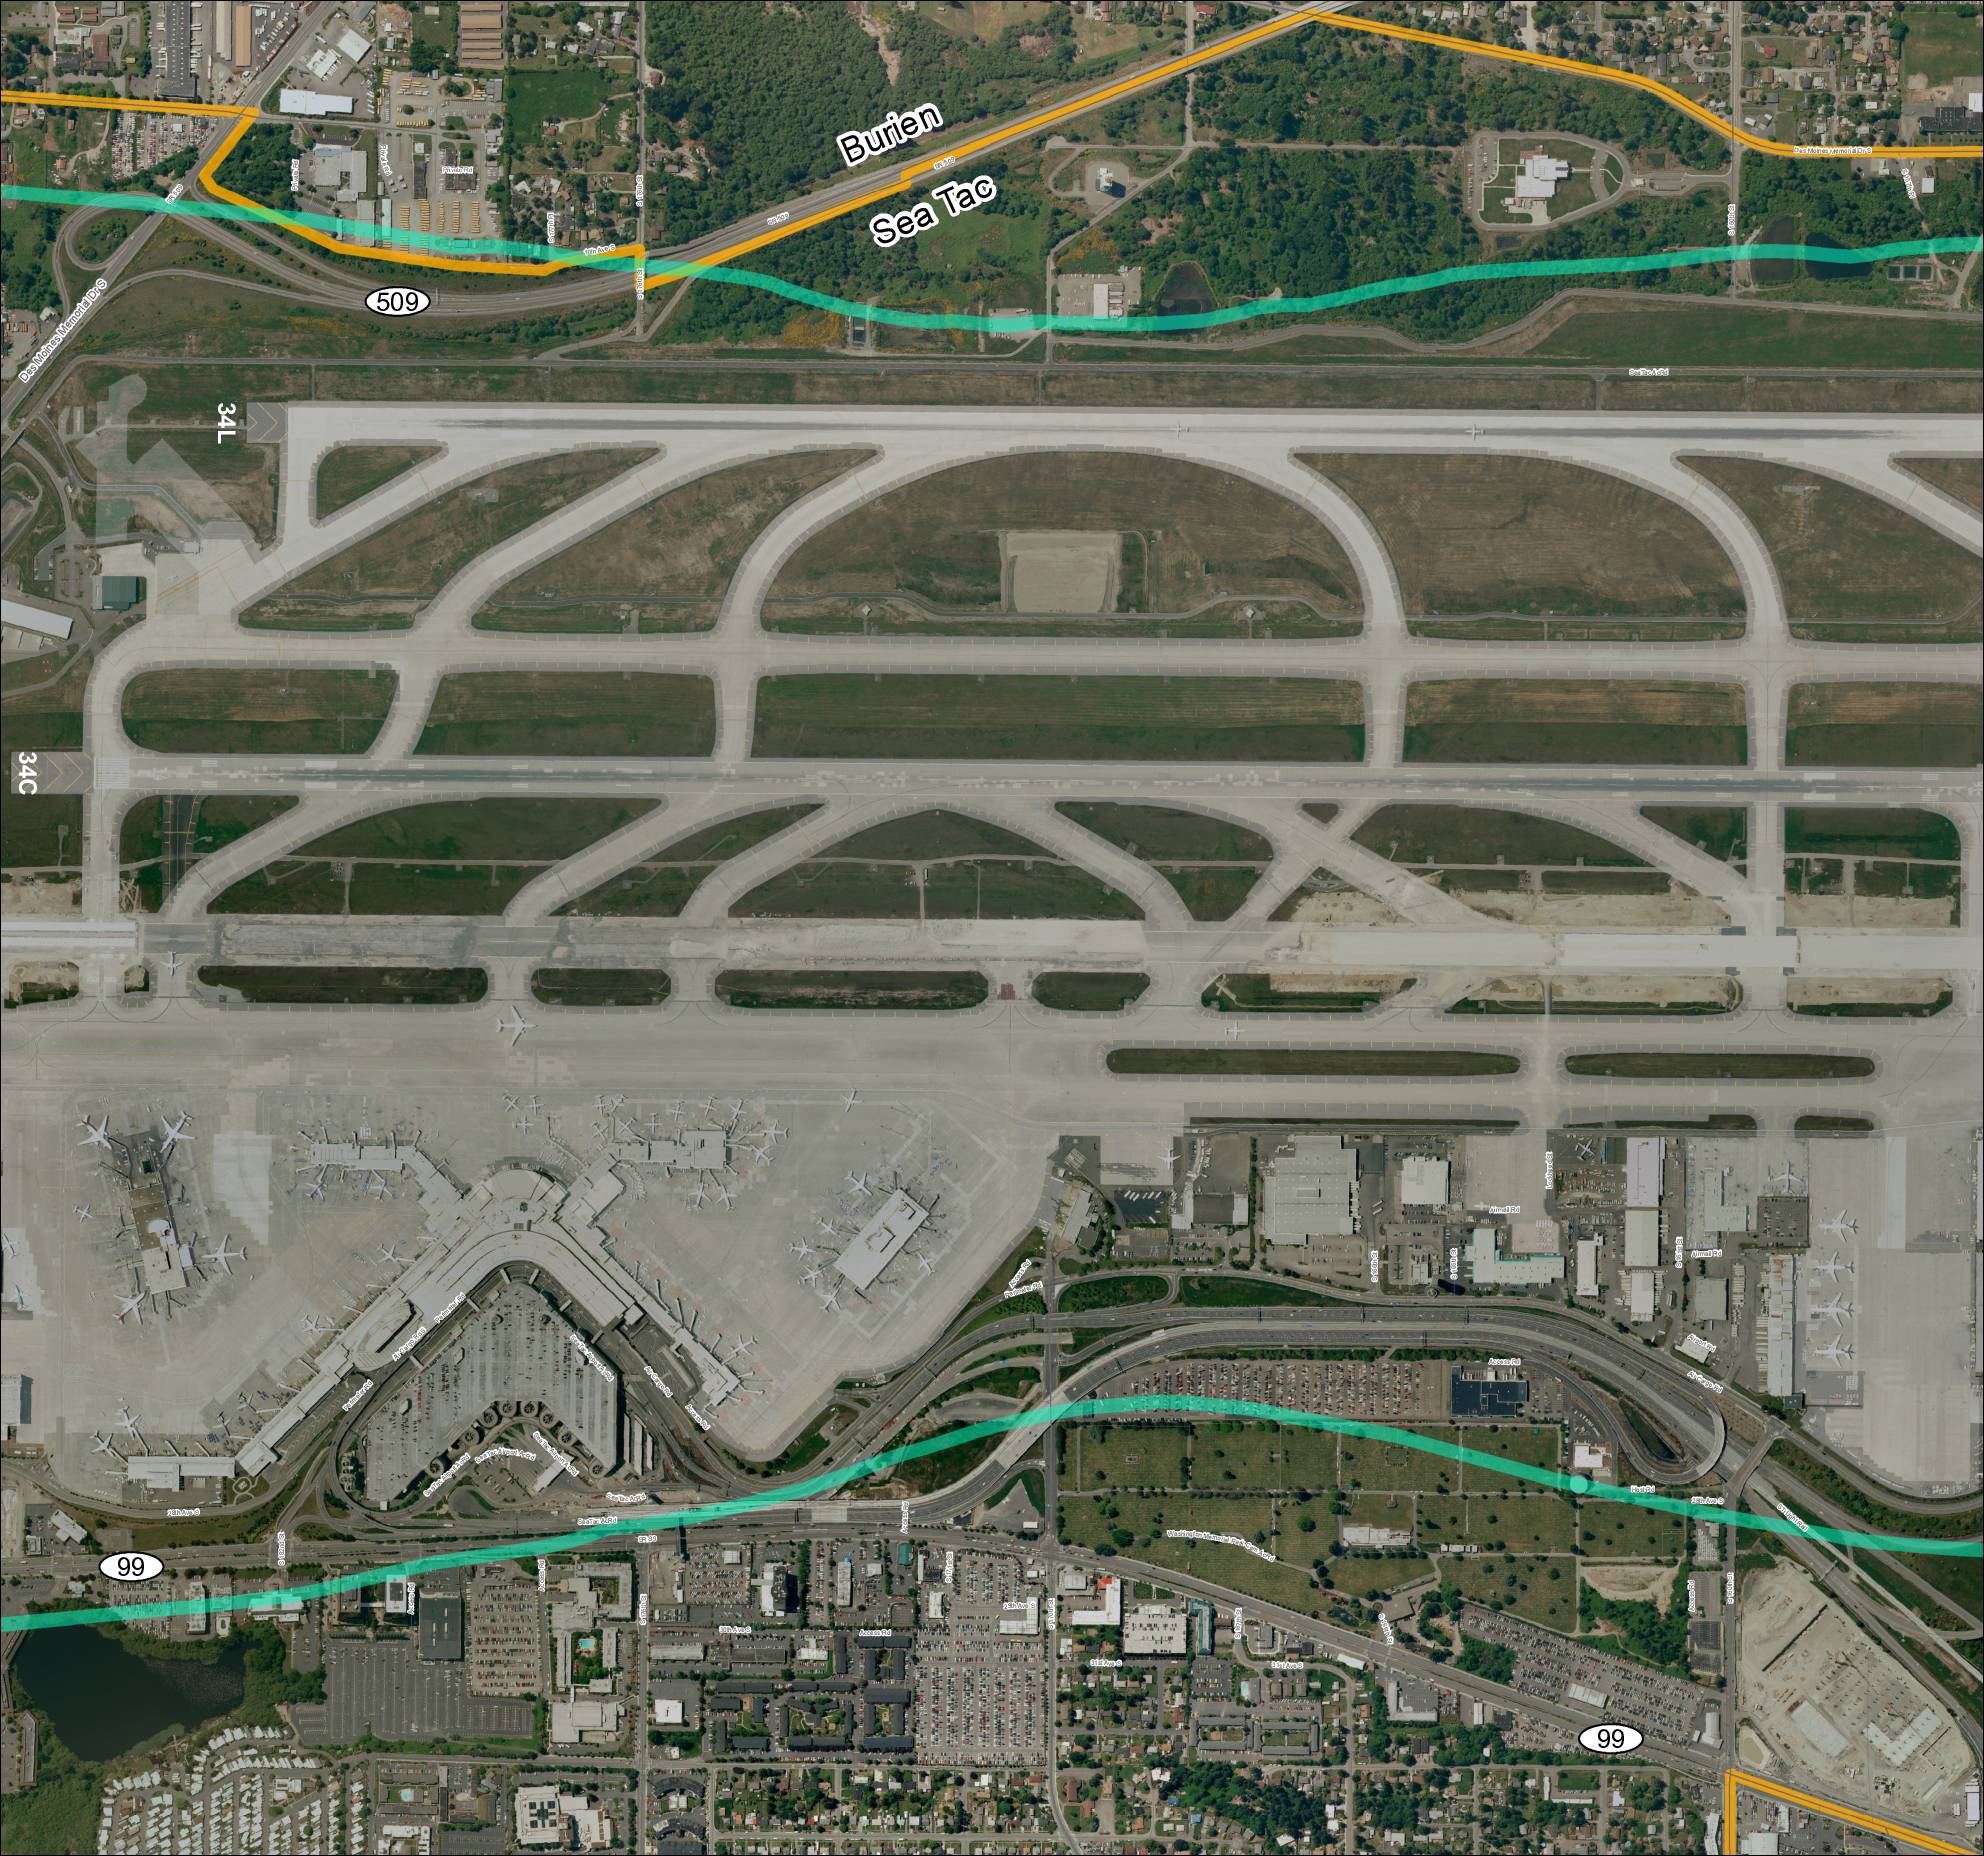
Grid 3: Sea-Tac Airport Aerial Map
This aerial map depicts Seattle-Tacoma International Airport (Sea-Tac) and its surrounding communities of Burien and SeaTac, showing the airport's runway layout including runways 34L and 34C, along with the local road network and key routes such as SR 99 and SR 509. The map highlights the ST Light Rail corridor and major access roads serving the airport, providing geographic context for understanding flight paths and noise exposure areas in the region. It serves as a reference for analyzing the relationship between airport operations and the residential and commercial areas situated beneath approach and departure corridors. -
 2018-01-01
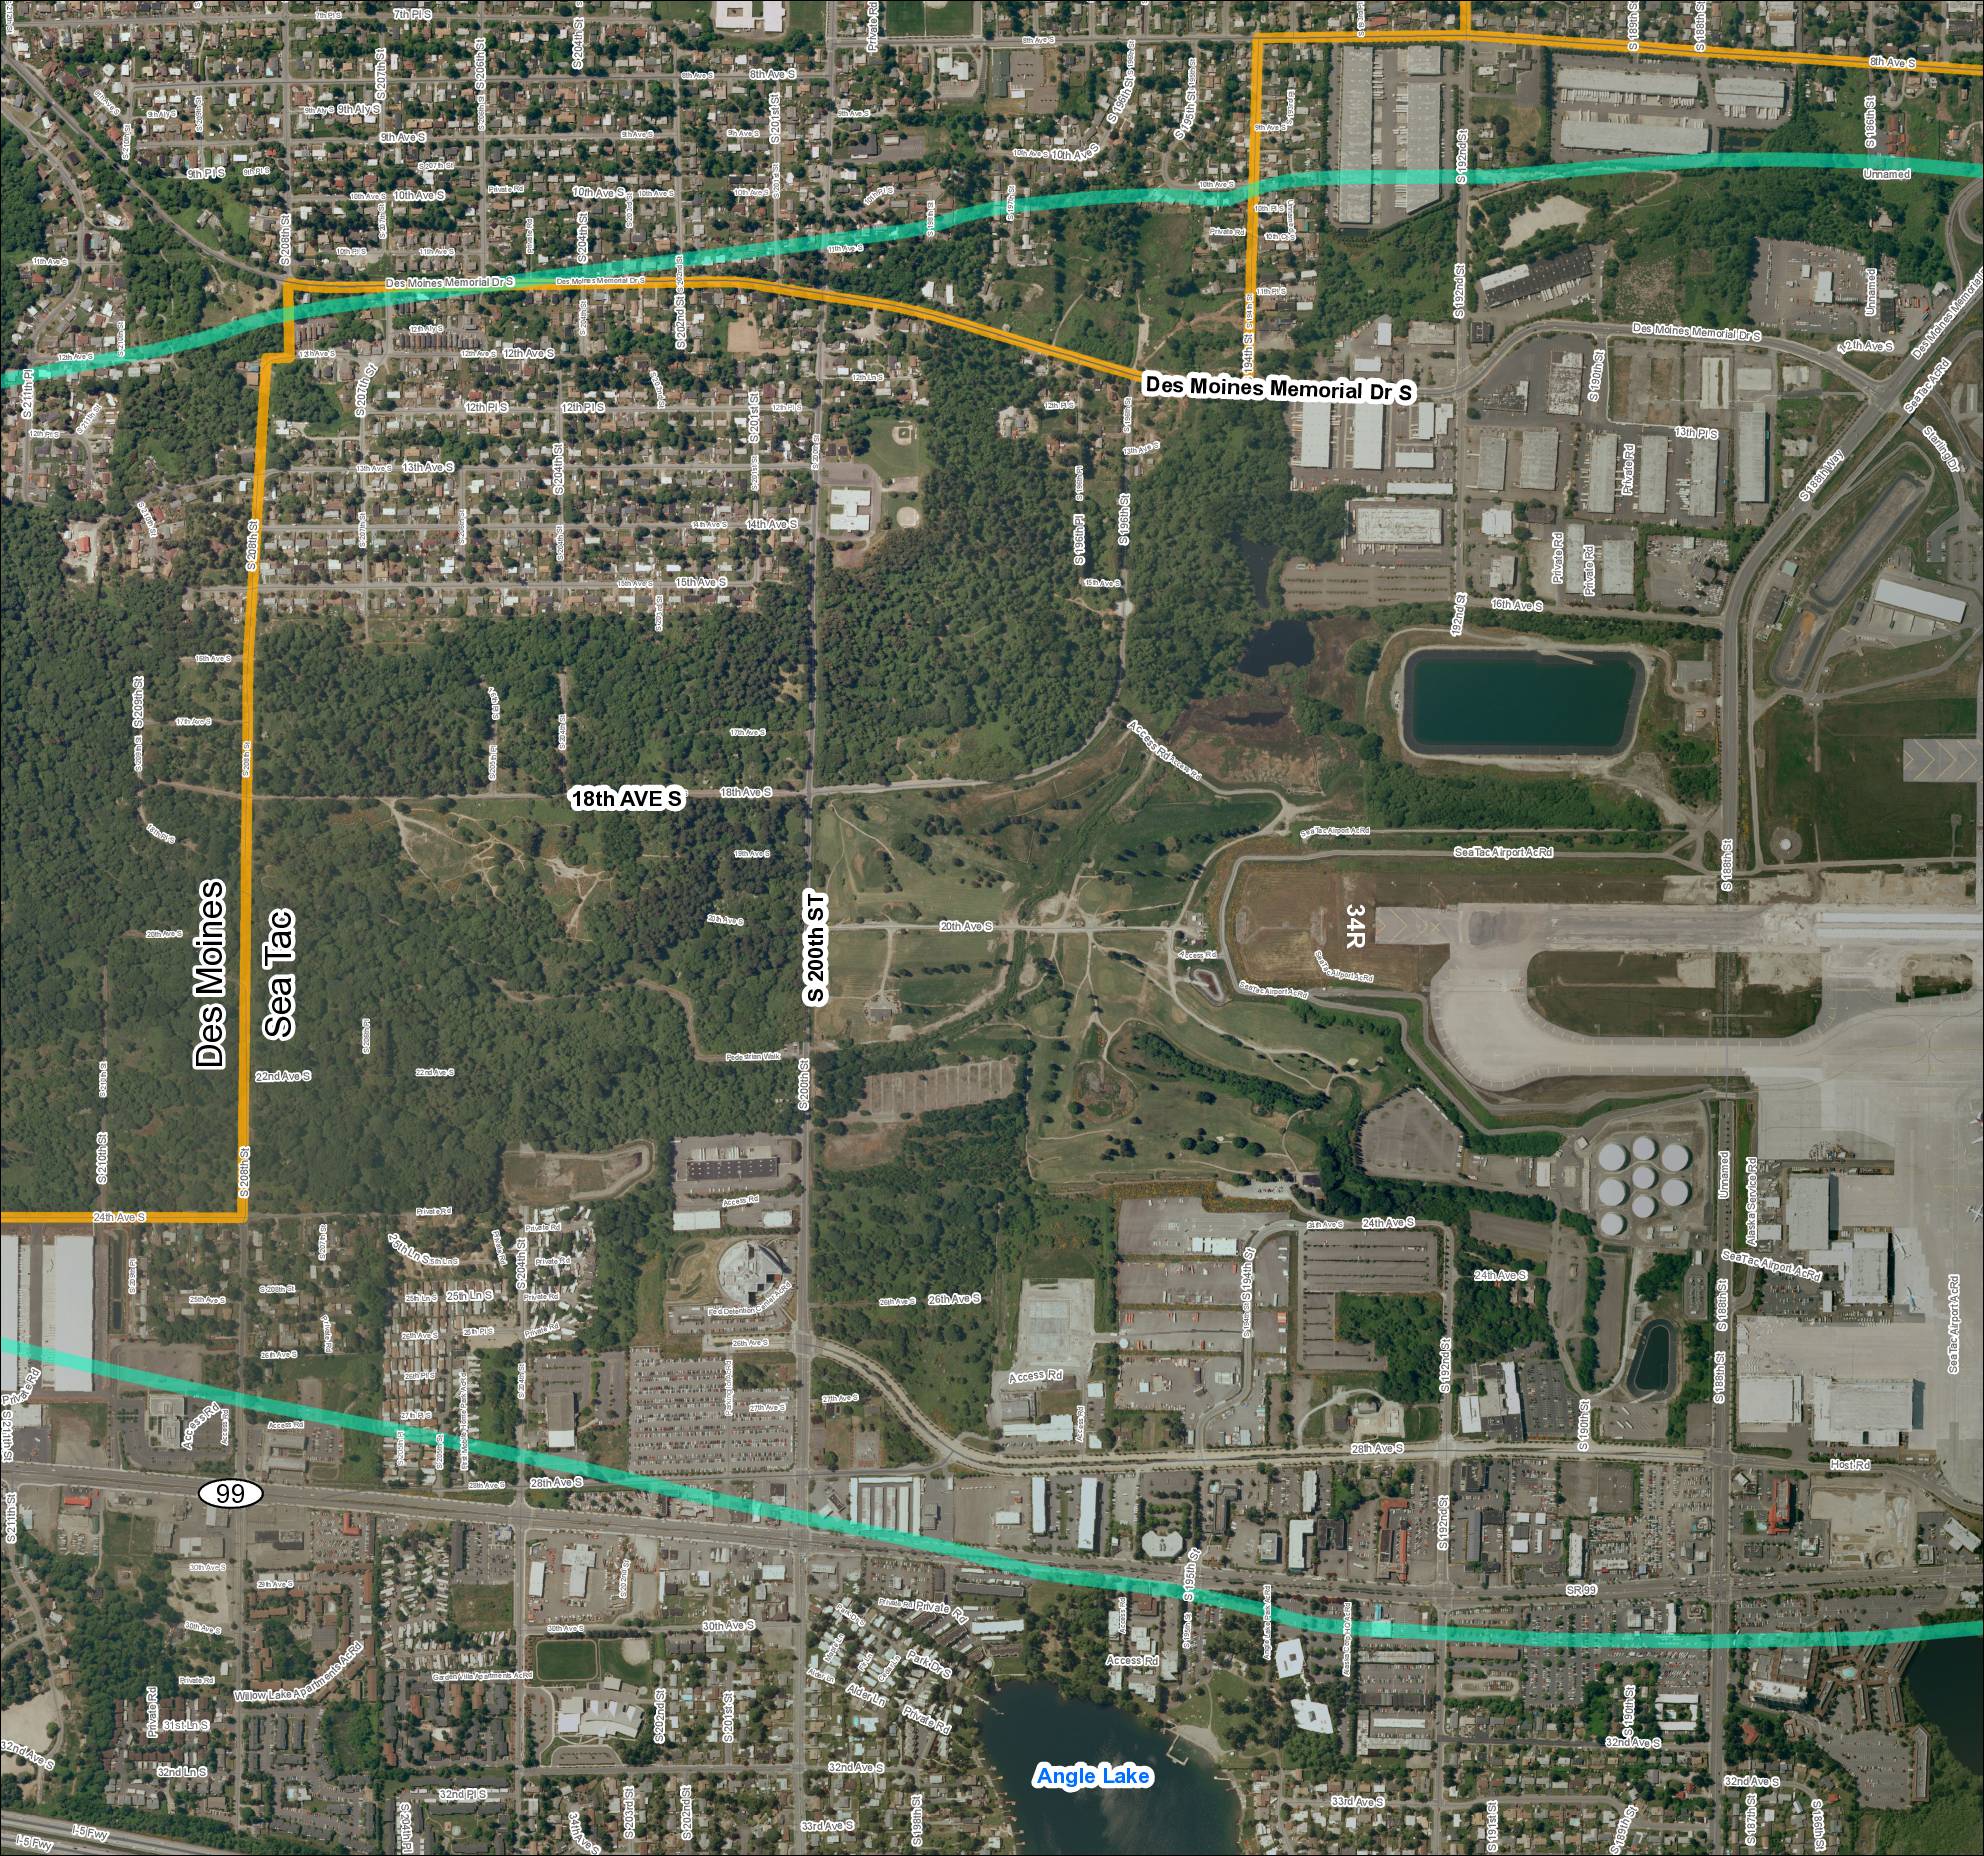
Grid 2 (2018): Aerial Map of Des Moines / Sea-Tac Area
This document is an aerial map showing the area surrounding Seattle-Tacoma (Sea-Tac) Airport, covering the cities of Des Moines and SeaTac in Washington State. It highlights key roads and boundaries, including Des Moines Memorial Drive S, S 200th Street, 18th Avenue S, and SR 99, with colored overlays likely indicating noise-impact or study zones near the airport. Runway 34R and Angle Lake are visible landmarks, with the map appearing to delineate jurisdictional or noise-contour boundaries relevant to airport planning and policy. -
 2018-01-01
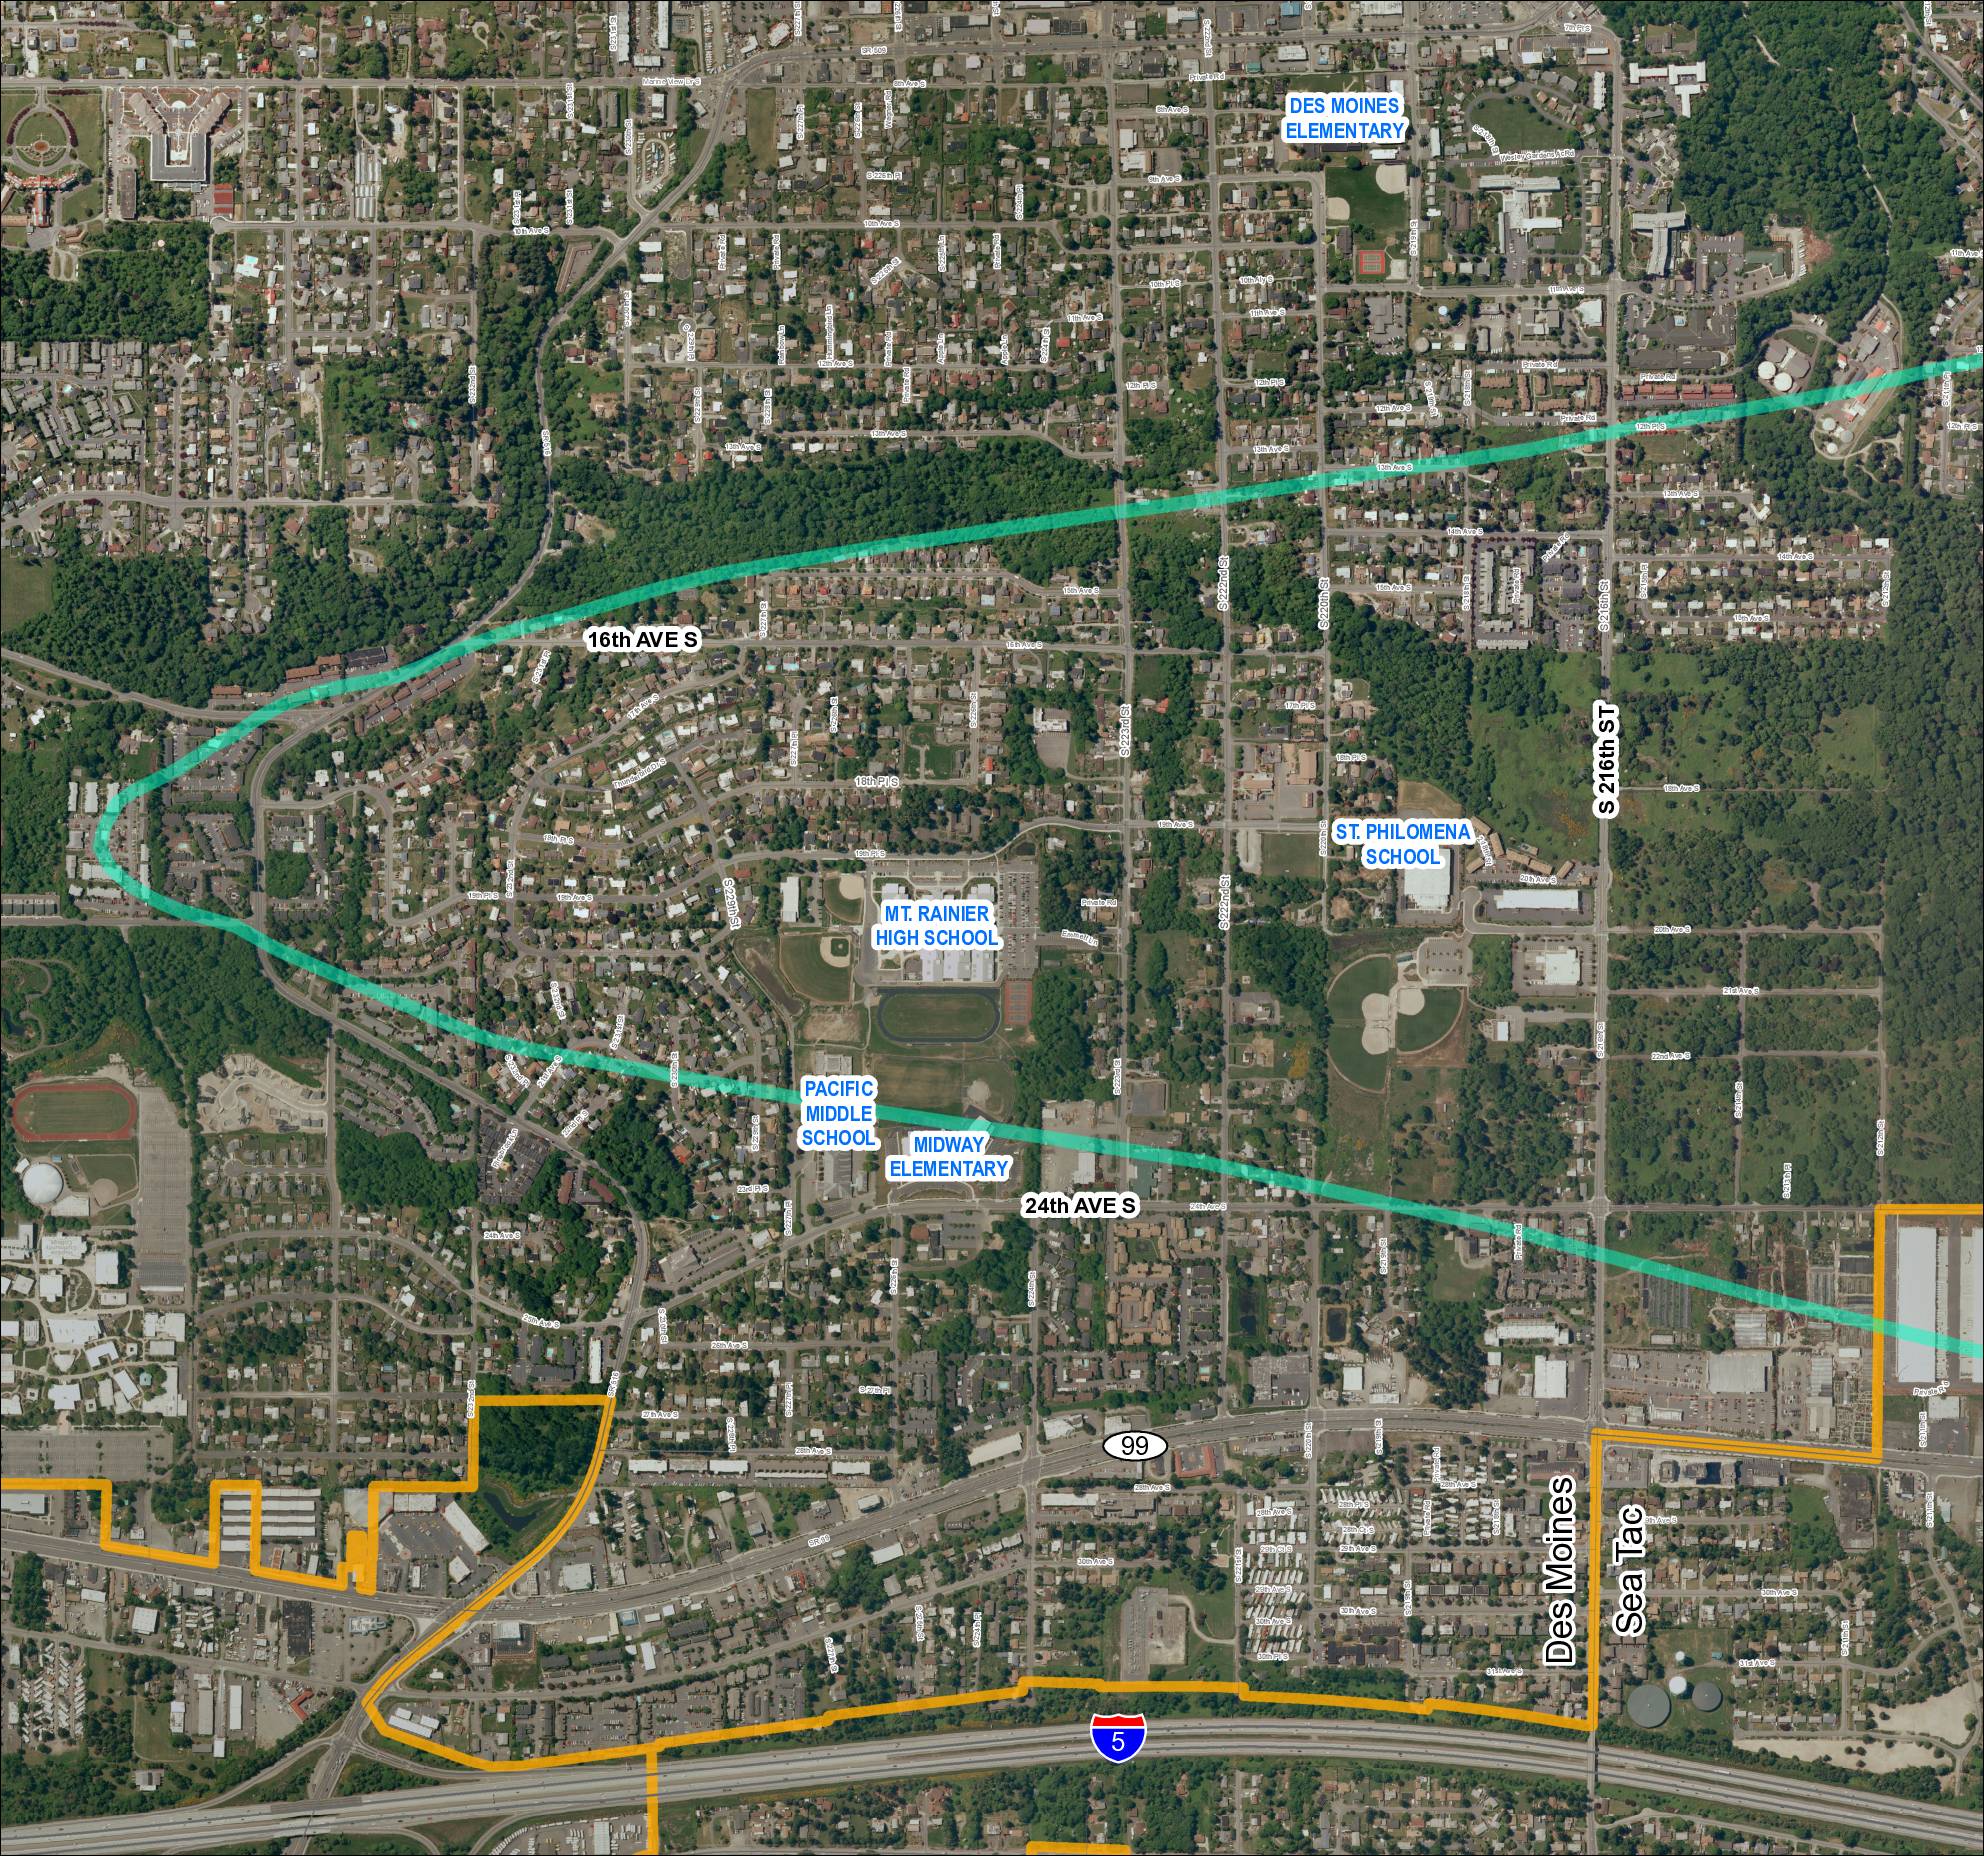
Grid 1: Des Moines and Sea-Tac Area Schools and Flight Corridor Map (2018)
This map shows the Des Moines and SeaTac area of Washington State, highlighting a noise impact corridor (shown in teal) that sweeps across the region near Sea-Tac Airport. The corridor passes over several schools including Mt. Rainier High School, Pacific Middle School, Midway Elementary, St. Philomena School, and Des Moines Elementary, indicating these institutions fall within the airport's noise-affected zone. A separate boundary (shown in orange) outlines what appears to be an airport-related land use or acquisition area in the southern portion of the map near Interstate 5. -
 2017-11-13
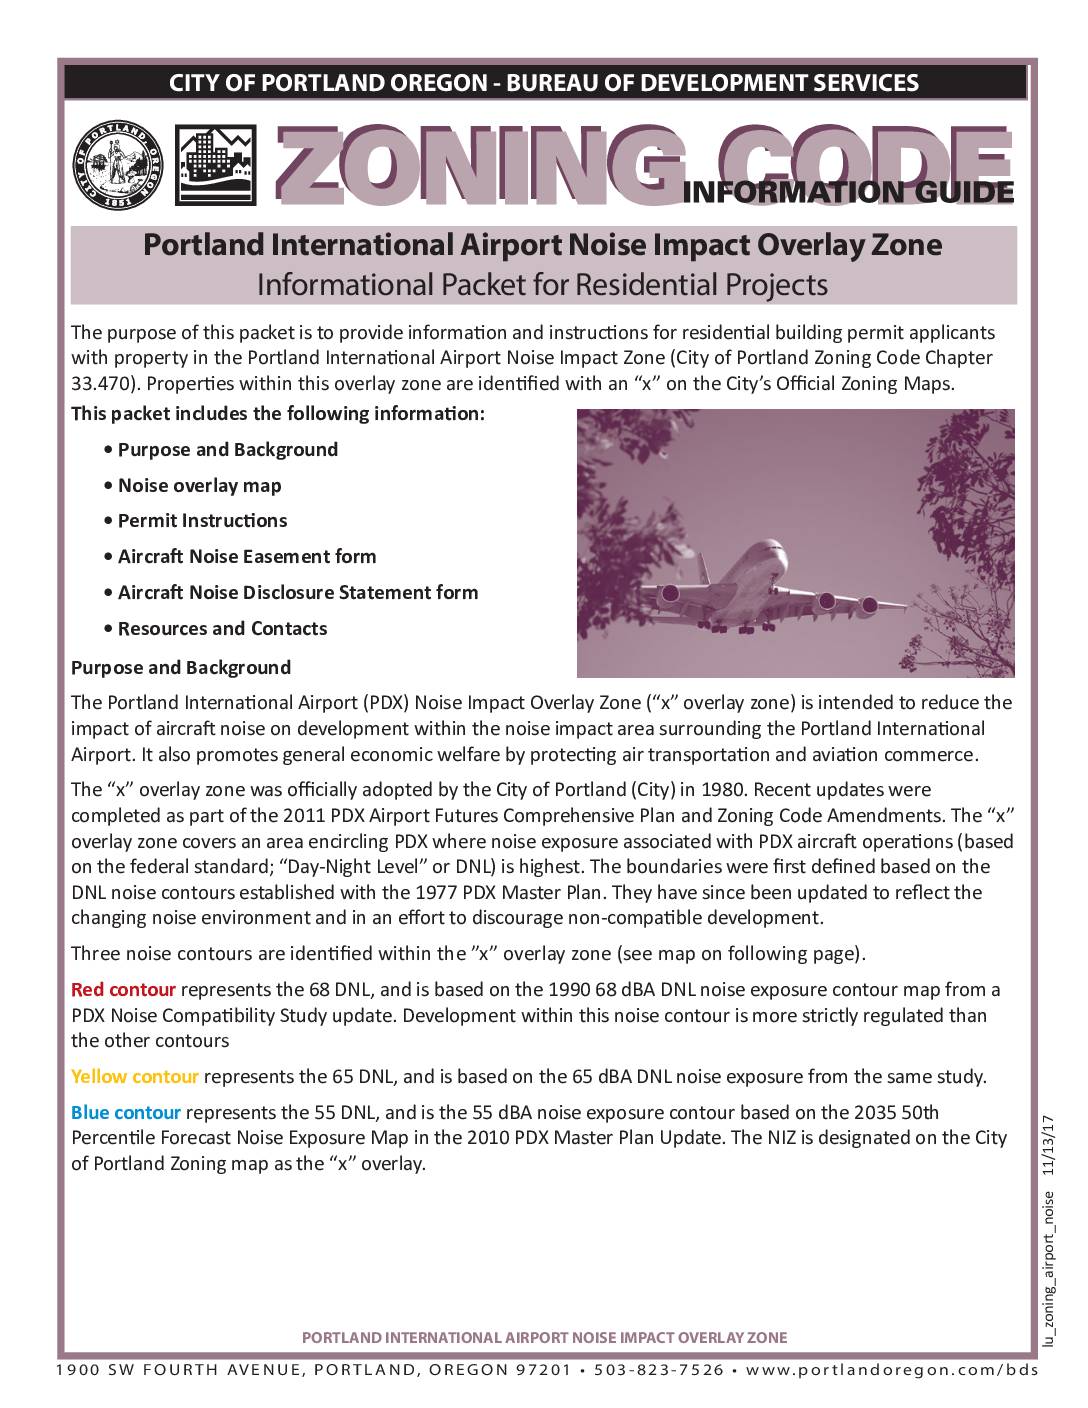
Portland International Airport Noise Impact Overlay Zone: Informational Packet for Residential Projects
This document from the City of Portland Bureau of Development Services explains the rules for building or significantly renovating homes near Portland International Airport (PDX) within designated noise impact zones. Properties in the zone are divided into three noise contours (68, 65, and 55 DNL), each with different requirements ranging from full prohibition of new residential development to mandatory noise easements, acoustical engineer certifications, and noise disclosure statements. Homeowners and developers may be eligible for reimbursement from the Port of Portland for certain compliance costs if they use an approved acoustical engineer. -
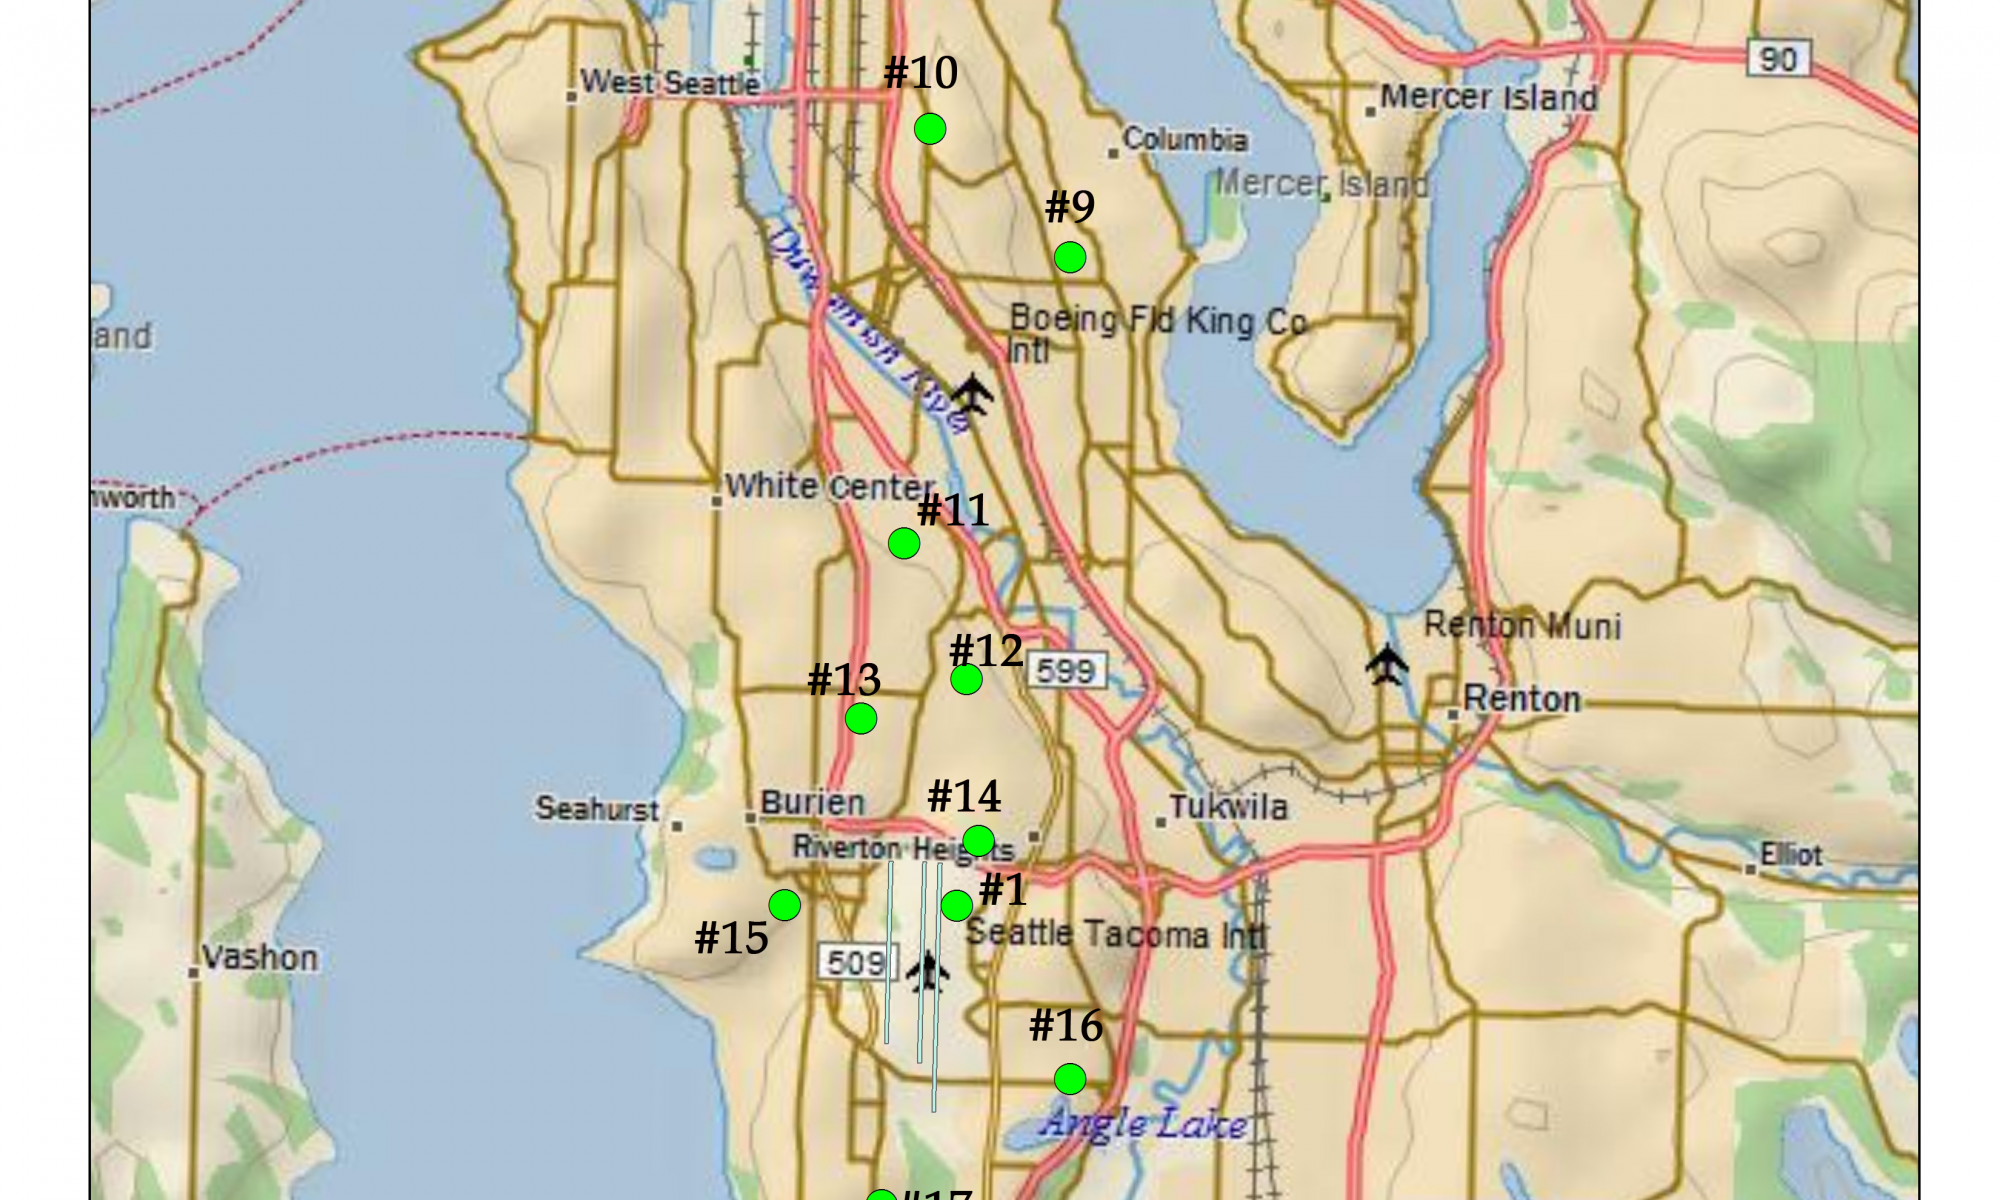
NMT_locations
A map showing numbered noise monitoring stations (#1, #9–#17) around Seattle-Tacoma International Airport (Sea-Tac) and the surrounding communities including Burien, White Center, Tukwila, Renton, and West Seattle. The stations are marked with green dots and correspond to a noise measurement network in the vicinity of Sea-Tac, Boeing Field/King County International Airport, and Renton Municipal Airport. -
 2017-04-01
John F. Kennedy International Airport final noise exposure map report
A Title 14 CFR Part 150 Final Noise Exposure Map Report for JFK International Airport prepared by Environmental Science Associates and other consulting firms for the Port Authority of New York & New Jersey. The report addresses federal aviation noise regulations and mapping requirements. -
 2016-11-01
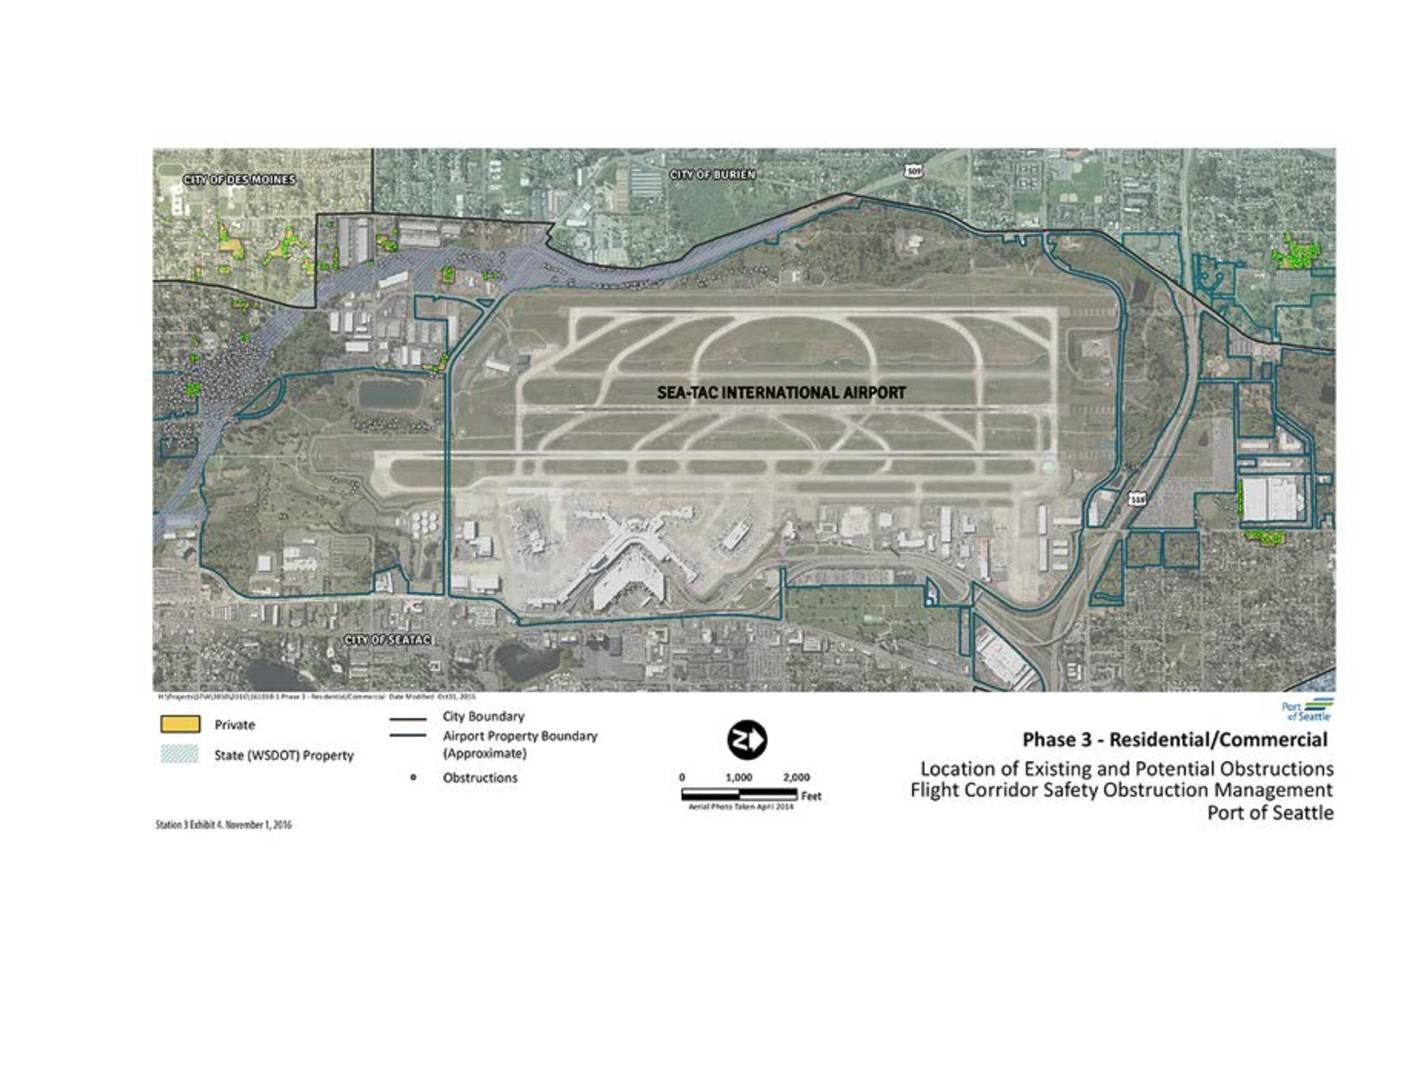
Phase 3 – Residential/Commercial: Location of existing and potential obstructions flight corridor safety obstruction management Port Of Seattle
This map, prepared by the Port of Seattle in November 2016, shows the location of existing and potential flight-path obstructions around Seattle-Tacoma International Airport as part of Phase 3 of the Flight Corridor Safety Obstruction Management program. It identifies private and Washington State DOT (WSDOT) properties, city boundaries for Des Moines, Burien, and SeaTac, and the approximate airport property boundary. The document is intended to support planning efforts that ensure structures in surrounding residential and commercial areas do not pose safety hazards to aircraft flight corridors. -
 2016-11-01
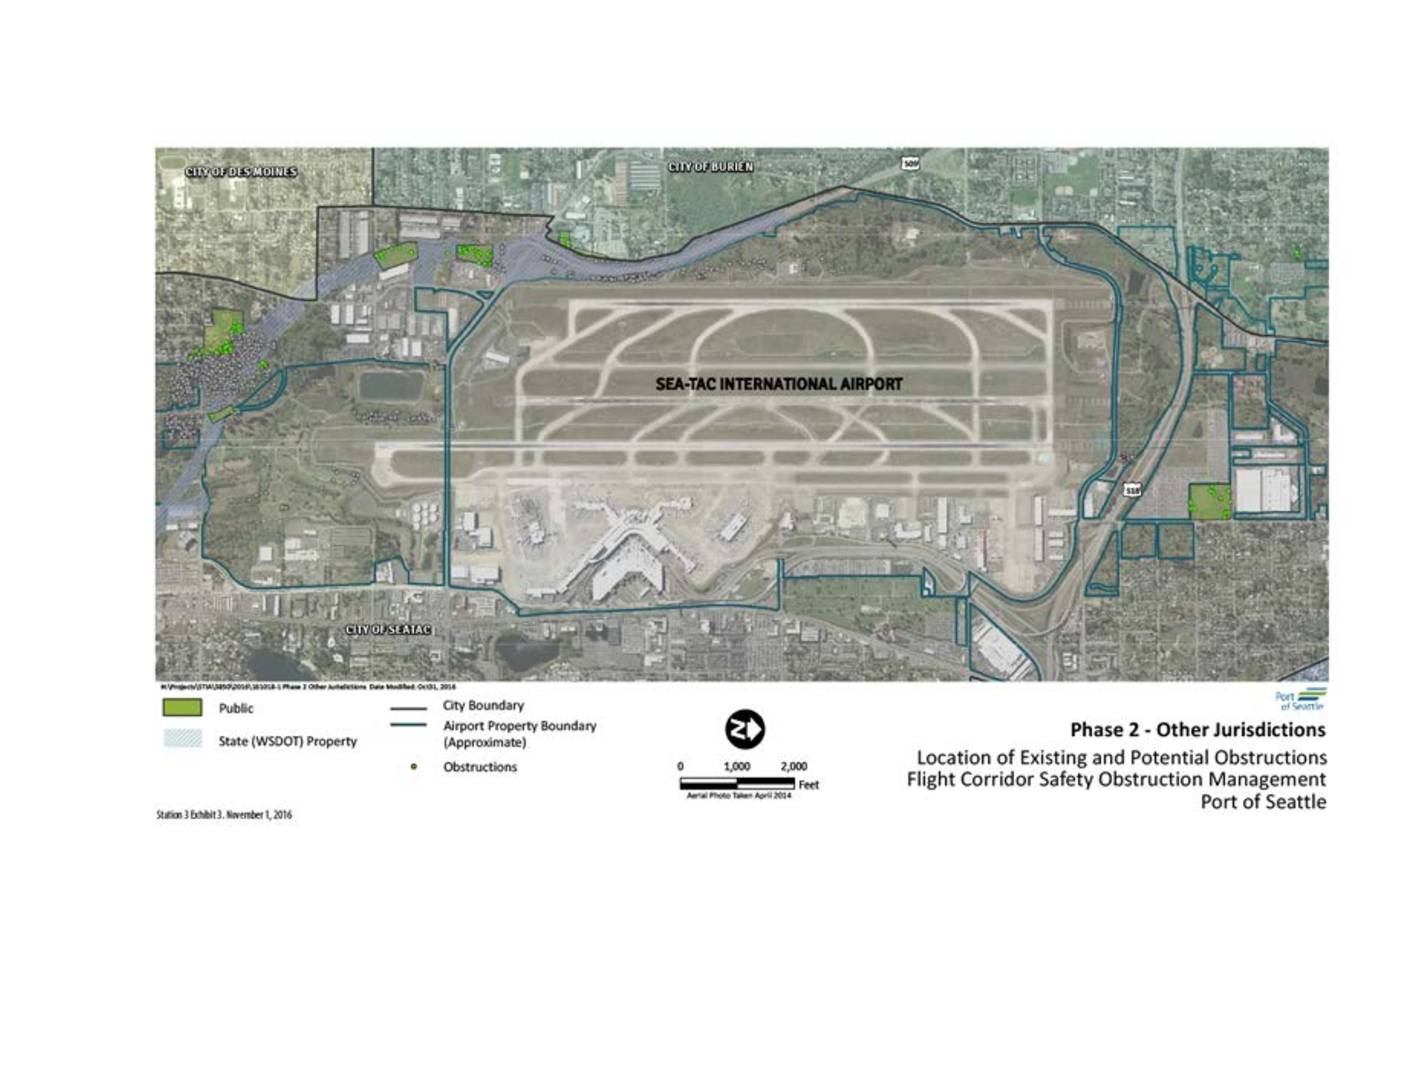
Phase 2 – Other jurisdictions: Location of existing and potential obstructions, Flight Corridor Safety Obstruction Management, Port Of Seattle
This map, prepared by the Port of Seattle, shows the location of existing and potential flight path obstructions around Seattle-Tacoma International Airport as part of a Flight Corridor Safety Obstruction Management study. It identifies public and state (WSDOT) properties, city boundaries for surrounding jurisdictions including Burien, Des Moines, and SeaTac, and the approximate airport property boundary. The document is part of Phase 2 of the study focusing on other jurisdictions outside the airport's direct control. -
 2016-01-01
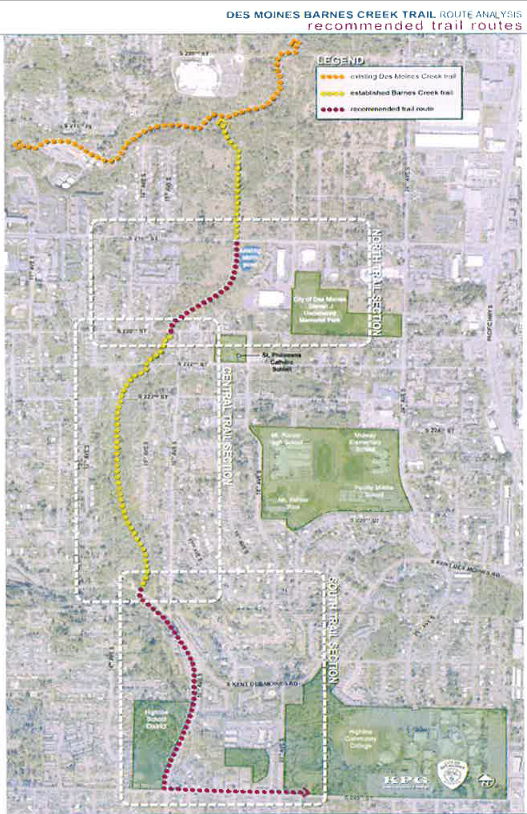
Des Moines Barnes Creek Trail Route Analysis Map — Parks Recreation and Senior Services Master Plan 2016–2021
A route analysis map produced by KPG for the Des Moines Barnes Creek Trail, showing existing Des Moines Creek Trail, established Barnes Creek Trail, and recommended trail routes across three sections (North, Central, and South). Key landmarks labeled include City of Des Moines/Lieutenant Memorial Park, St. Philomena Catholic School, Midway Cemetery, Highline School District, and Highline Community College. -
 2015-03-27
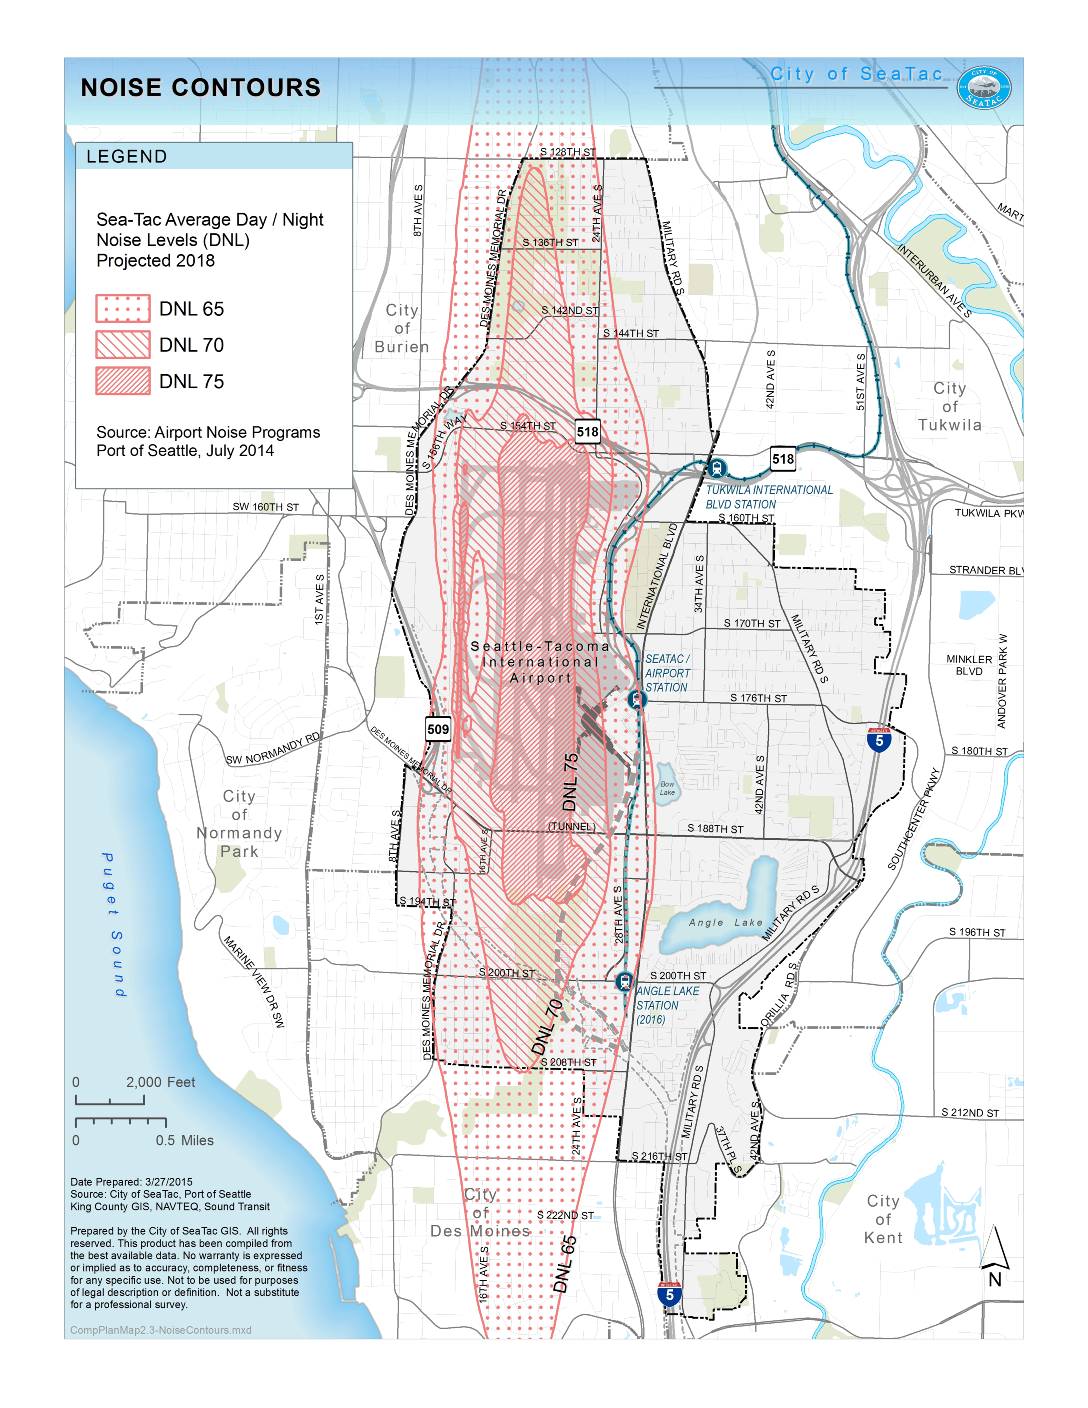
City of Sea-Tac Noise Contours Map: Sea-Tac Airport Projected 2018 DNL Levels
This map from the City of SeaTac shows projected 2018 average day/night noise levels (DNL) radiating from Seattle-Tacoma International Airport, with contour zones indicating areas expected to experience noise levels of 65, 70, and 75 decibels. The noise contours extend north into Burien, south into Des Moines, and affect portions of Tukwila and Normandy Park, with the most intense noise zone (DNL 75) centered directly over the airport. Prepared in March 2015 using Port of Seattle Airport Noise Programs data from July 2014, the map serves as a planning reference for land use and noise mitigation policy in surrounding communities.