TagMap(375)
-
 2022-08-27
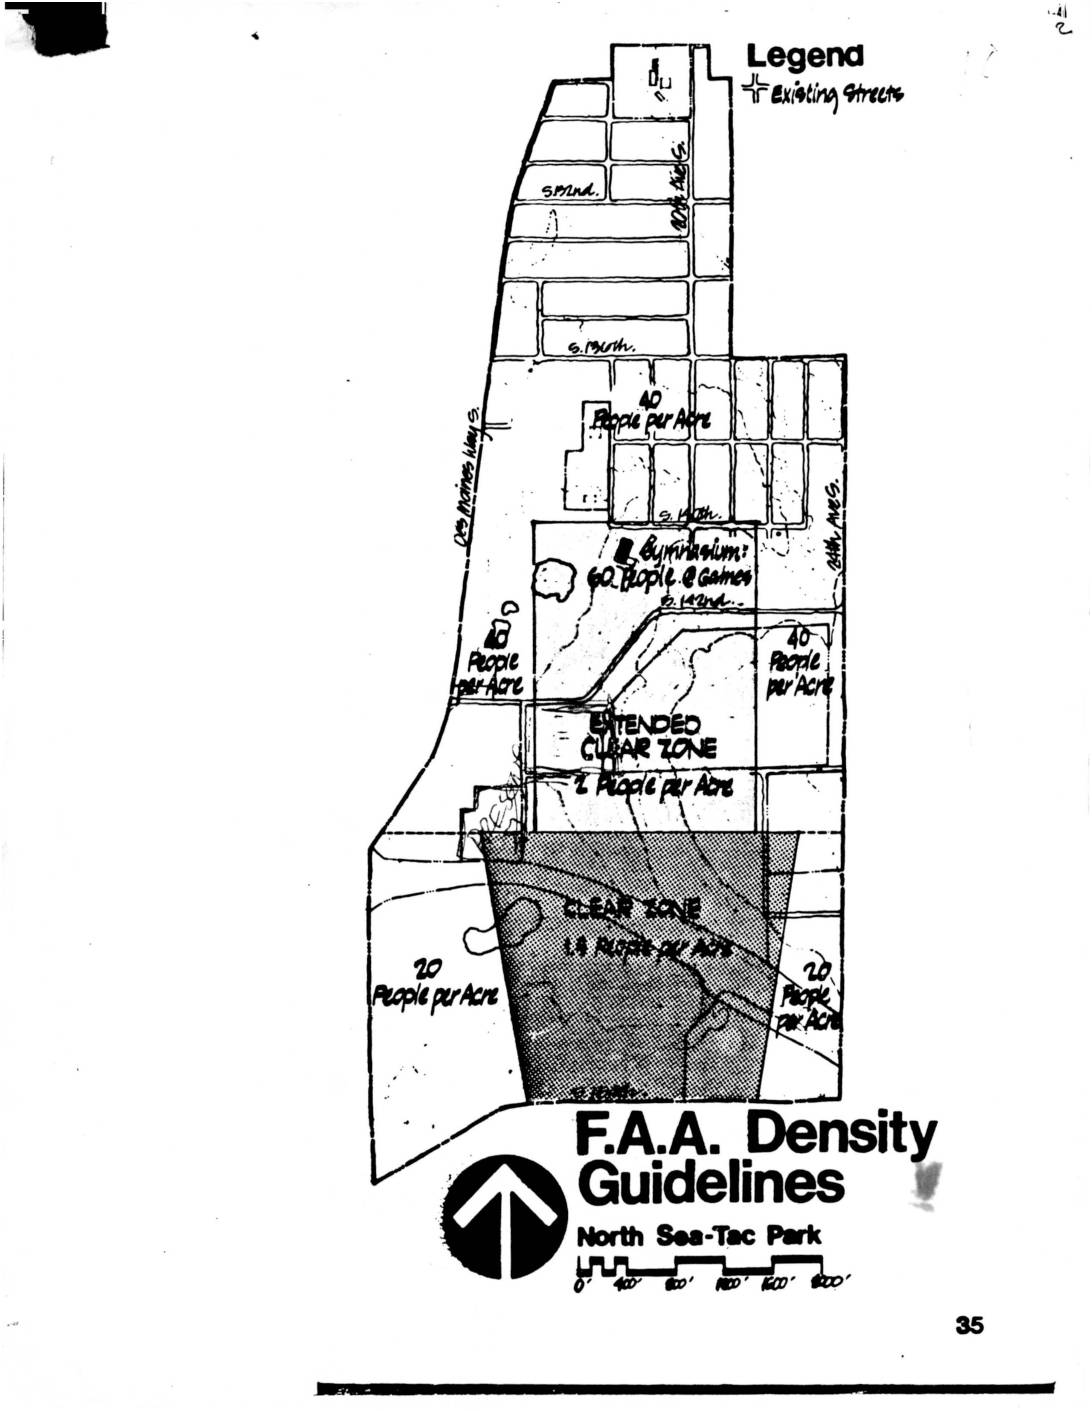
F.A.A. density guidelines: North Sea-Tac Park
This map illustrates the F.A.A. density guidelines for the North Sea-Tac Park area, showing recommended population limits per acre across different airport safety zones. The Clear Zone nearest the runway allows the fewest people (approximately 1.5 per acre), while the Extended Clear Zone permits around 2 people per acre, and surrounding residential areas are guided toward densities of 20 to 40 people per acre. A gymnasium is specifically noted at 60 people during games, reflecting how land use intensity is regulated based on proximity to airport flight paths. -
-
 2022-08-27
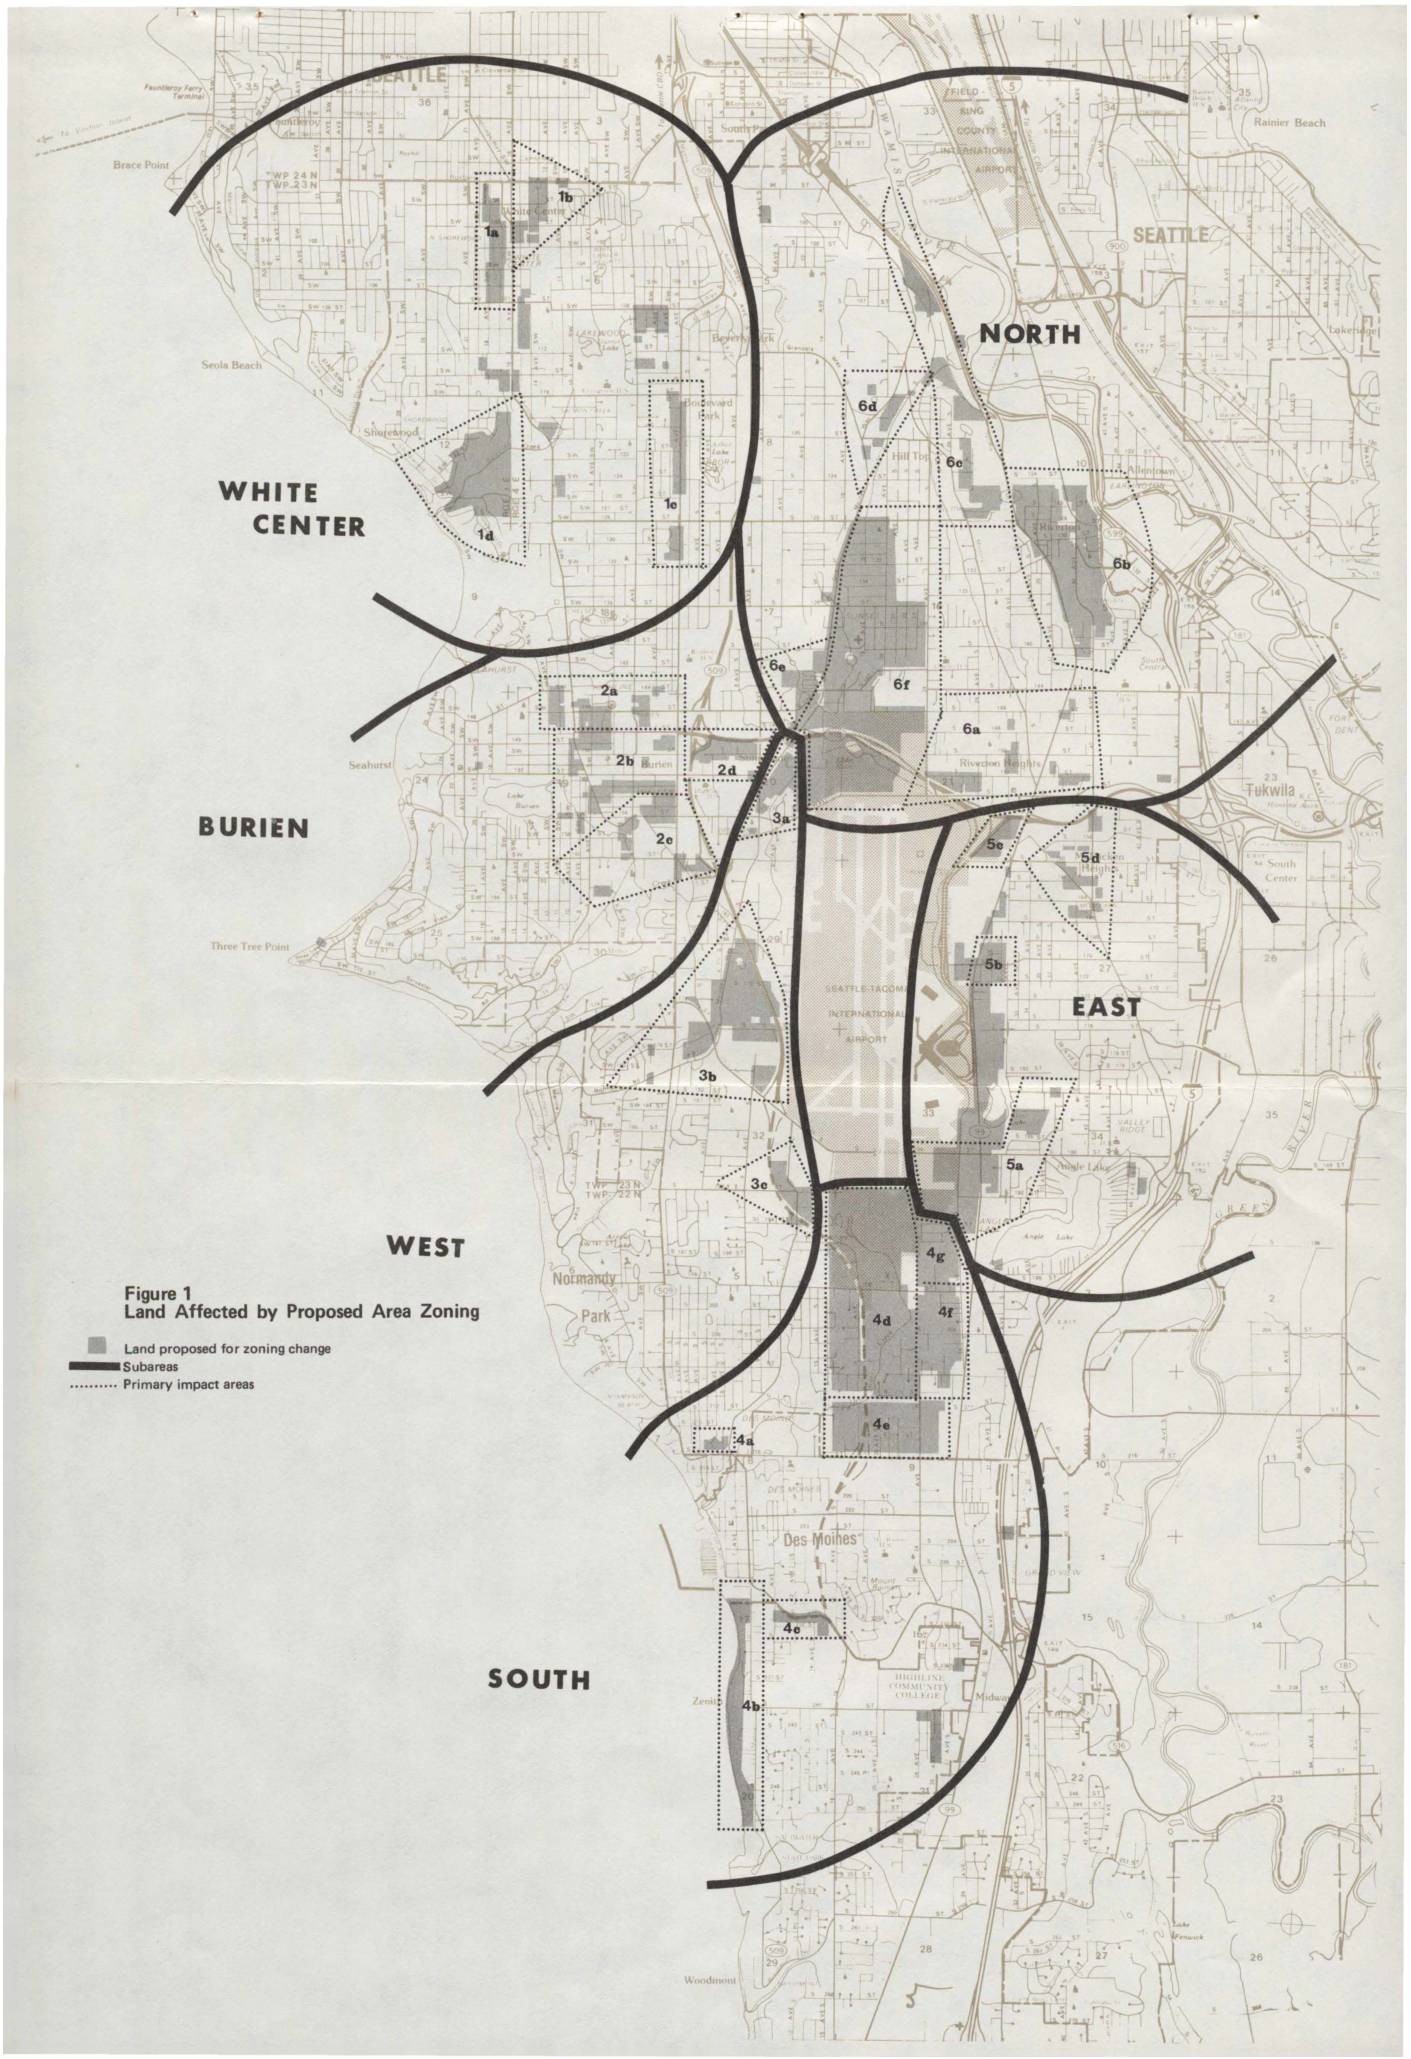
HCP Draft EIS Maps: Land Affected by Proposed Area Zoning and Proposed Changes in Residential and Nonresidential Zones
These three maps outline proposed area zoning changes in communities surrounding Seattle-Tacoma International Airport, including White Center, Burien, and nearby neighborhoods. The plans identify land targeted for rezoning across residential categories (such as downzoning to single-family or upzoning to multi-family) as well as nonresidential categories (including airport open use, manufacturing, commercial, and air terminal-related business). Dotted boundaries mark primary impact areas around the airport, reflecting efforts to align land use policy with airport noise and operational concerns. -
 2022-08-27
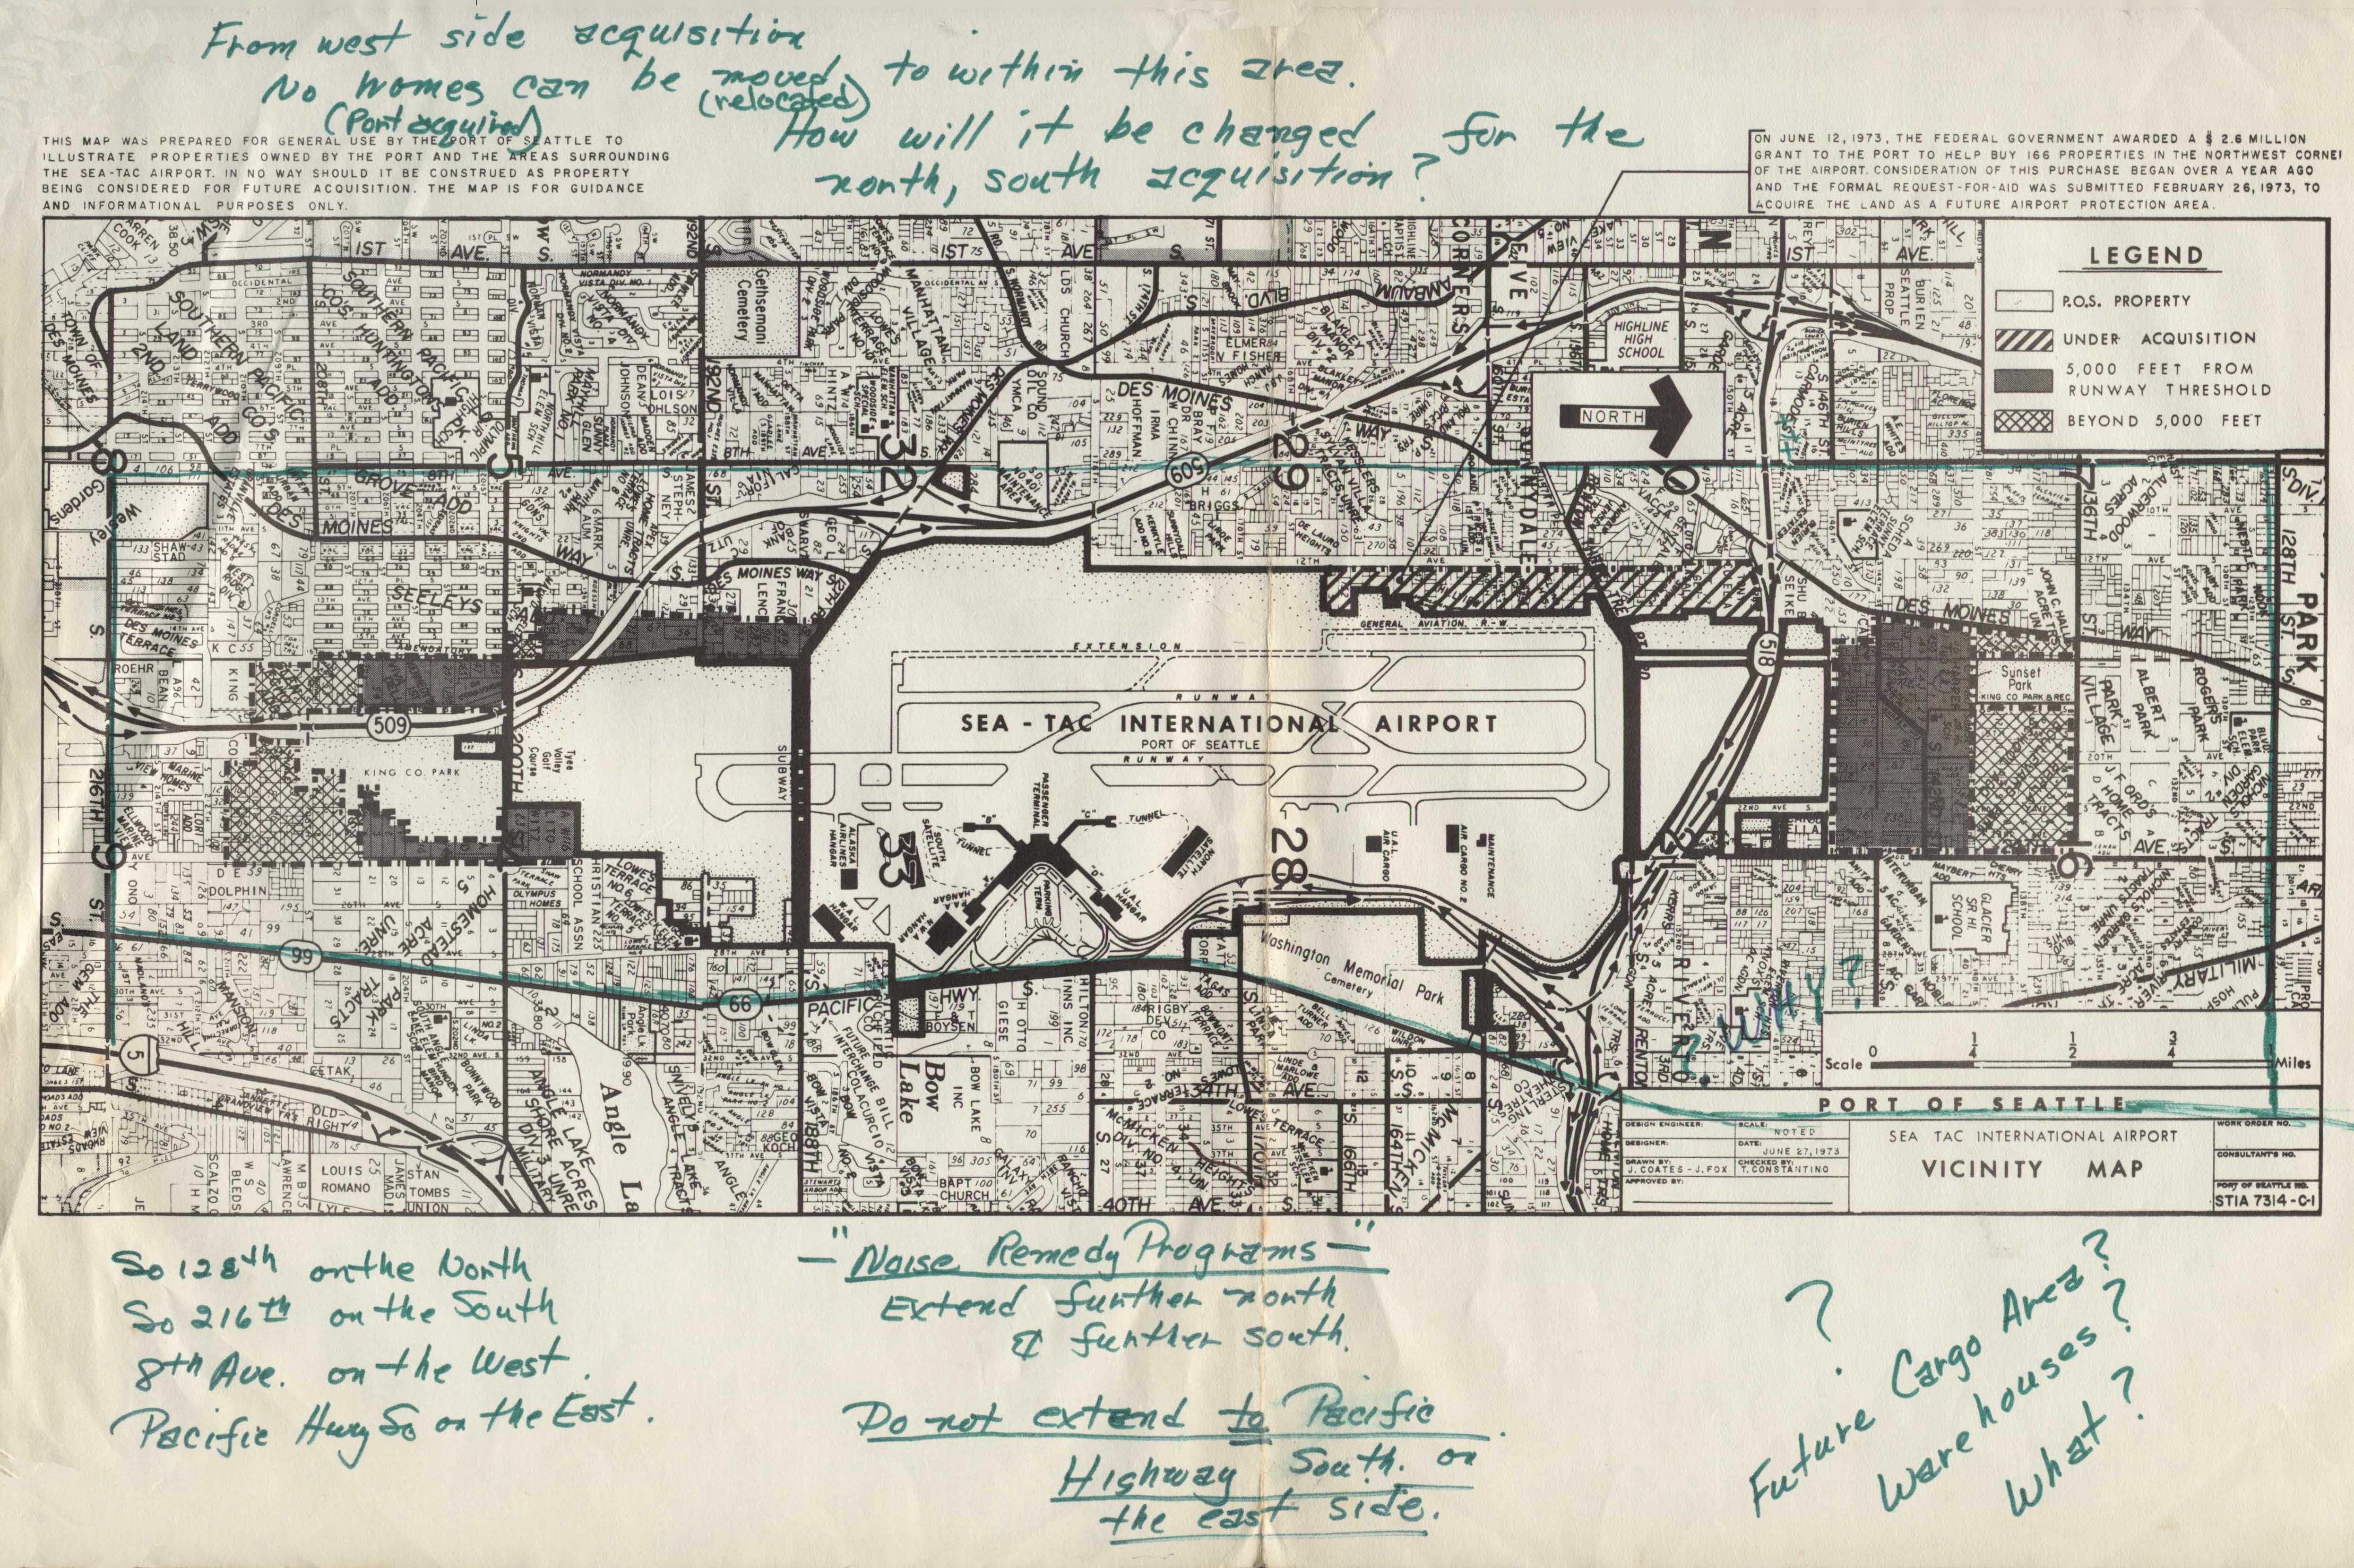
Sea-Tac Airport Vicinity Map with Notes by Virginia Dana — HB1328 Boundaries
A Port of Seattle vicinity map of Sea-Tac International Airport showing property acquisition zones, runway thresholds, and R.O.S. property boundaries, annotated in teal/green handwriting with notes about noise remedy program boundaries (So. 128th on the North, So. 216th on the South, 8th Ave. on the West, Pacific Hwy. on the East), questions about relocation of homes in the west-side acquisition area, and queries about a future cargo area. The printed legend and map title confirm this is an official Port of Seattle document. -
 2022-08-24
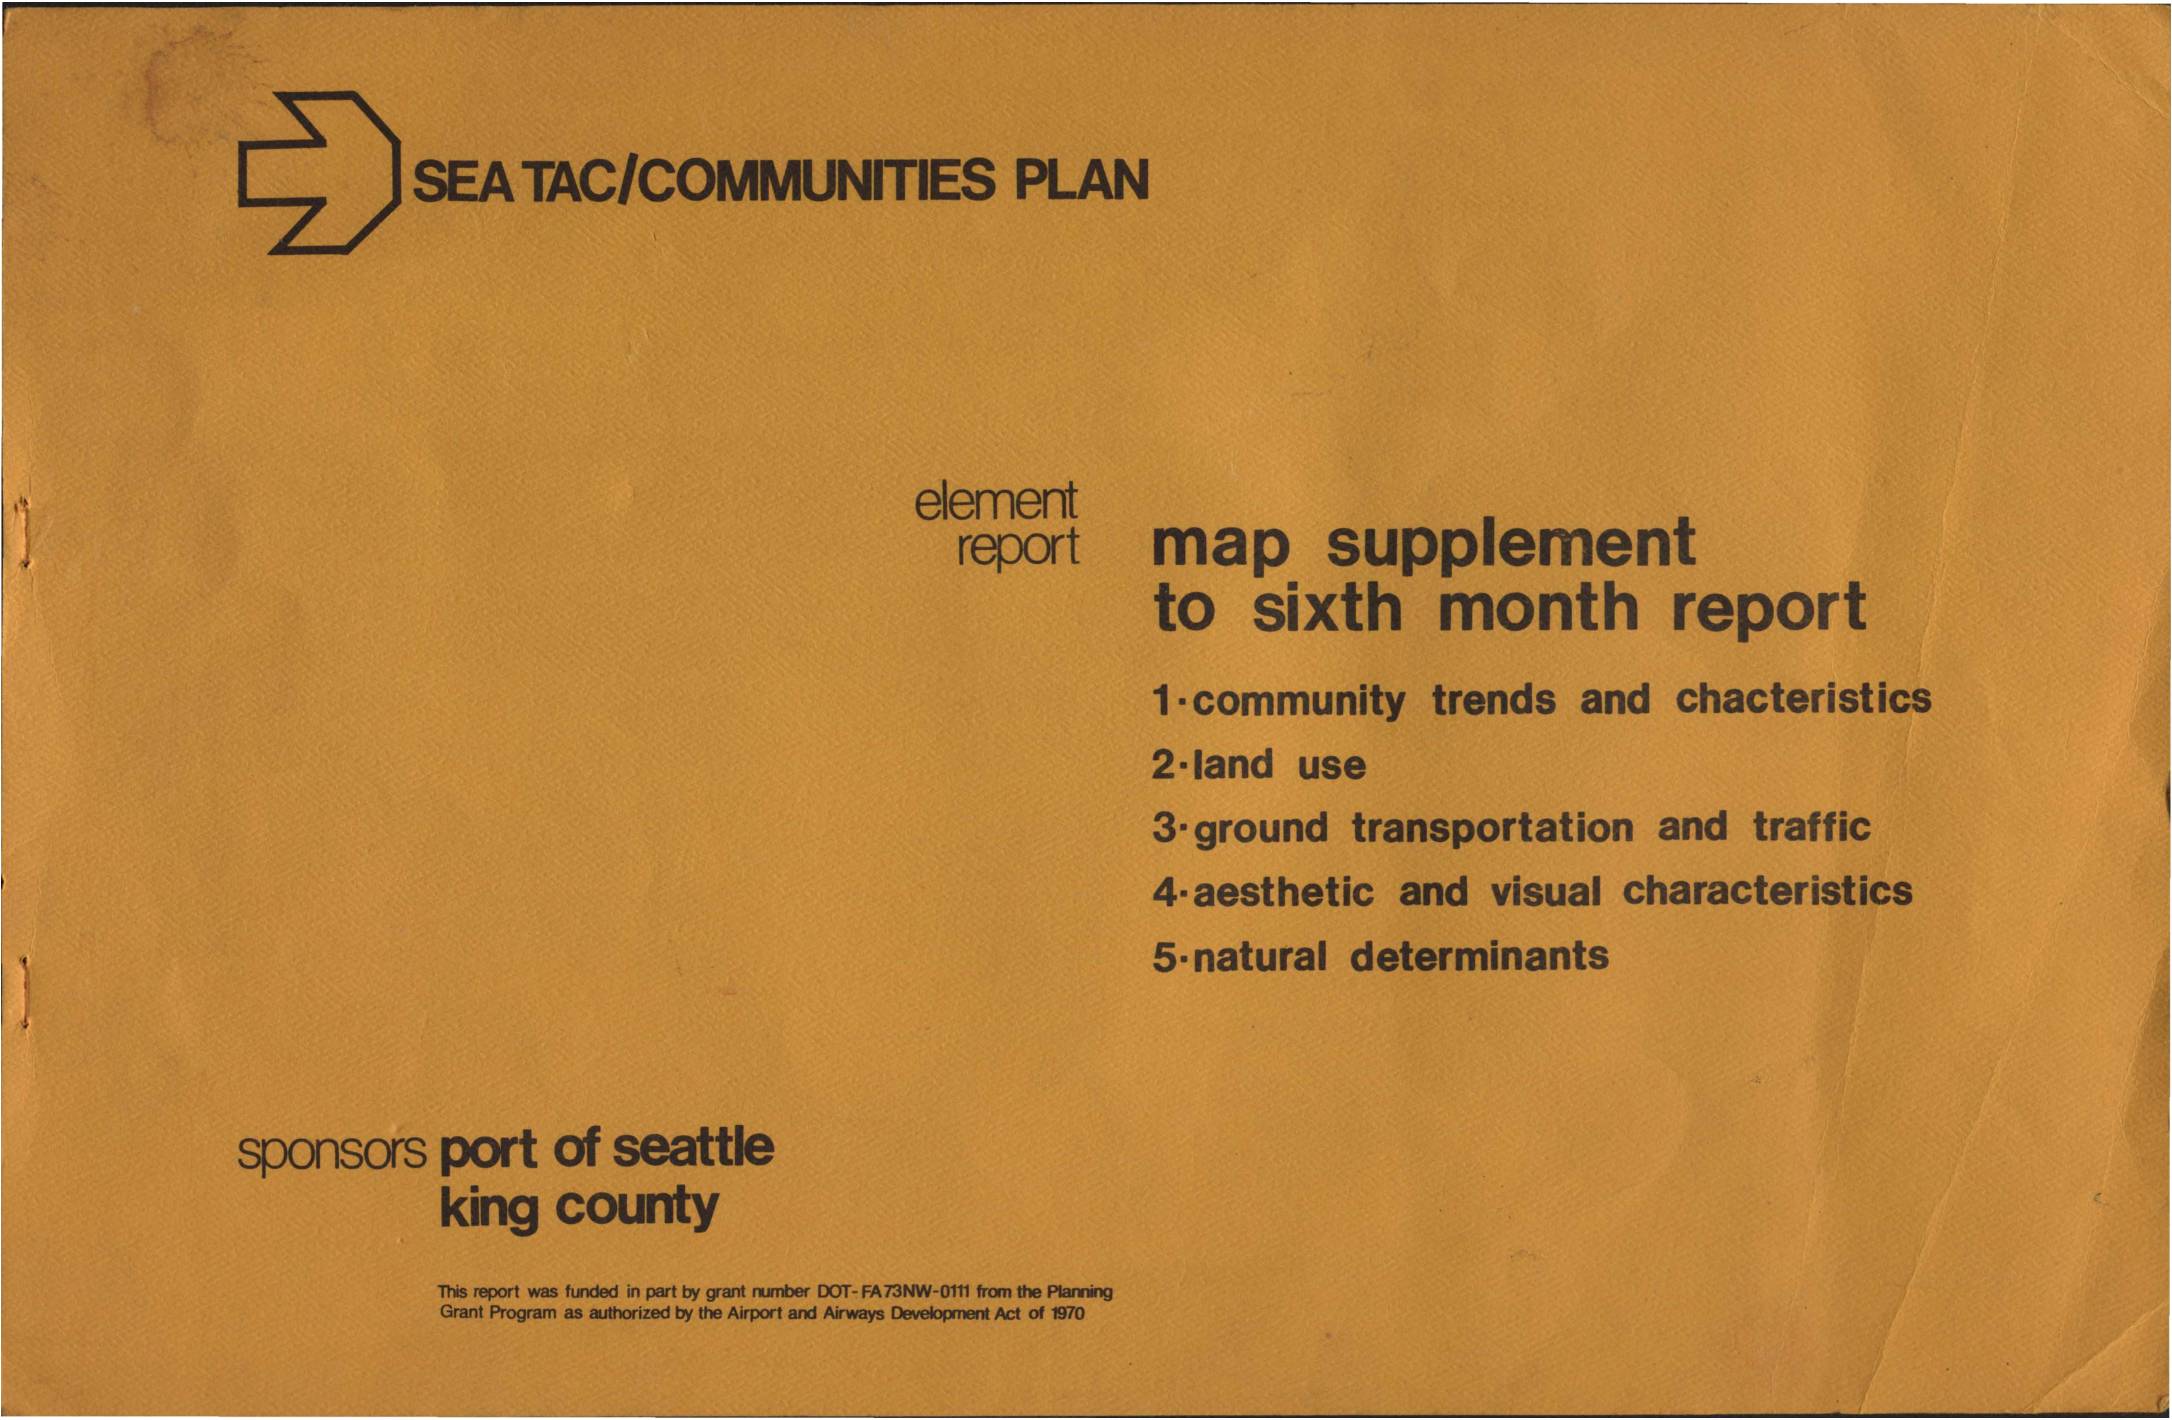
Sea-Tac Communities Plan: Map Supplement to Sixth Month Report
The Sea-Tac/Communities Plan is a planning study co-sponsored by the Port of Seattle and King County, funded through a federal grant under the Airport and Airways Development Act of 1970. It serves as a map supplement to a sixth-month report, covering community trends and characteristics, land use, ground transportation and traffic, aesthetic and visual qualities, and natural determinants in the communities surrounding Seattle-Tacoma International Airport. The 1973 report includes demographic data such as median age, the percentage of residents under 20, and the percentage of residents 65 and older, mapped across 1970 census tracts in the Sea-Tac area. -
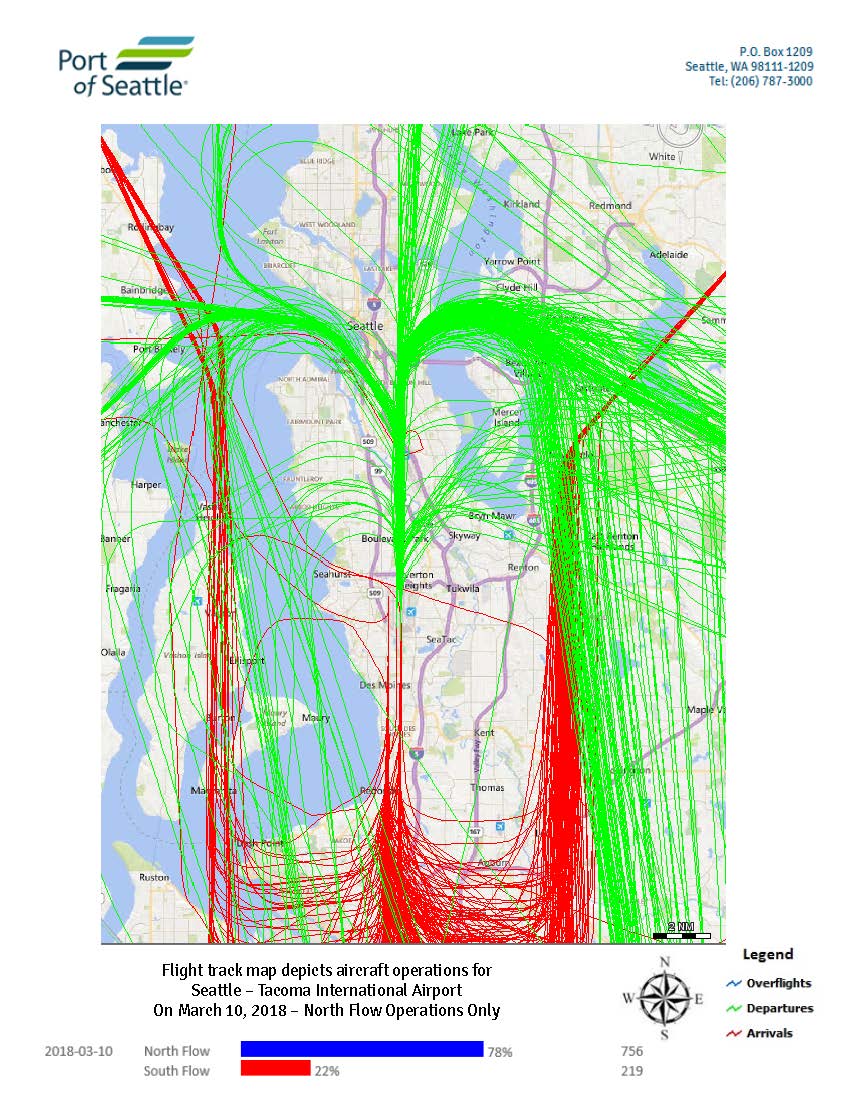
18-120 DailyFTMbyFlow_Page_16
Port of Seattle flight track map showing aircraft operations at Seattle-Tacoma International Airport on March 10, 2018, depicting North Flow operations at 78% (756 operations) and South Flow at 22% (219 operations). Green lines indicate departures, red lines indicate arrivals, and blue/gray lines indicate overflights. -
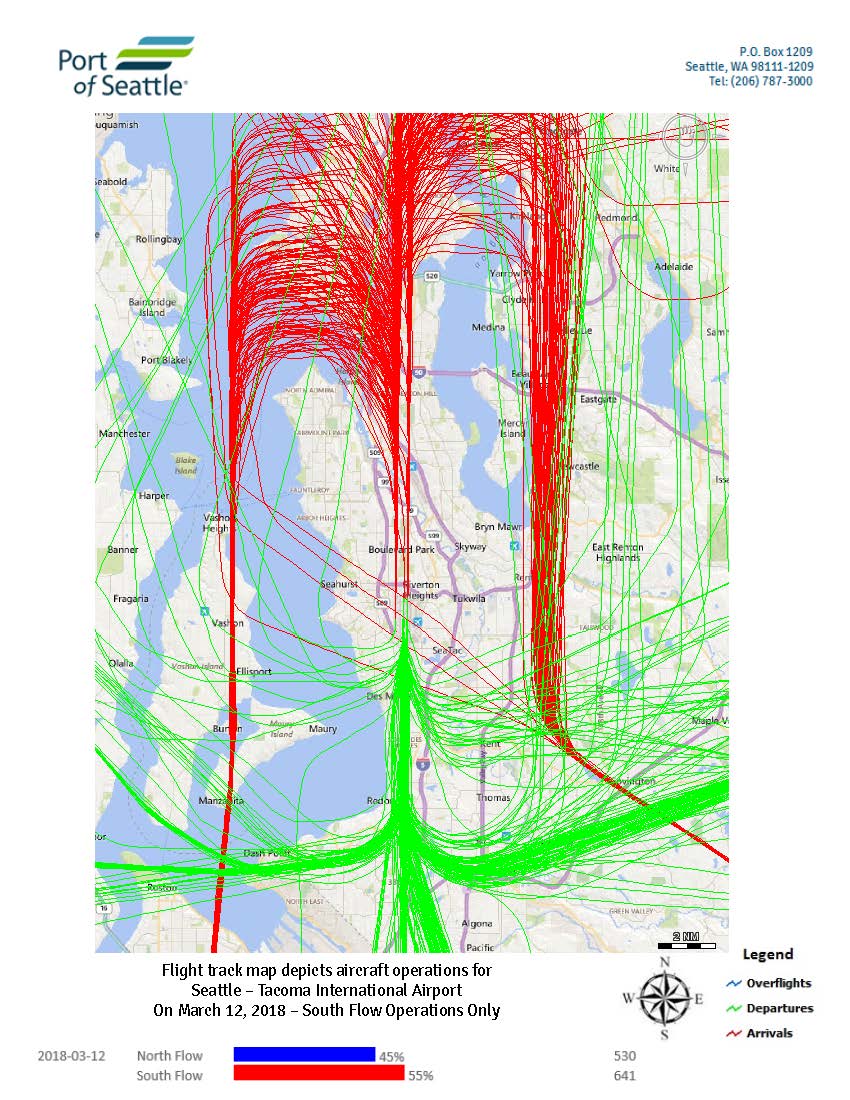
18-120 DailyFTMbyFlow_Page_18
Port of Seattle flight track map depicting aircraft operations at Seattle-Tacoma International Airport on March 12, 2018, showing South Flow operations only. On that date, North Flow accounted for 45% of operations (530 flights) and South Flow accounted for 55% (641 flights); arrival tracks are shown in red and departure tracks in green. -
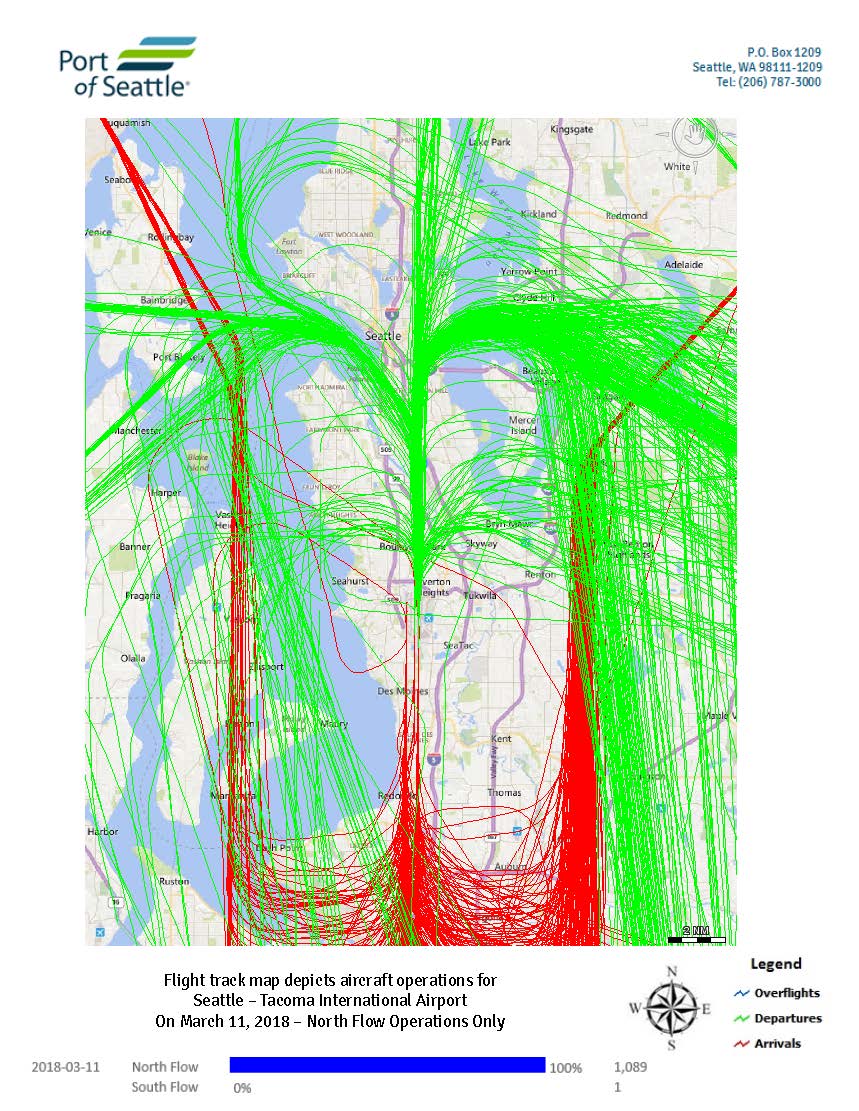
18-120 DailyFTMbyFlow_Page_17
A Port of Seattle flight track map depicting all aircraft operations at Seattle-Tacoma International Airport on March 11, 2018, during North Flow operations only. The map shows 1,089 total operations (100% North Flow), with green lines indicating departures, red lines indicating arrivals, and blue lines indicating overflights, overlaid on a geographic map of the greater Seattle-Tacoma area. -
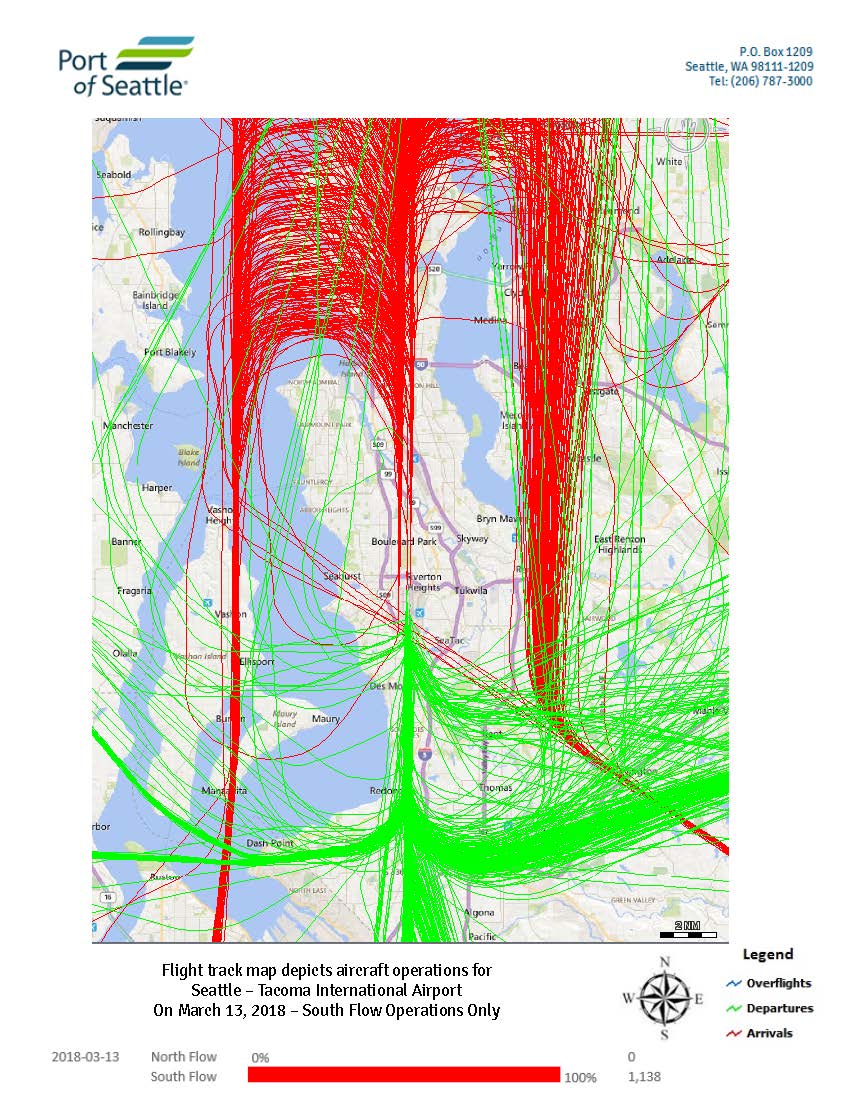
18-120 DailyFTMbyFlow_Page_20
A Port of Seattle flight track map depicting all aircraft operations at Seattle-Tacoma International Airport on March 13, 2018, during South Flow operations only. The map shows 1,138 total operations at 100% South Flow, with green lines indicating departures, red lines indicating arrivals, and blue lines indicating overflights, overlaid on a geographic map of the greater Seattle-Tacoma area. -
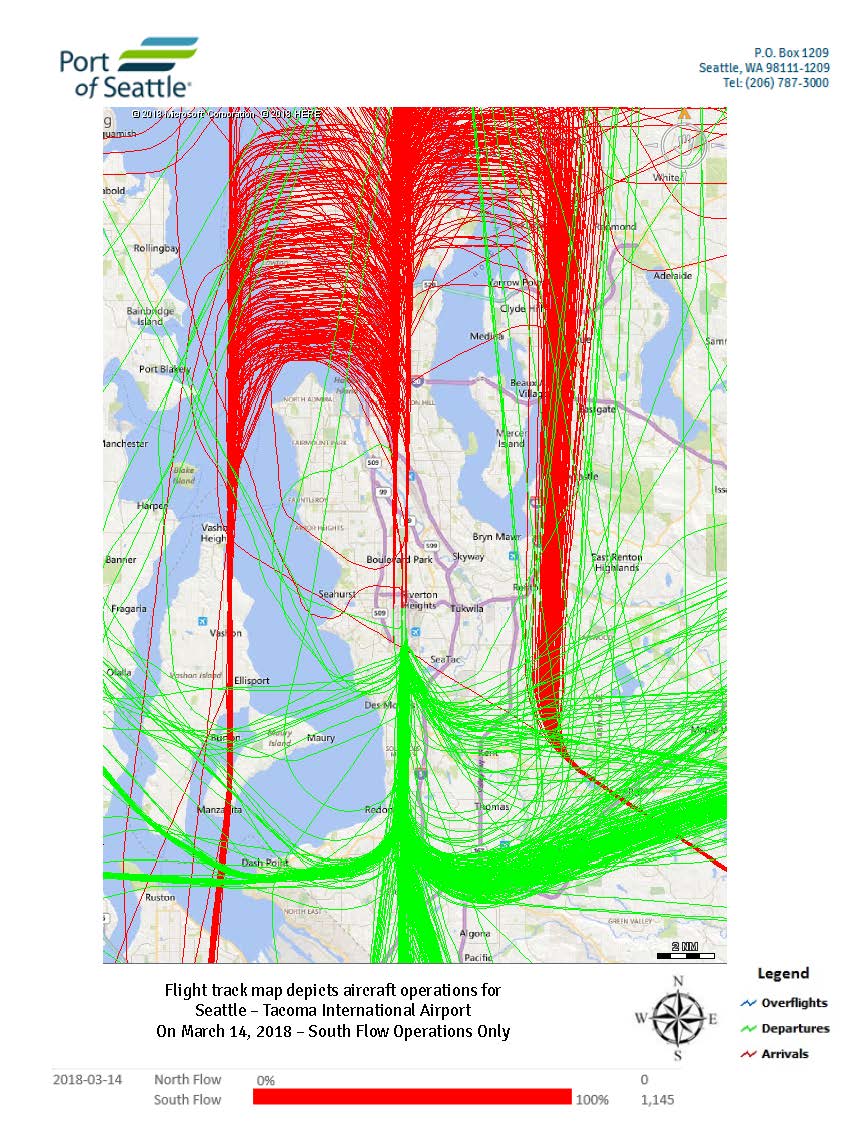
18-120 DailyFTMbyFlow_Page_21
Port of Seattle flight track map depicting aircraft operations at Seattle-Tacoma International Airport on March 14, 2018, showing 100% South Flow operations totaling 1,145 flights. The map displays arrivals (red), departures (green), and overflights (blue) over the greater Seattle-Tacoma area.