TagMap(375)
-
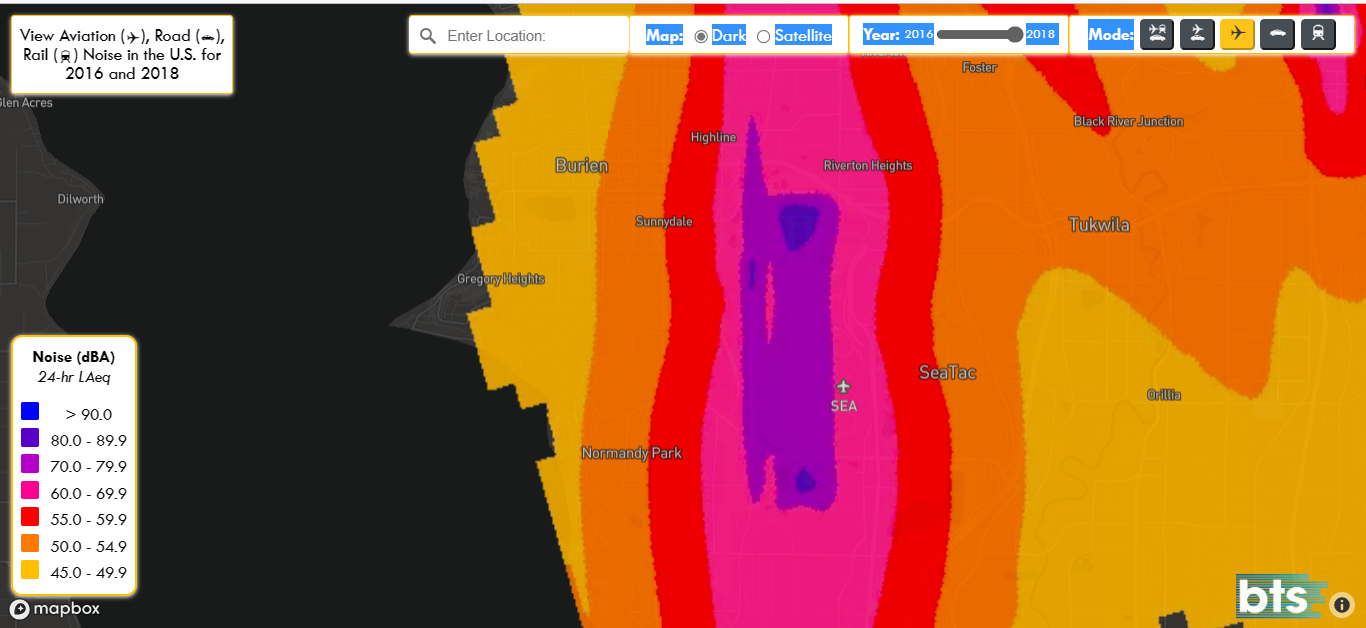
2018 Department of Transportation Noise Map near Sea-Tac Airport
A Bureau of Transportation Statistics (BTS) interactive noise map displaying 24-hour average sound levels (dBA, LAeq) around Seattle-Tacoma International Airport (SEA) for years 2016 and 2018, shown in aviation mode. The map reveals noise contours ranging from 45 dBA (yellow) to over 90 dBA (dark blue/purple), with the highest noise levels concentrated directly along the flight path corridor through communities including Burien, SeaTac, Highline, Sunnydale, and Normandy Park. -
 2023-05-23
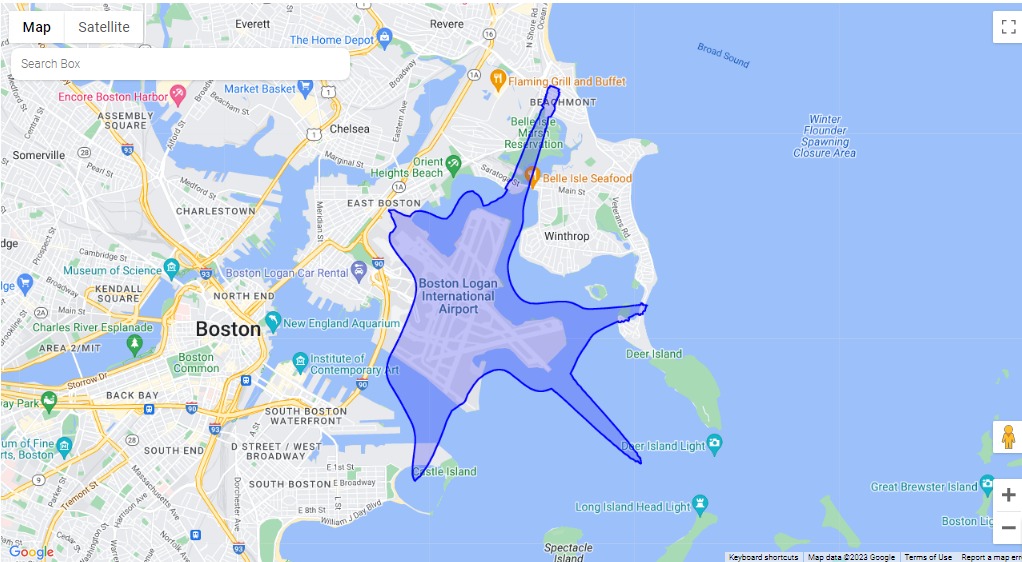
Boston Logan International Airport Noise or Flight Path Boundary Map
A Google Maps screenshot showing a blue polygon boundary drawn around Boston Logan International Airport (BOS) in East Boston, Massachusetts, extending over Boston Harbor toward Winthrop and Deer Island. The map includes visible labels for Boston Logan International Airport, surrounding neighborhoods, and landmarks such as Castle Island and Deer Island Light. -
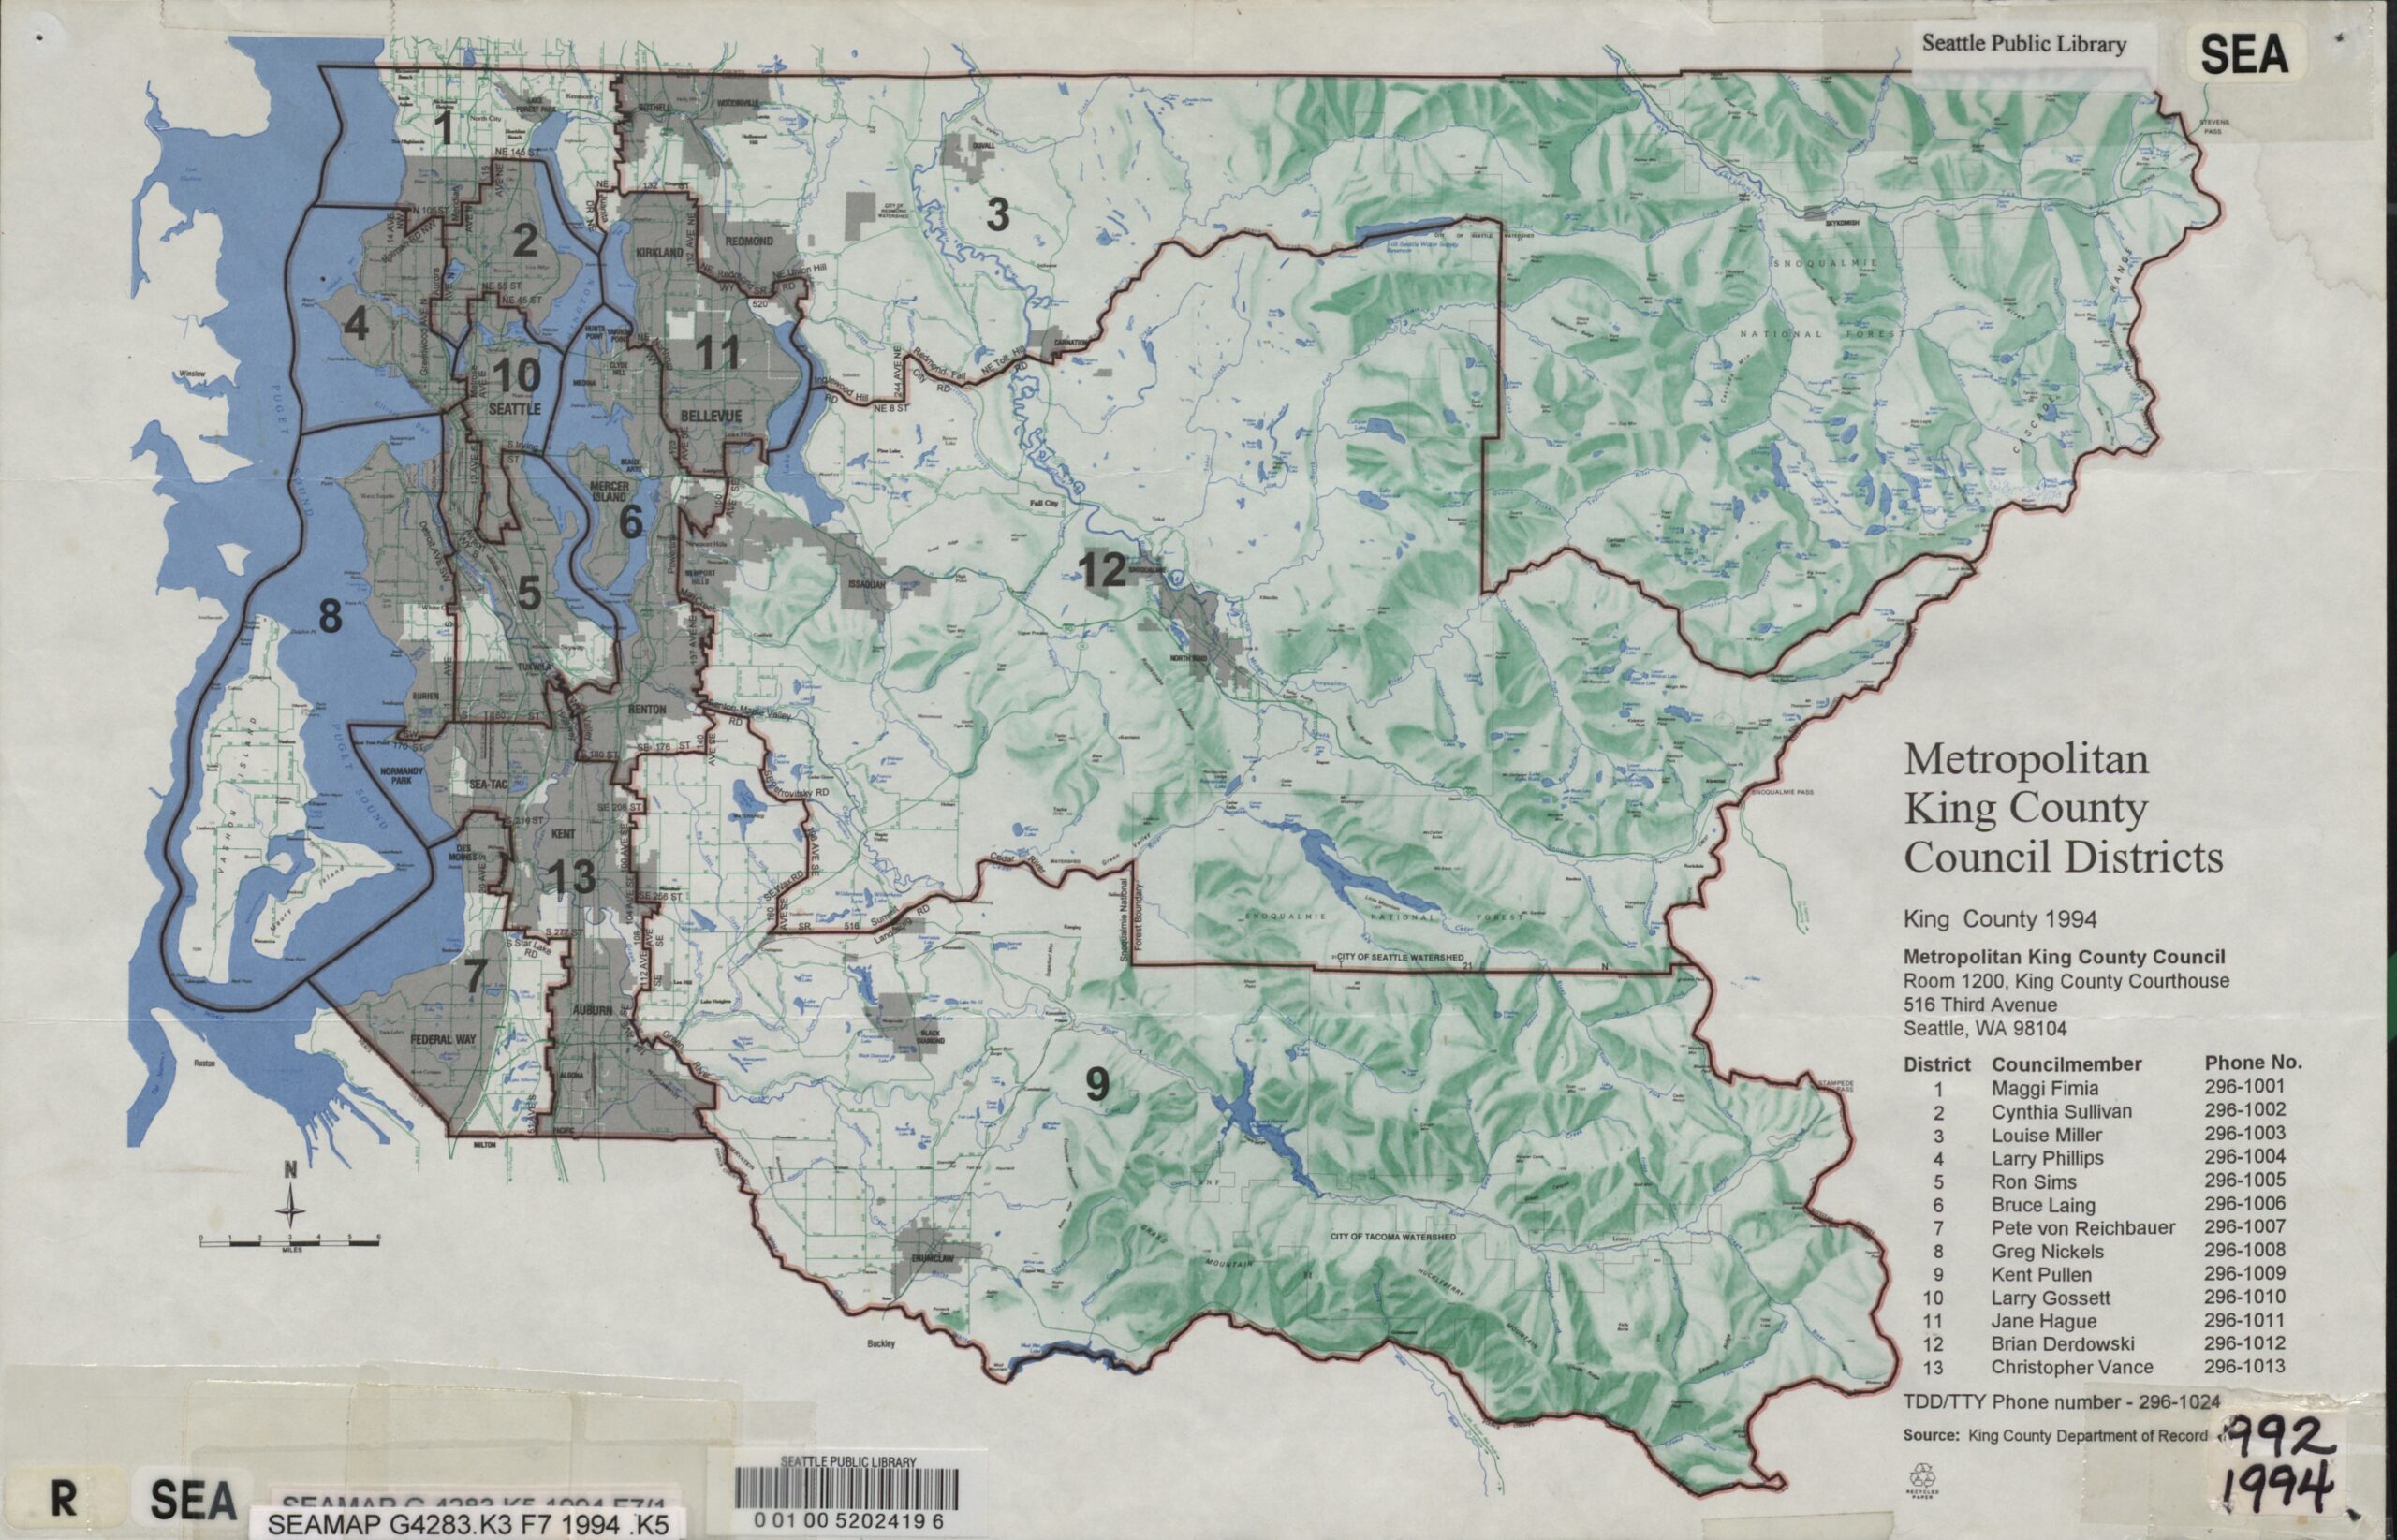
1994 King County Council Districts
A 1994 map from the King County Department of Records showing the 13 Metropolitan King County Council Districts, held by the Seattle Public Library (call number SEAMAP G4283.K3 F7 1994 .K5). The legend lists all 13 councilmembers by district, including representatives for districts covering the Sea-Tac area: District 7 (Pete von Reichbauer), District 13 (Christopher Vance), and District 5 (Ron Sims). -
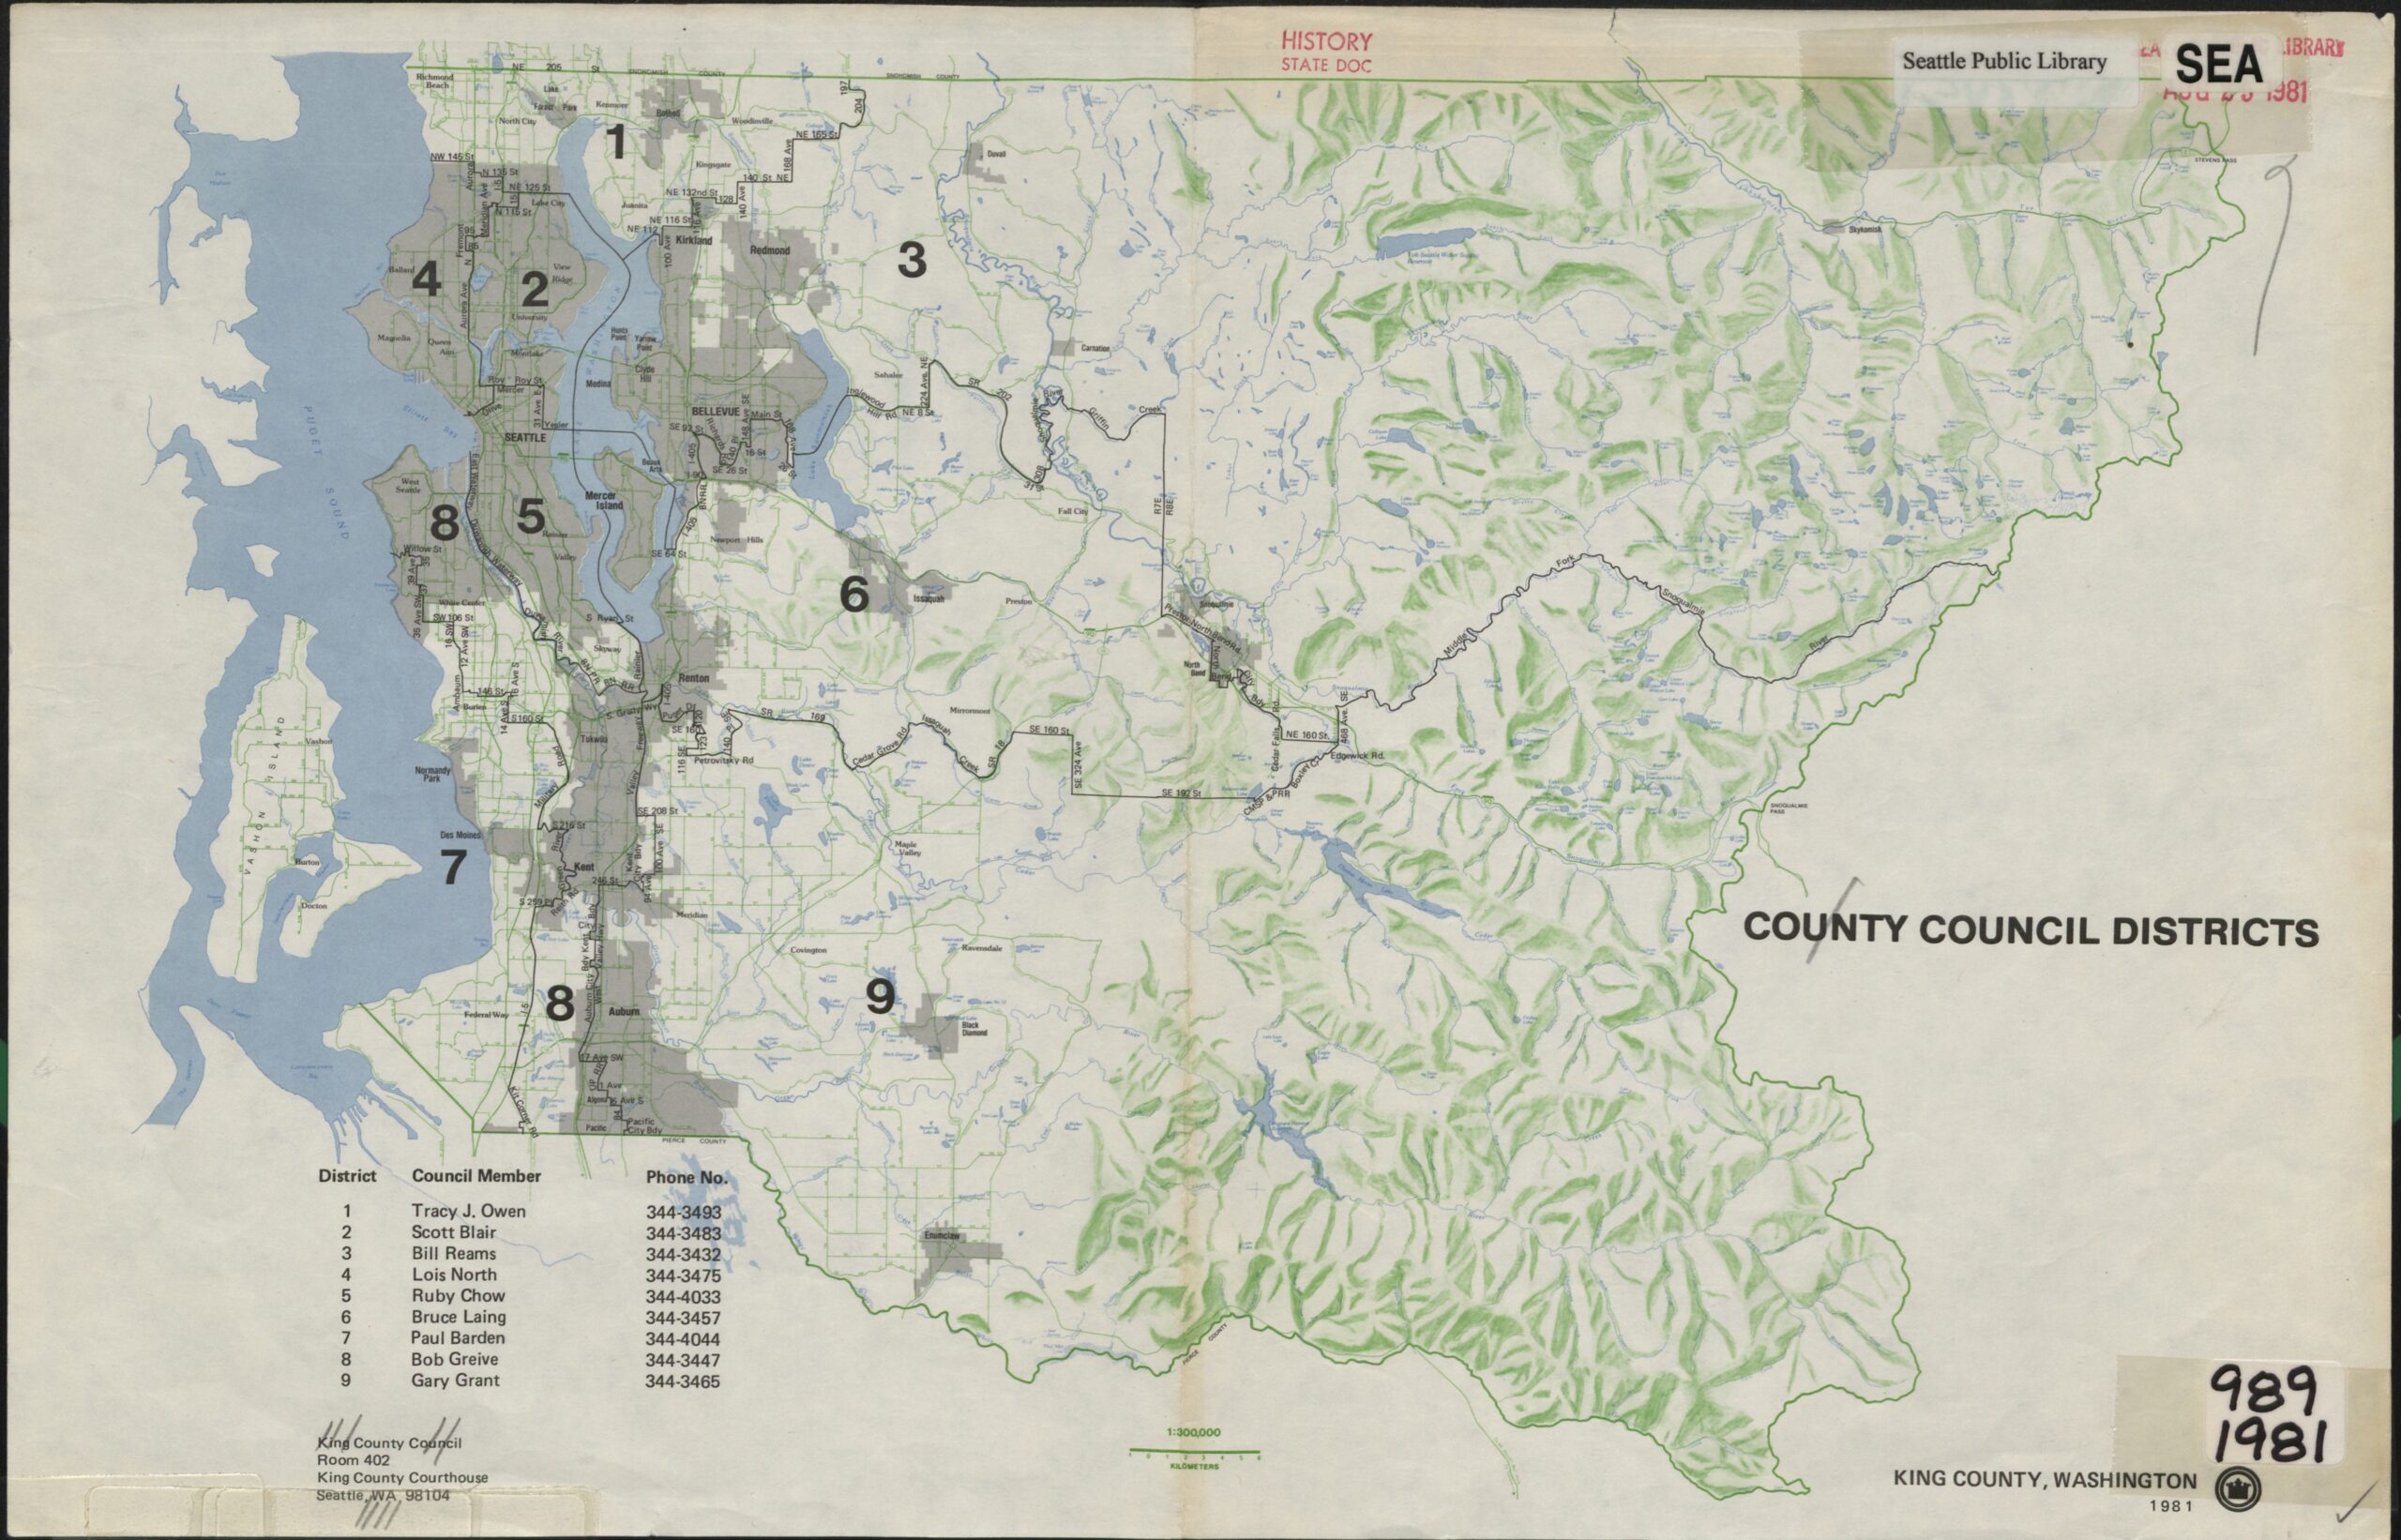
1981 King County Council Districts
A 1981 King County, Washington official map showing nine County Council Districts with council member names and phone numbers listed (Tracy J. Owen through Gary Grant, Districts 1–9). The map was catalogued by the Seattle Public Library under History/State Doc and includes the King County Courthouse address in Seattle, WA 98104. -
 2023-04-24
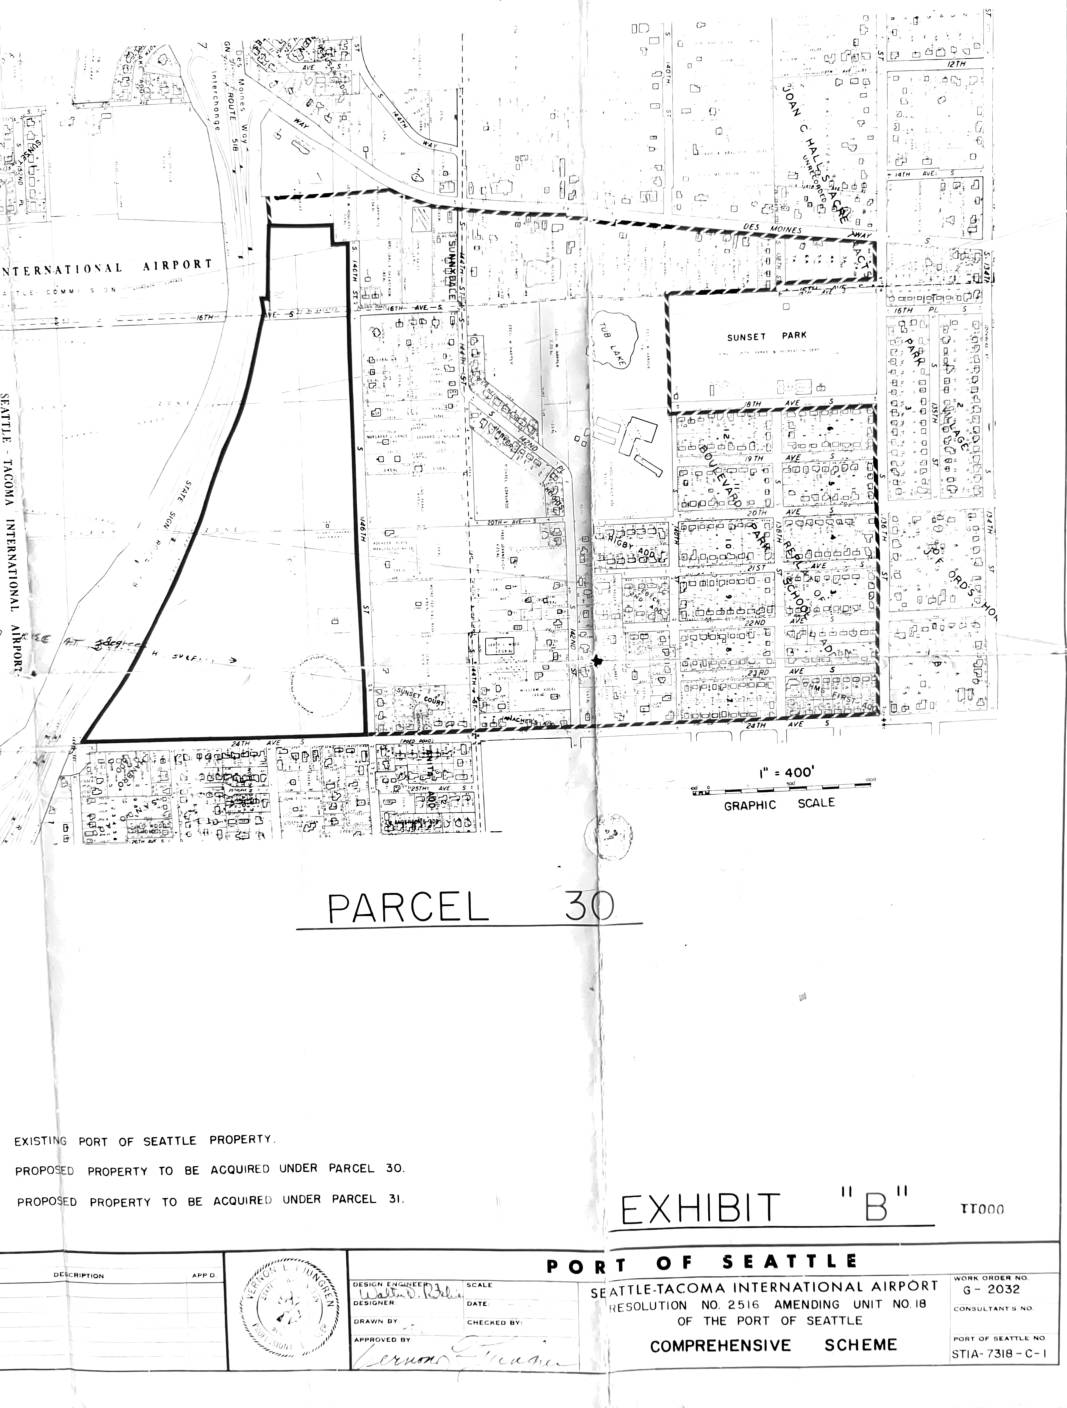
Parcel 30 – Exhibit B: Port Of Seattle comprehensive scheme, Resolution No. 2516 amending Unit No. 18
This document is Exhibit 'B' to Port of Seattle Resolution No. 2516, which amends Unit No. 18 of the Port of Seattle's Comprehensive Scheme for Seattle-Tacoma International Airport. It contains maps (Work Order No. G-2032, drawing STIA-7318-C-1) identifying Parcel 30 and Parcel 31 — areas of land proposed for acquisition by the Port of Seattle adjacent to the existing airport property, including neighborhoods near Sunset Park and Des Moines. The maps delineate existing Port-owned land from the proposed acquisition parcels, indicating planned airport expansion or noise-buffer land purchases in the surrounding residential area. -
 2023-04-24
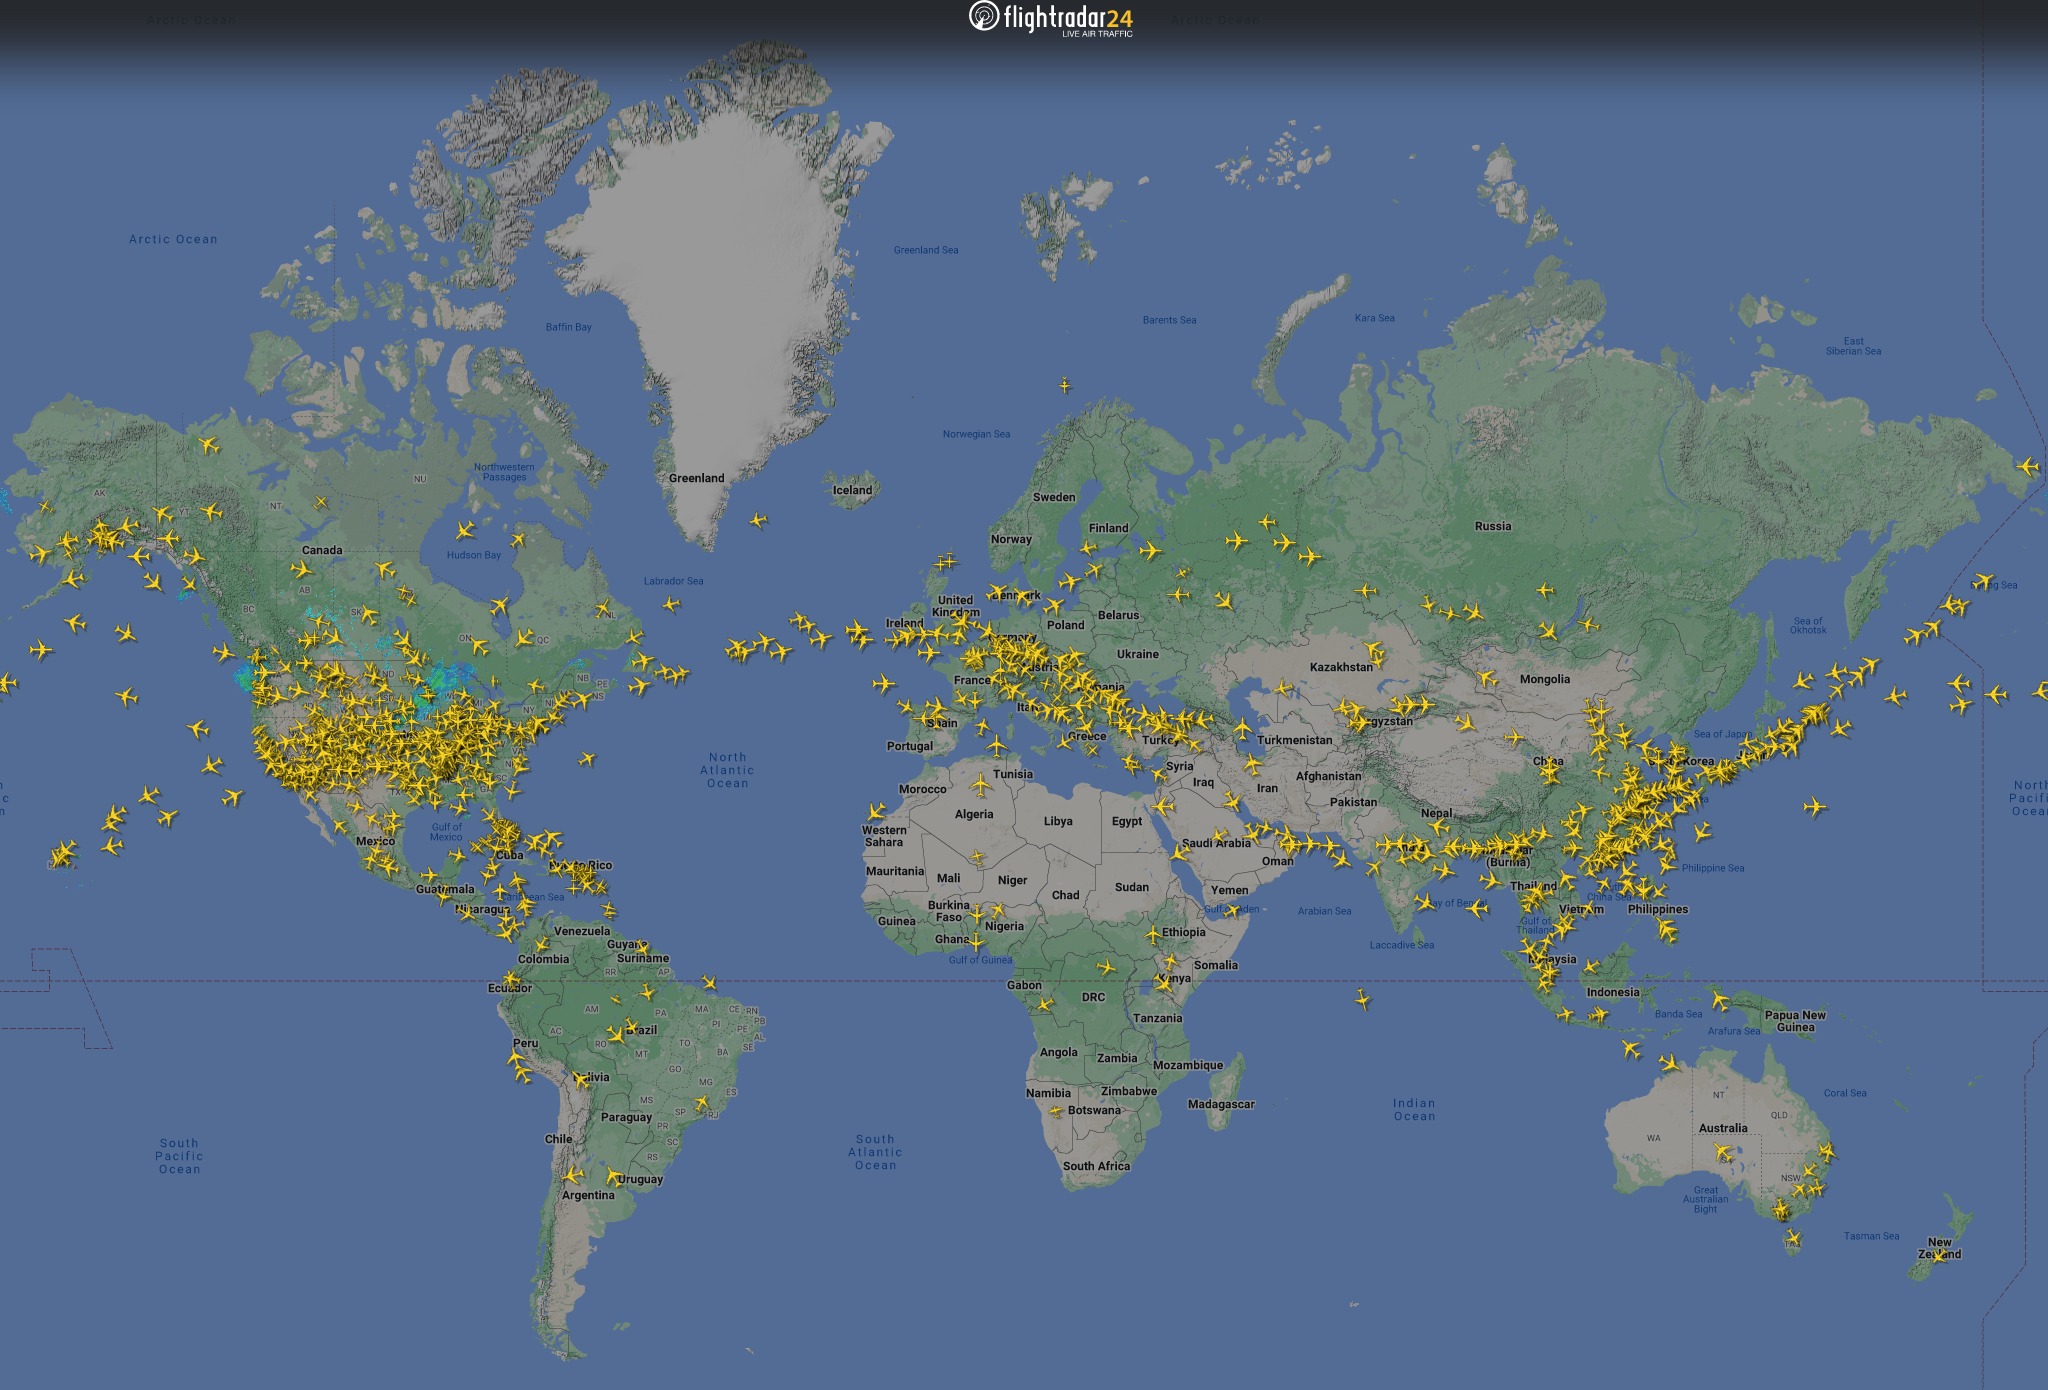
Commercial flights across the world 04/24/2023
A screenshot from Flightradar24 (flightradar24.com), a live flight tracking service, showing global air traffic with yellow aircraft icons distributed across a world map. The highest concentrations of flights are visible over the continental United States, Europe, and East Asia. -
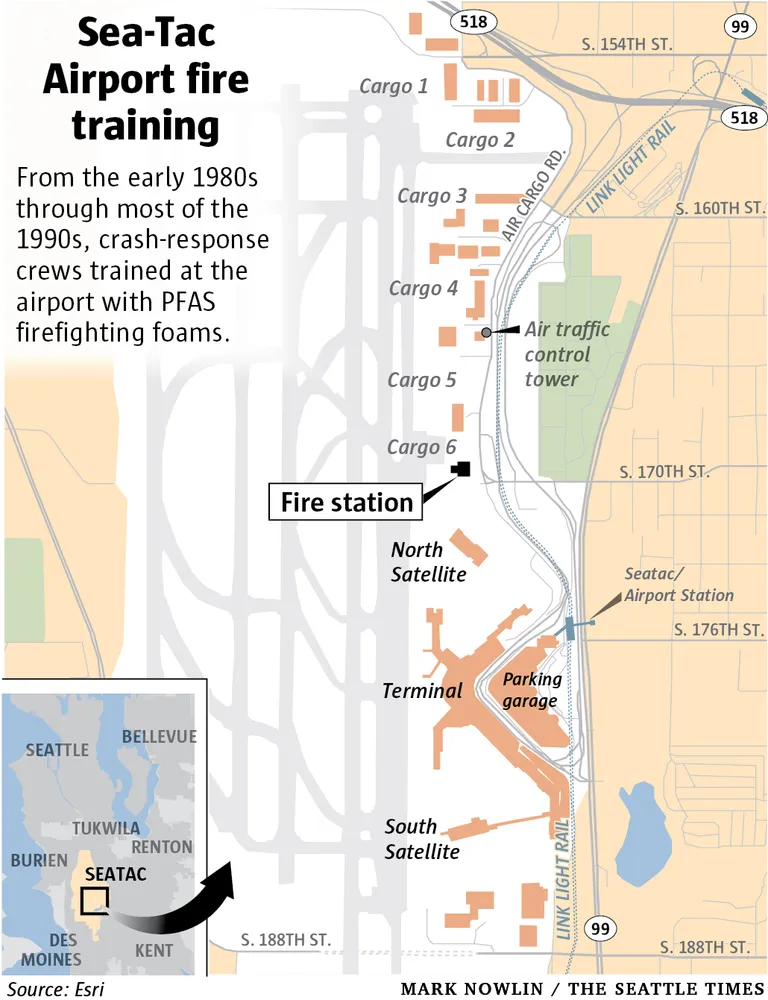
Sea-Tac Airport Map Showing Cargo Facilities, Fire Station, and PFAS Firefighting Foam Training Areas
An infographic by Mark Nowlin published in The Seattle Times, sourced from Esri, showing a map of Seattle-Tacoma International Airport (Sea-Tac) and its cargo facilities, fire station, terminals, and Link Light Rail corridor. The graphic explains that from the early 1980s through most of the 1990s, crash-response crews trained at the airport using PFAS firefighting foams. -
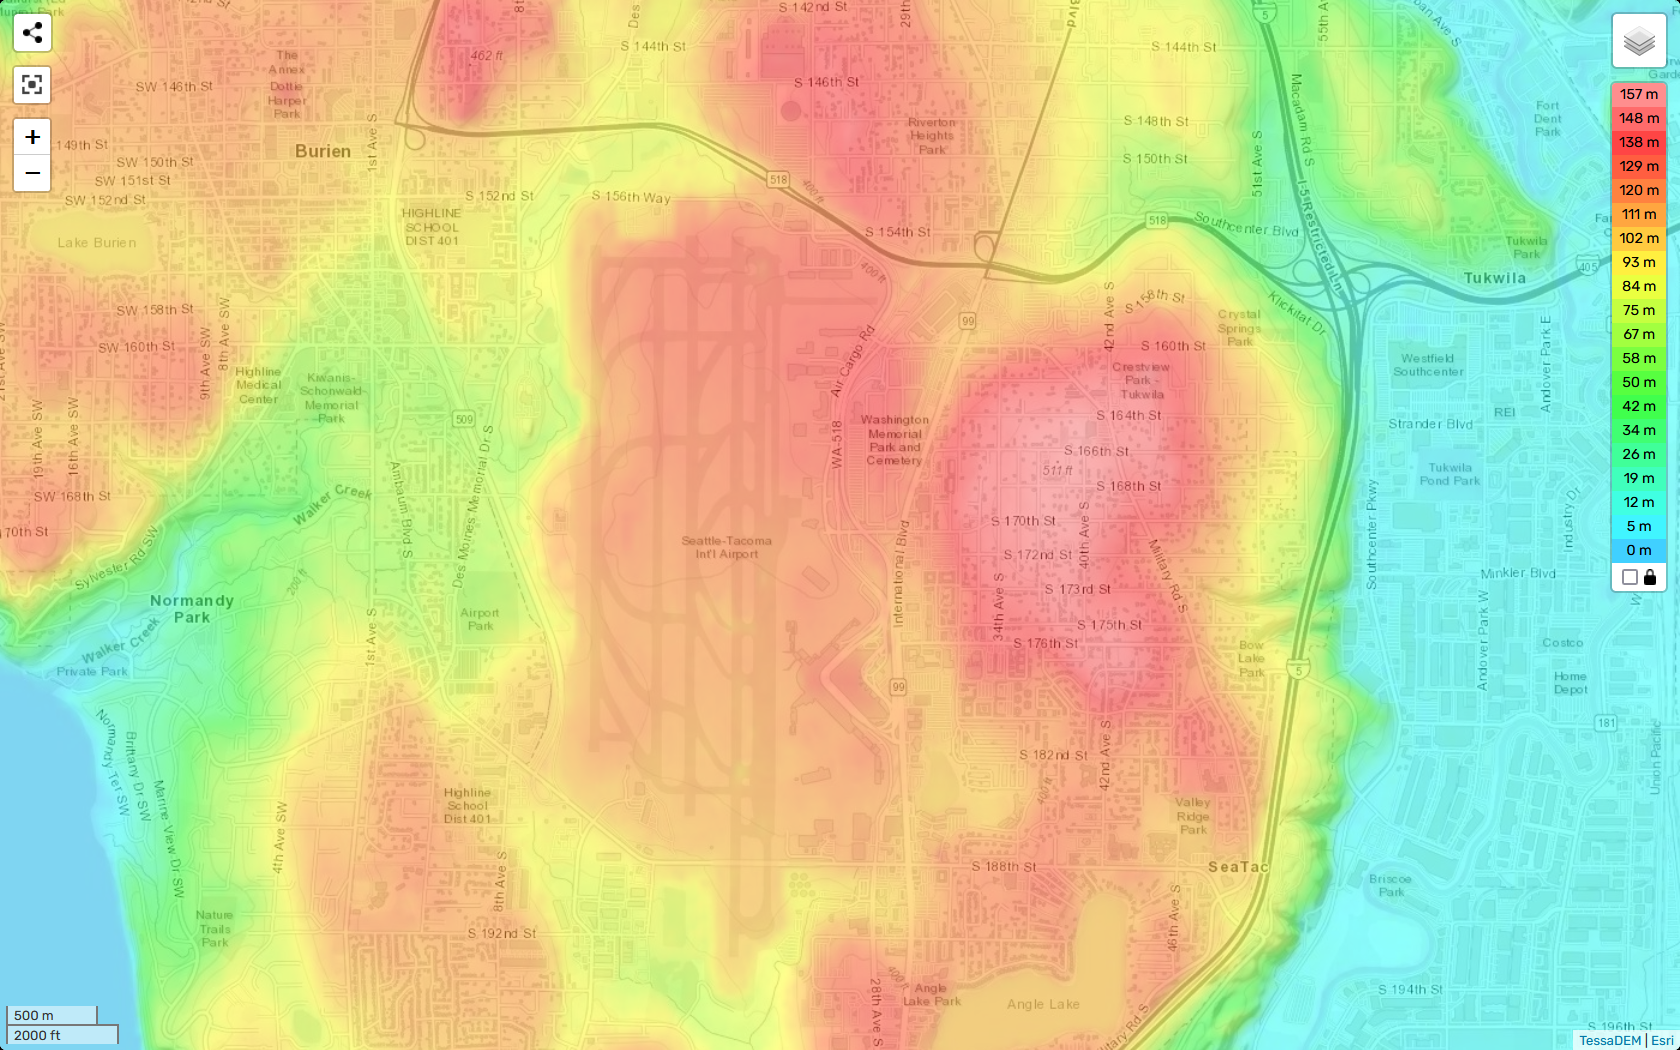
TessaDEM Elevation Heatmap of Sea-Tac Airport and Surrounding Communities
A TessaDEM/Esri elevation heatmap centered on Seattle-Tacoma International Airport and surrounding communities including Burien, Tukwila, SeaTac, and Normandy Park. The color scale ranges from 0 m (cyan/blue) to 157 m (deep red), with the highest elevations visible in the airport's central plateau and adjacent residential areas to the east near S. 164th–S. 182nd Streets. -
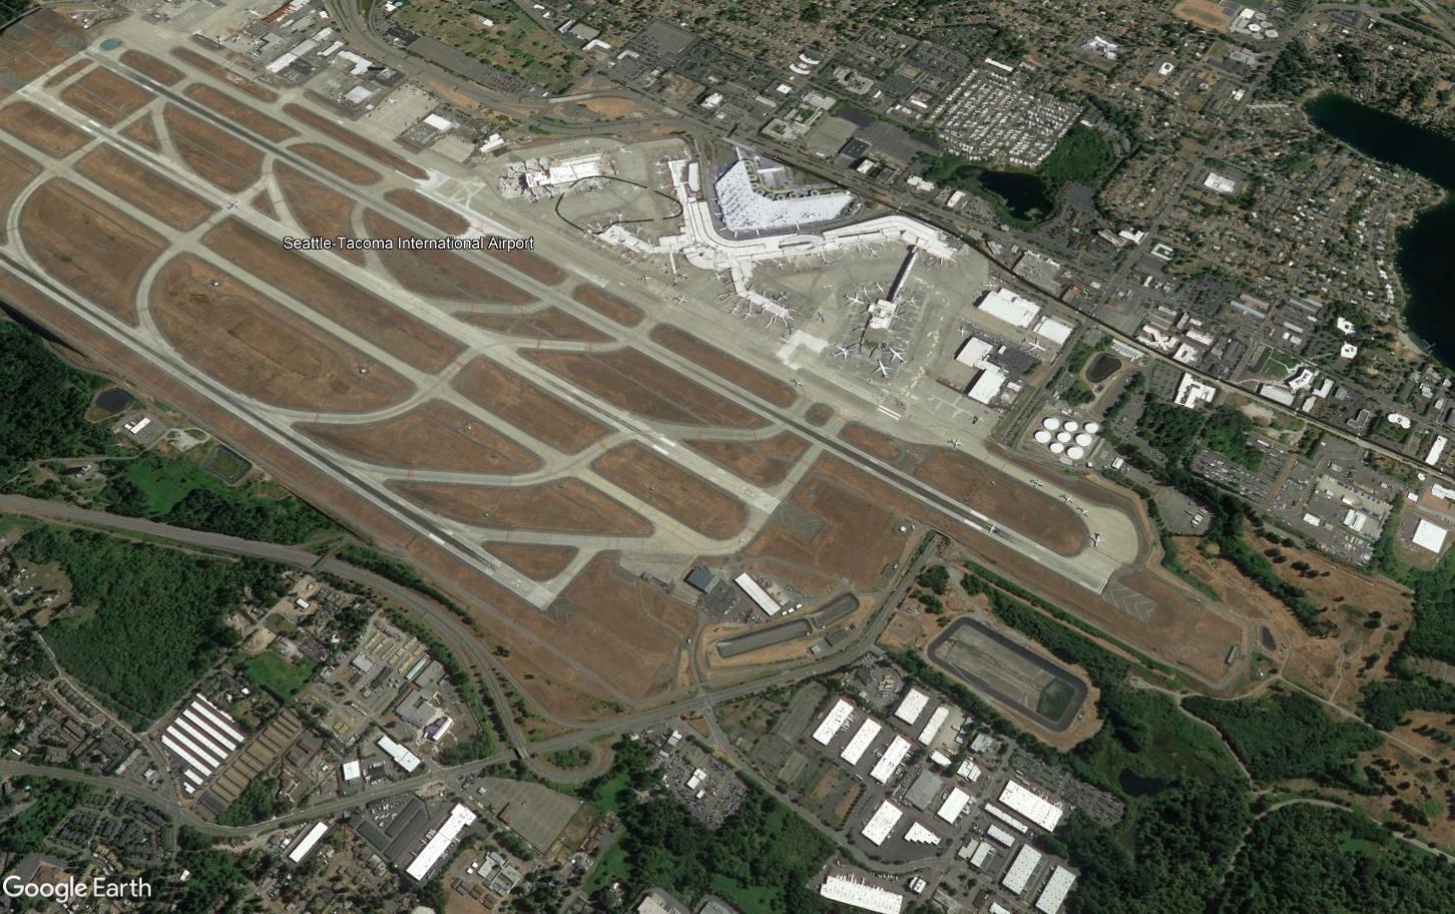
Sea-Tac Airport Satellite Overview — Three Parallel Runways and Terminal Complex
Google Earth satellite image of Seattle-Tacoma International Airport (Sea-Tac), showing the airport's three parallel runway system, terminal complex, concourses, and surrounding communities in SeaTac, Washington. The airport name label and Google Earth watermark are both visible in the image. -
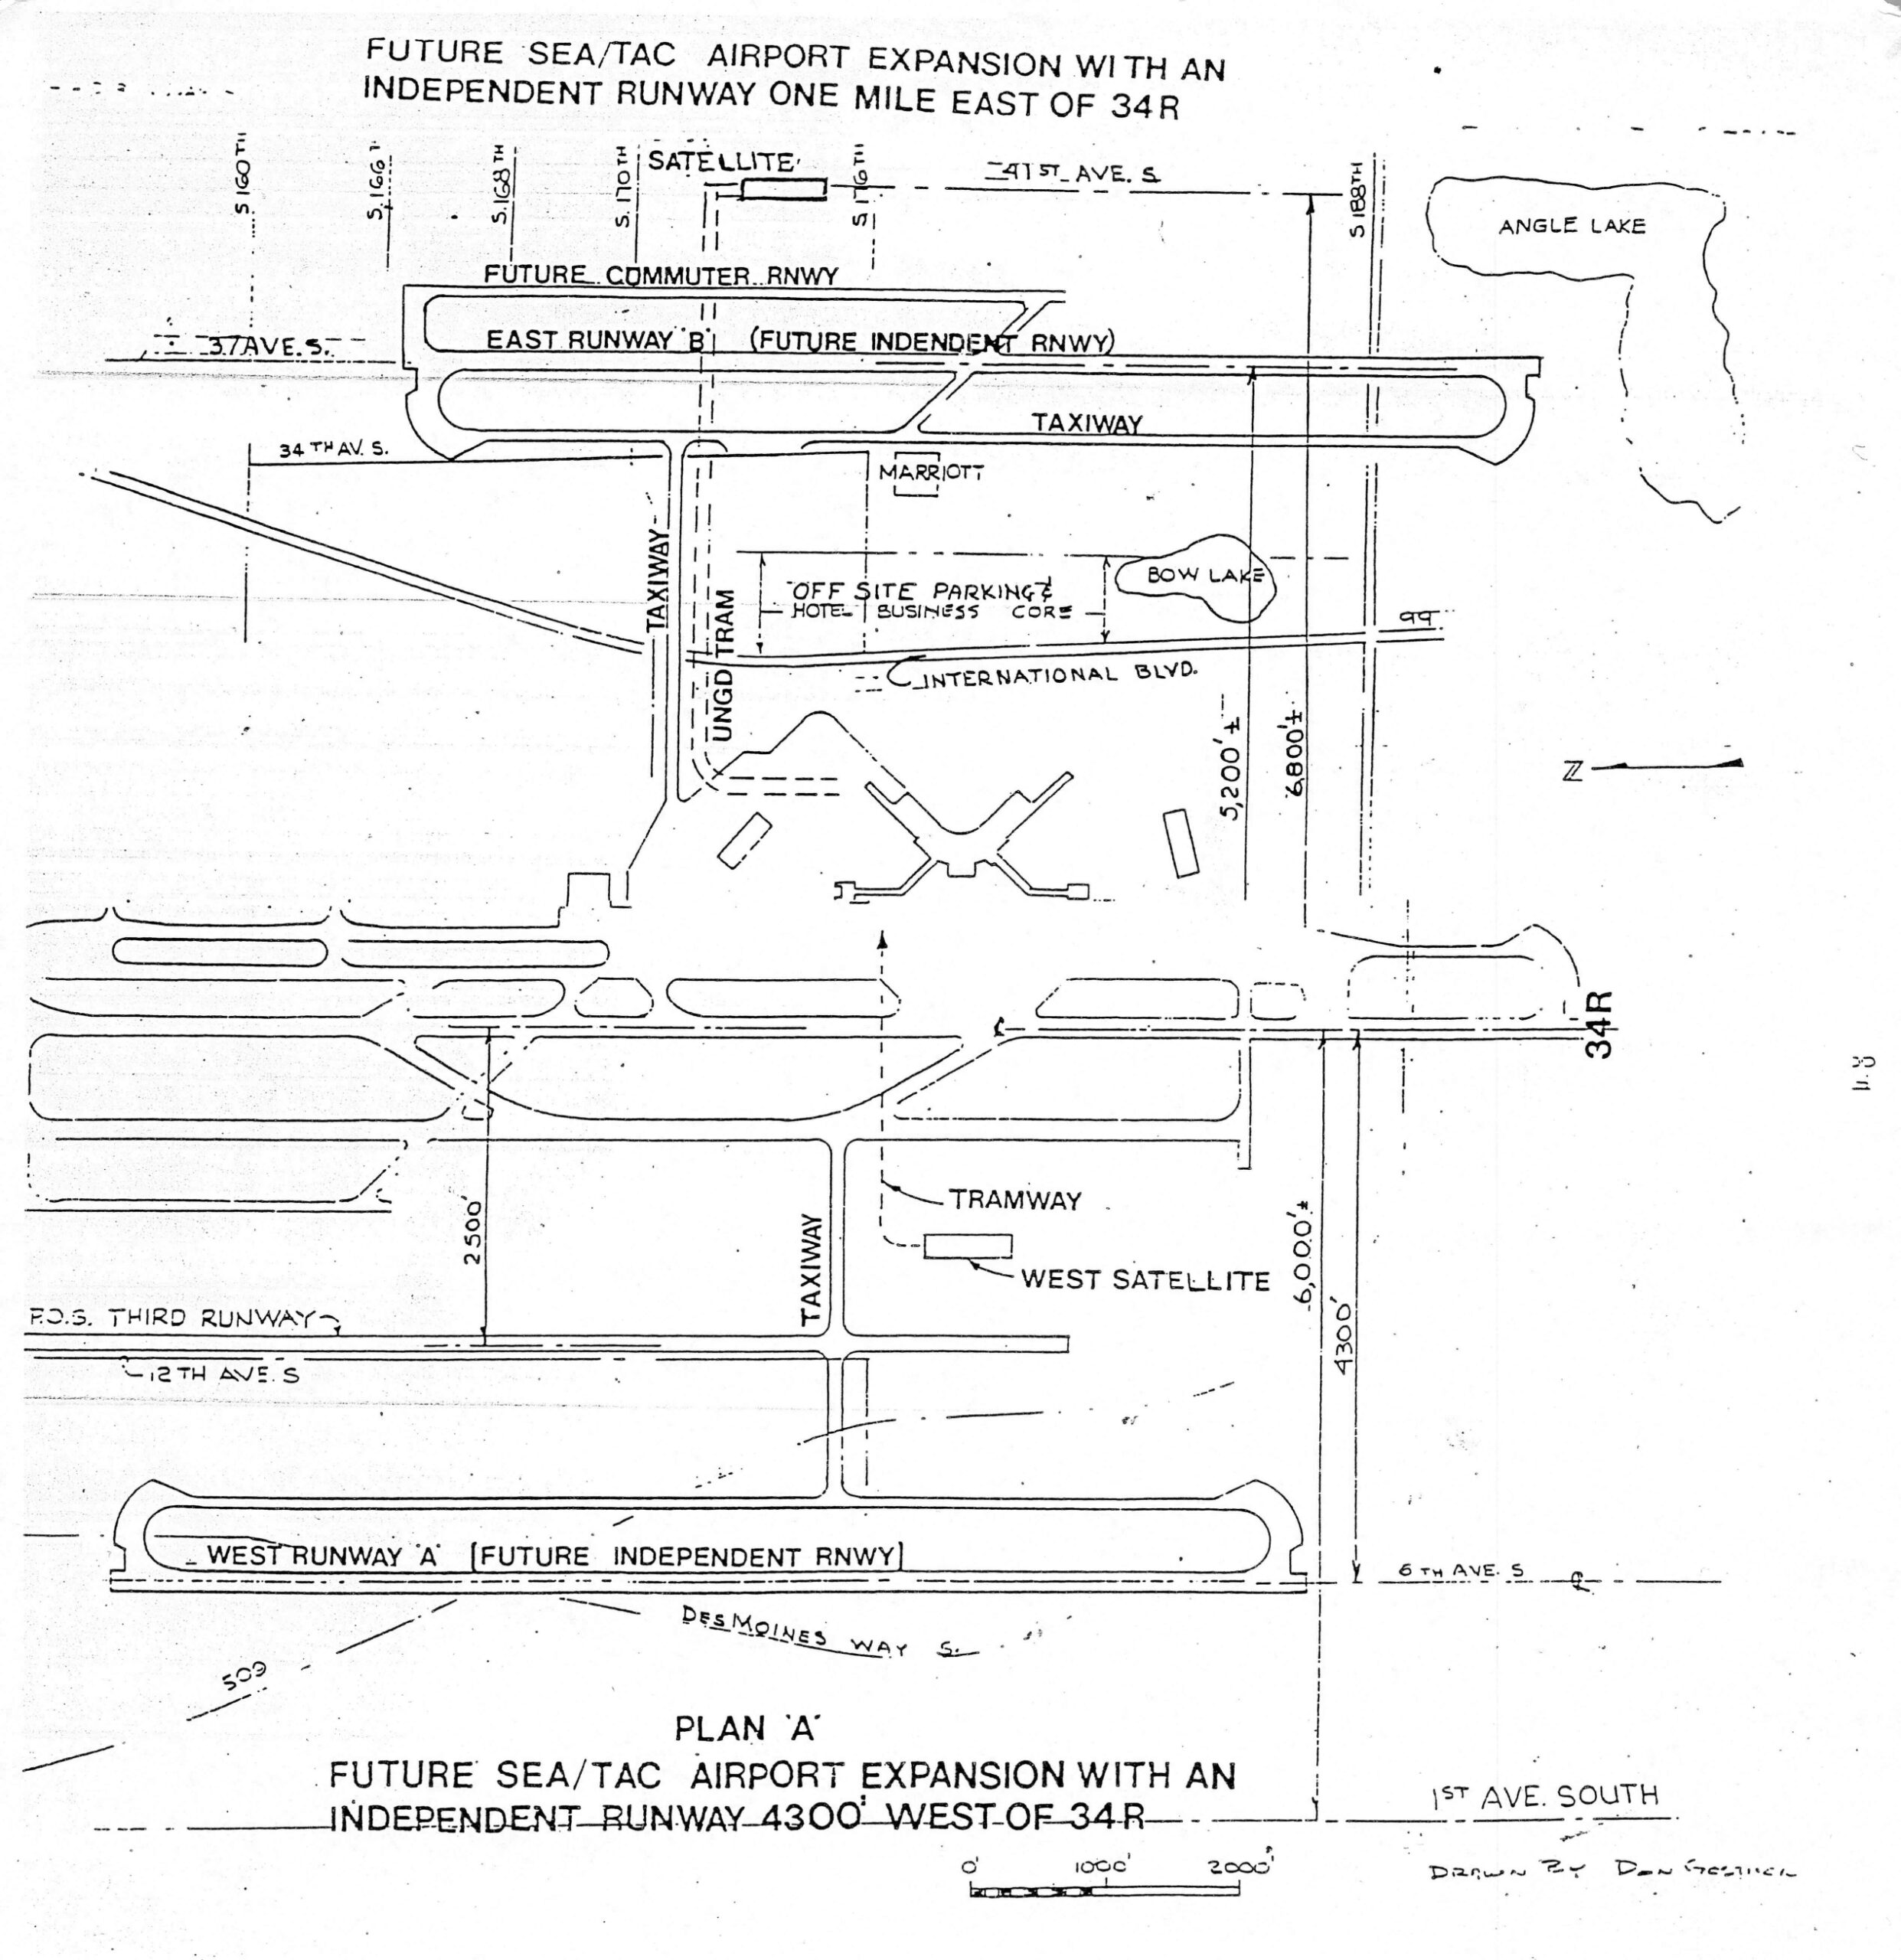
Future Sea-Tac Airport Expansion — Independent Runway Plans East (Runway B, 1 Mile) and West (Runway A, 4,300 ft) of 34R
Architectural/planning drawing titled 'Future Sea/Tac Airport Expansion with an Independent Runway One Mile East of 34R,' showing Plan A layout with an independent runway 4,300 feet west of runway 34R. The drawing, credited to Don Getsick, depicts proposed runways (East Runway B, West Runway A), taxiways, satellite terminals, tramway, underground tram, off-site parking/hotel/business core, and surrounding streets including International Blvd, Des Moines Way S, and 1st Ave South, with Angle Lake and Bow Lake visible.