TagMap(375)
-
18-120 DailyFTMbyFlow_Page_08
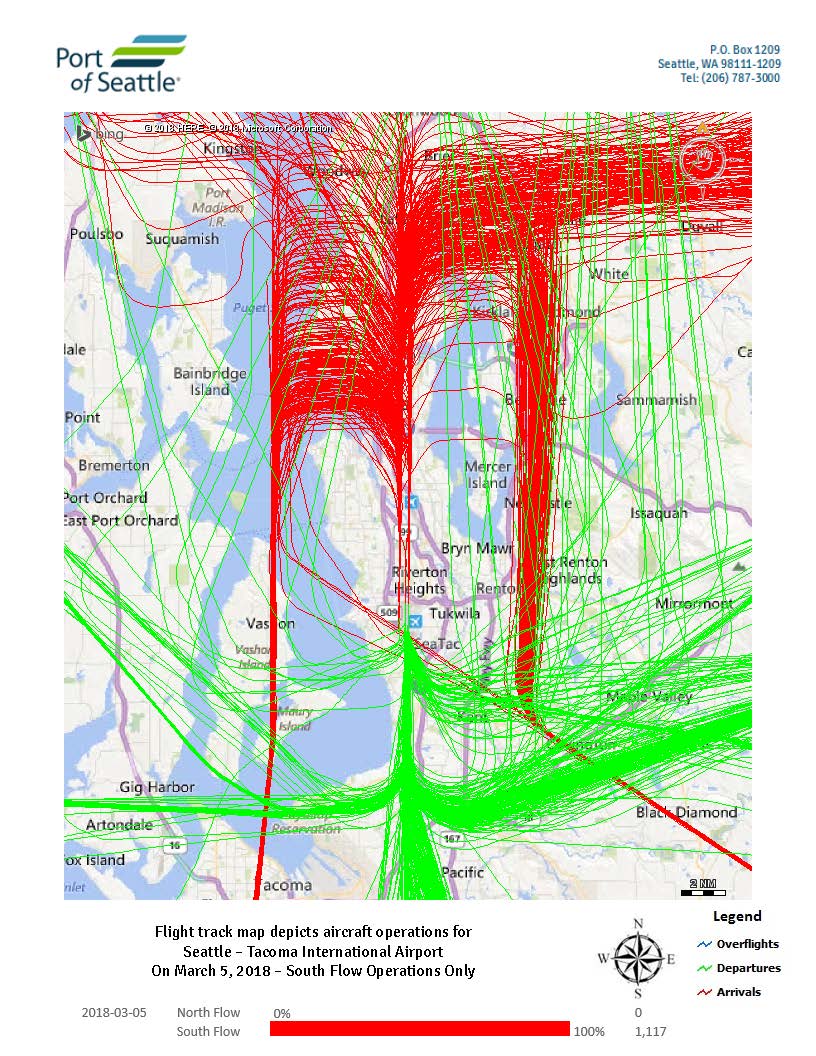
Flight track map produced by the Port of Seattle depicting all aircraft operations at Seattle-Tacoma International Airport on March 5, 2018, during South Flow operations only (1,117 total operations, 100% South Flow). The map shows arrival tracks in red and departure tracks in green overlaid on a Bing/HERE base map of the greater Seattle-Tacoma region. -
18-120 DailyFTMbyFlow_Page_13
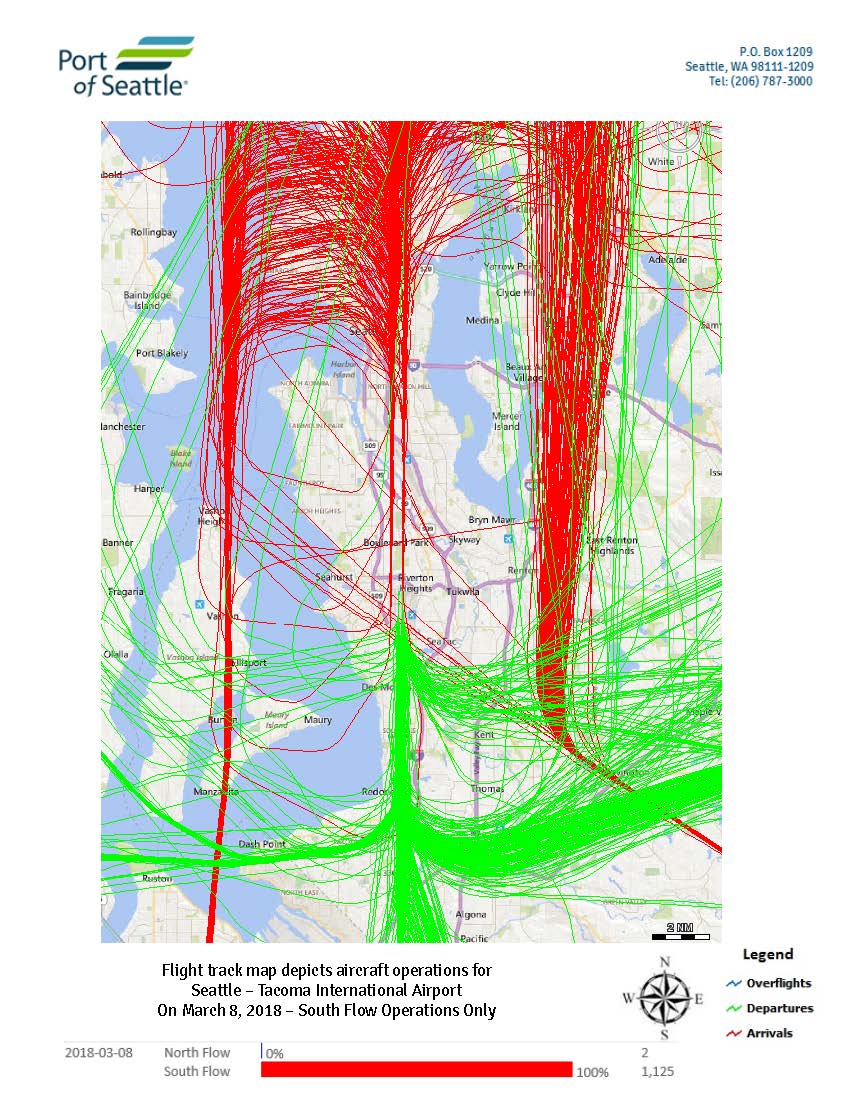
Flight track map produced by the Port of Seattle depicting aircraft operations at Seattle-Tacoma International Airport on March 8, 2018, showing South Flow Operations Only (100%, 1,125 operations) with zero North Flow operations. The map distinguishes arrivals (red), departures (green), and overflights (blue) over the greater Seattle-Tacoma area. -
18-120 DailyFTMbyFlow_Page_12
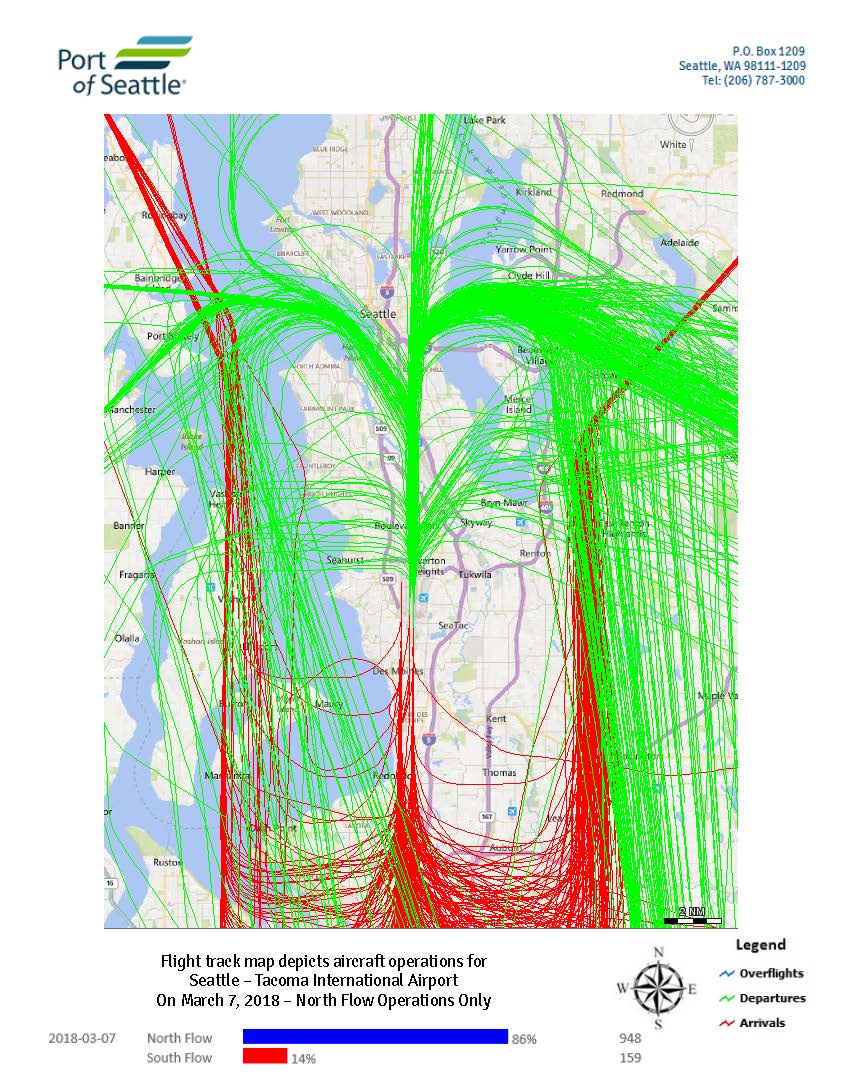
Port of Seattle flight track map depicting aircraft operations at Seattle-Tacoma International Airport on March 7, 2018, showing North Flow Operations only. Green lines indicate departures, red lines indicate arrivals, and blue lines indicate overflights; North Flow accounted for 86% of operations (948 flights) and South Flow 14% (159 flights). -
KSEA Noise Complaints by Zip Code April 2020
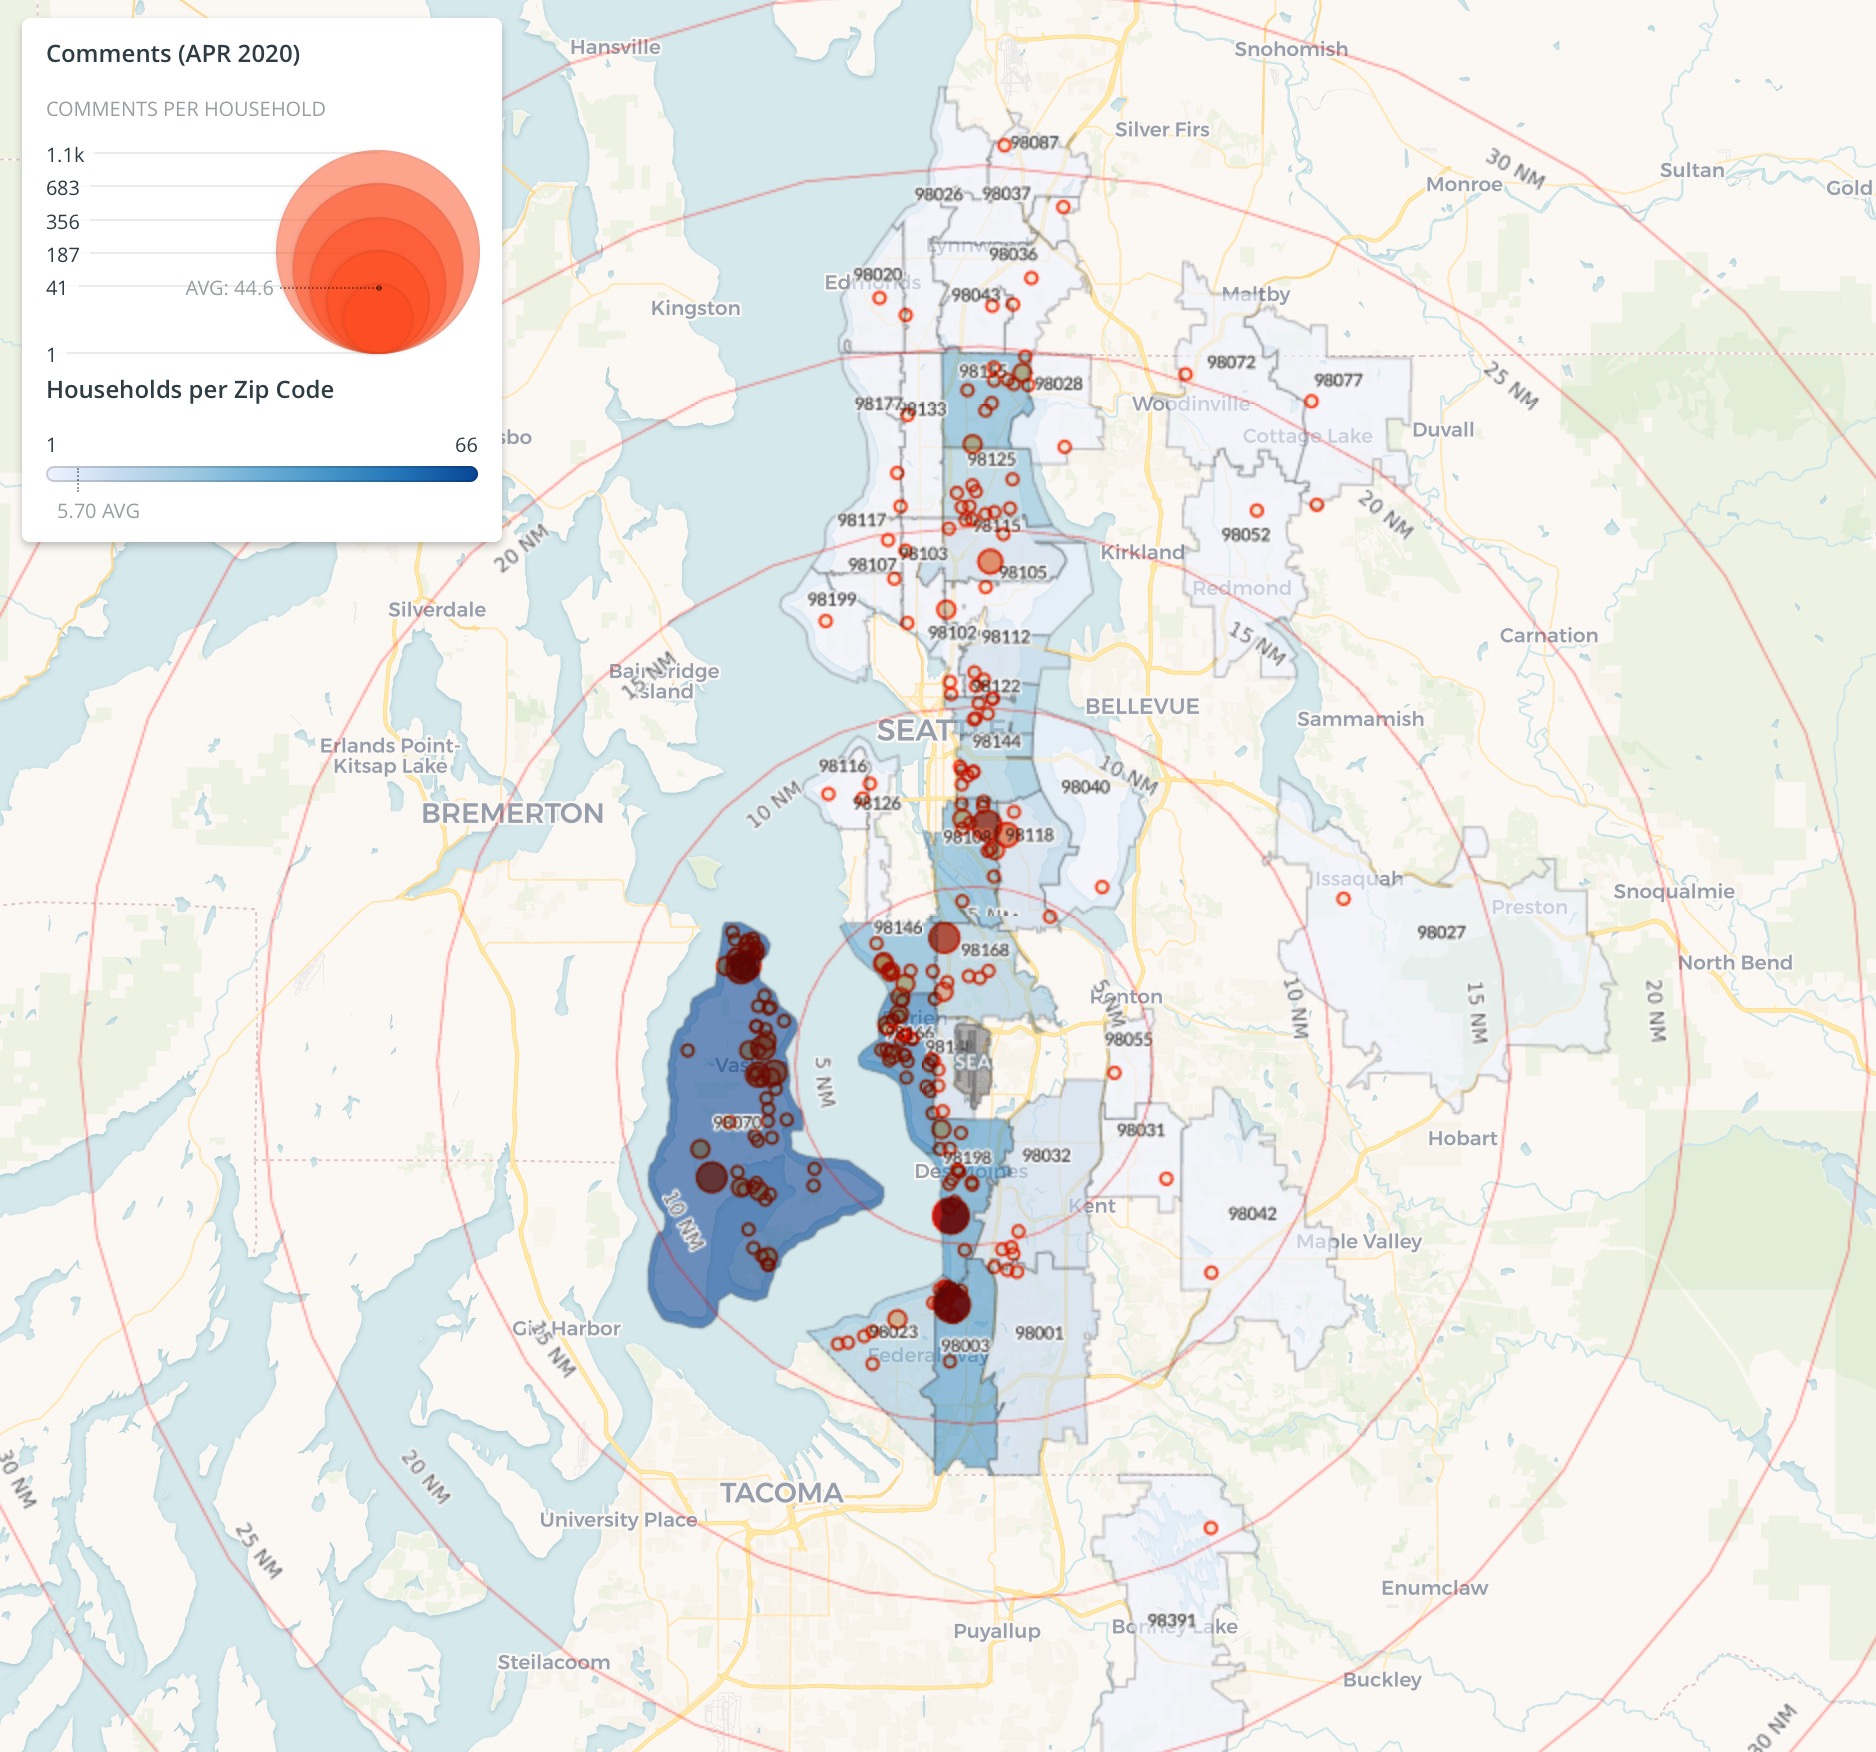
A geographic visualization mapping public comments received in April 2020 regarding Sea-Tac Airport noise, displayed as proportional circles (comments per household) overlaid on ZIP code boundaries across the Seattle-Tacoma metropolitan area. Concentric red rings indicate nautical-mile distances from Sea-Tac Airport, and a blue choropleth layer shows households per ZIP code, with an average of 5.70 households and comment rates averaging 44.6 per household. -
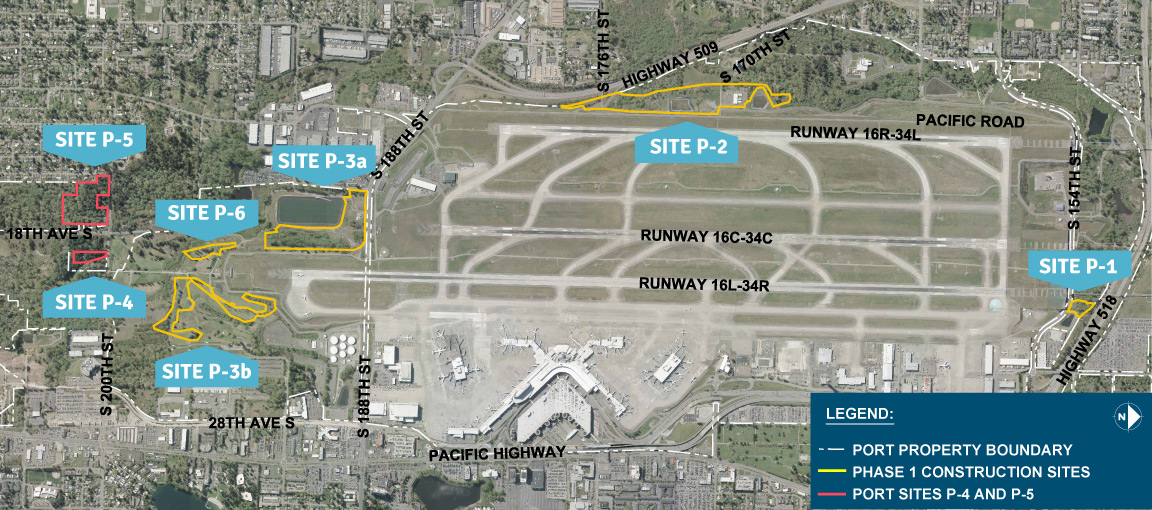
Sea-Tac Airport Vicinity Map With Phase 1 Construction and Port Sites
Aerial map of Seattle-Tacoma International Airport identifying labeled construction and port sites (P-1 through P-6, including P-3a and P-3b) with Phase 1 Construction Sites outlined in yellow and Port Sites P-4 and P-5 outlined in red. The map shows three parallel runways (16R-34L, 16C-34C, 16L-34R), surrounding roads including Highway 509, Highway 518, and Pacific Highway, and the Port Property Boundary marked with a dashed white line. -
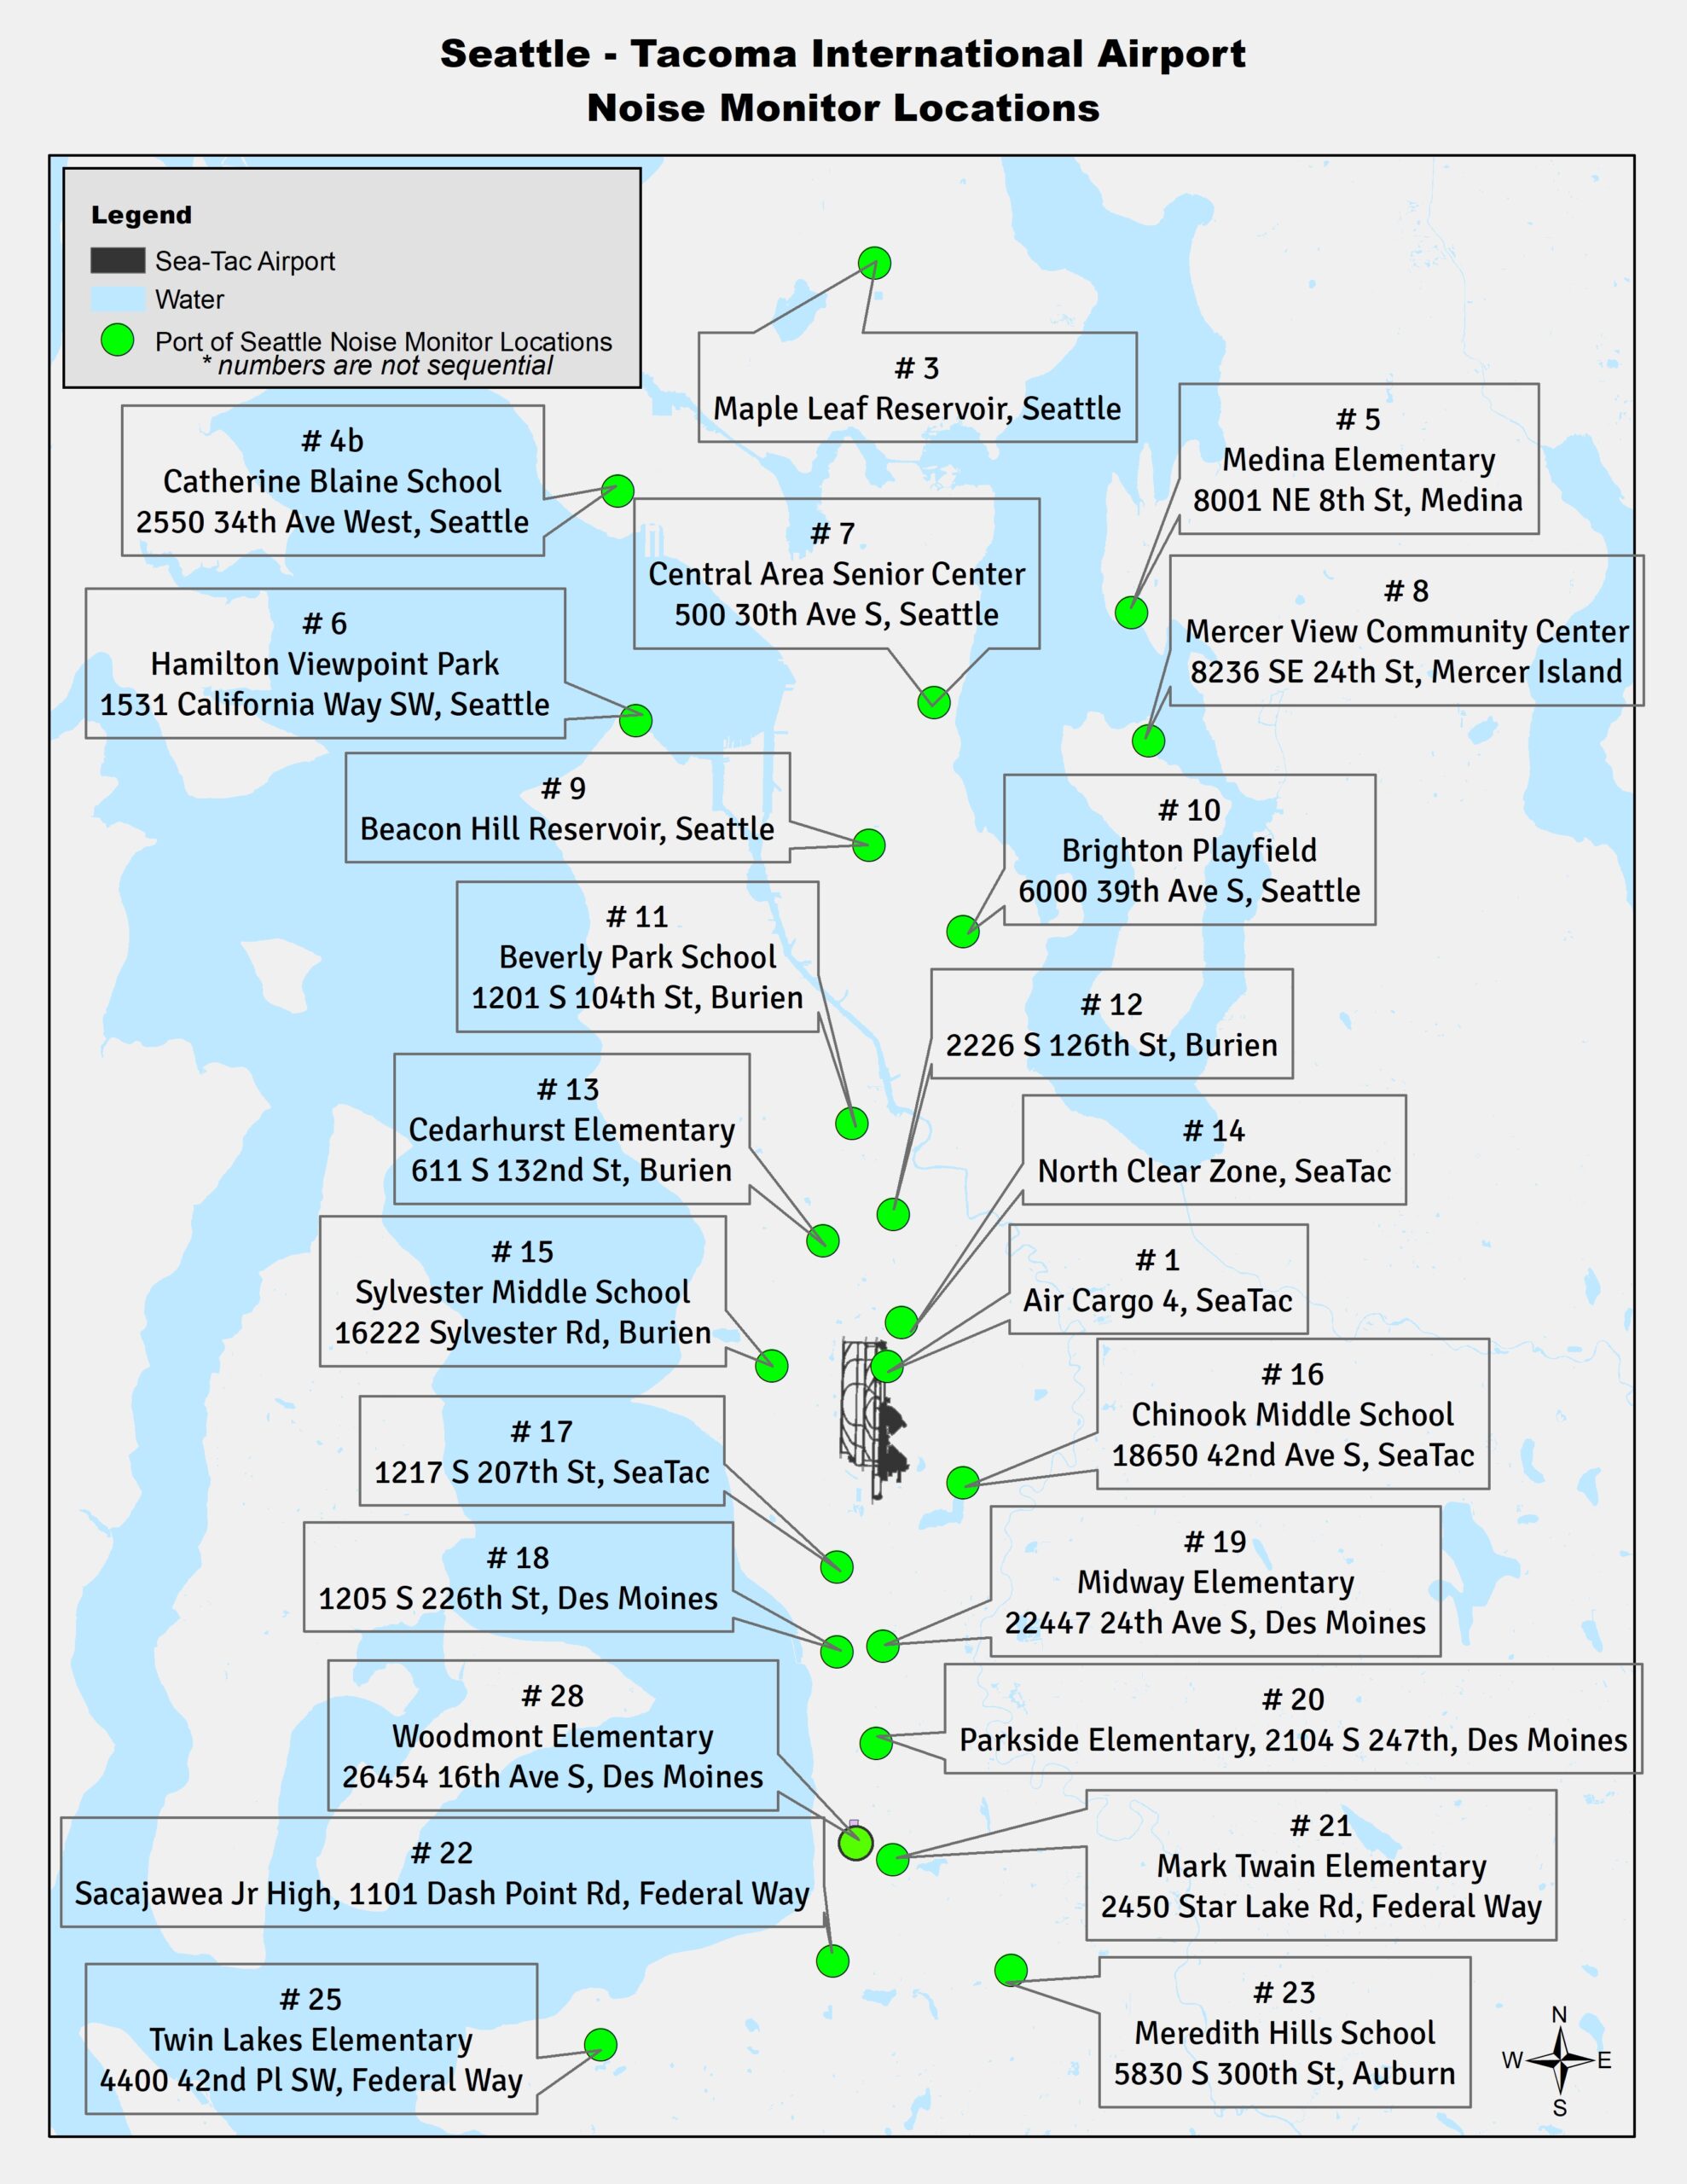
Permanent Noise Monitor Locations as of 2020
A map published by the Port of Seattle showing the locations of 25 noise monitoring stations surrounding Seattle-Tacoma International Airport (Sea-Tac). Monitoring sites span multiple communities including Seattle, Burien, SeaTac, Des Moines, Federal Way, Medina, Mercer Island, and Auburn, with each location identified by a number and street address. -
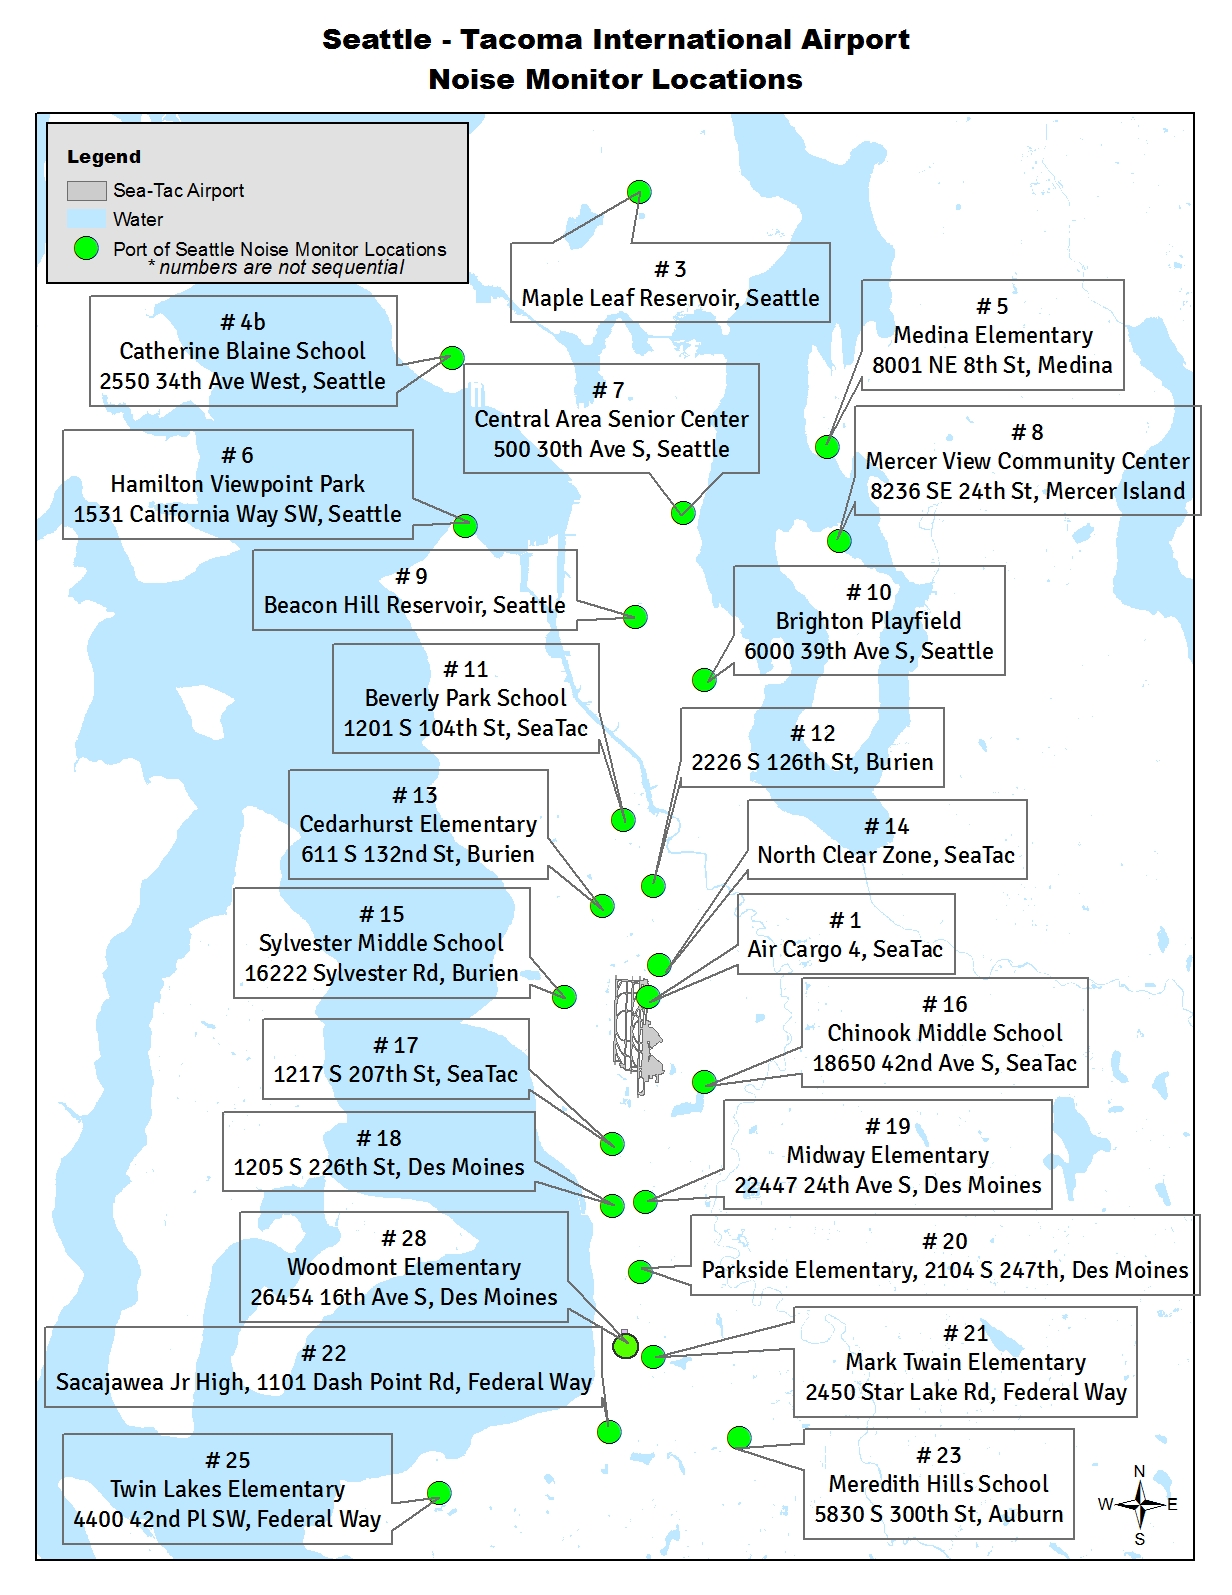
NMT locations as of 2018
A map published by the Port of Seattle showing the locations of 25 numbered noise monitoring stations surrounding Seattle-Tacoma International Airport (Sea-Tac). Monitoring sites span communities including Seattle, Burien, SeaTac, Des Moines, Mercer Island, Medina, Federal Way, and Auburn, with specific addresses provided for each location. -
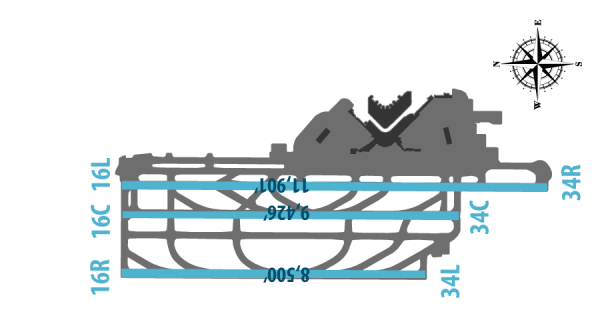
Sea-Tac Airport Three Parallel Runway Diagram
Aerial diagram of Seattle-Tacoma International Airport (Sea-Tac) showing three parallel runway pairs labeled 16L/34R, 16C/34C, and 16R/34L, with runway lengths annotated: 11,901', 9,426', and 8,500' respectively. A compass rose is visible in the upper right corner. -
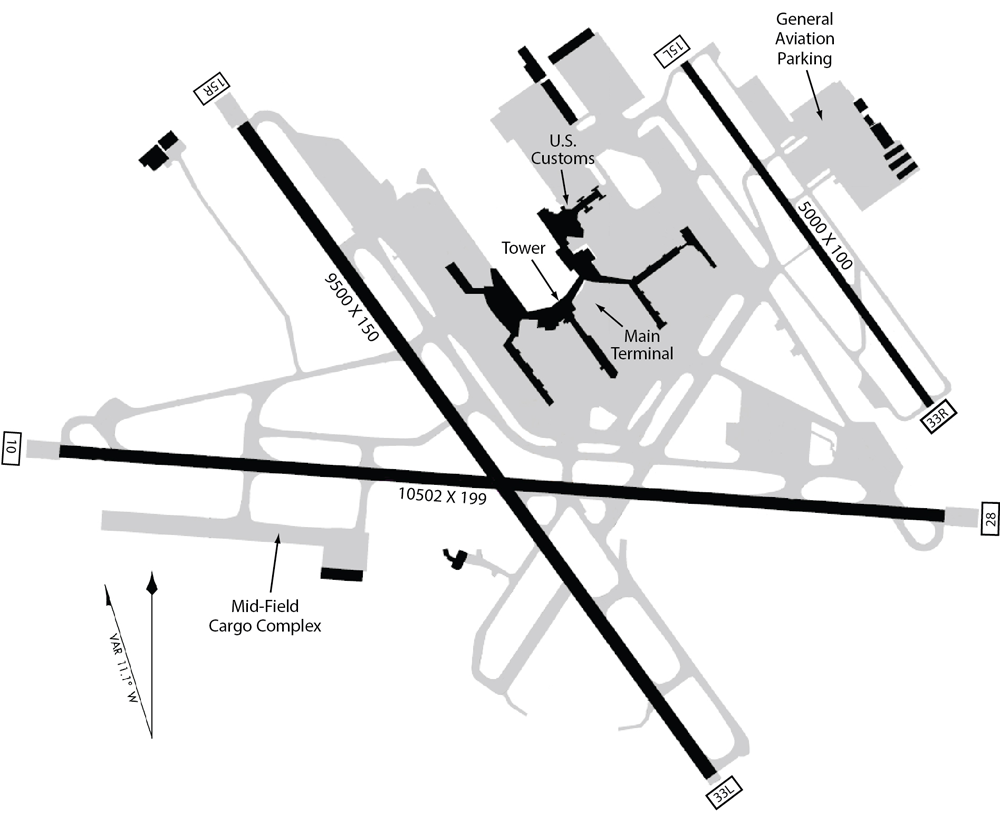
Airport Runway Layout Diagram (For Illustration Purposes Only) — Terminal, Tower, Customs, and Mid-Field Cargo Complex
This is an airport diagram showing multiple runways including one labeled 10502 x 199 feet and another 9500 x 150 feet, with facilities marked including a Main Terminal, U.S. Customs, Tower, Mid-Field Cargo Complex, and General Aviation Parking. Runway end identifiers visible include 10, 28, 15R, 33L, 33R, and 75L, consistent with a large international airport layout, though no airport name or ICAO/IATA code is explicitly shown. -
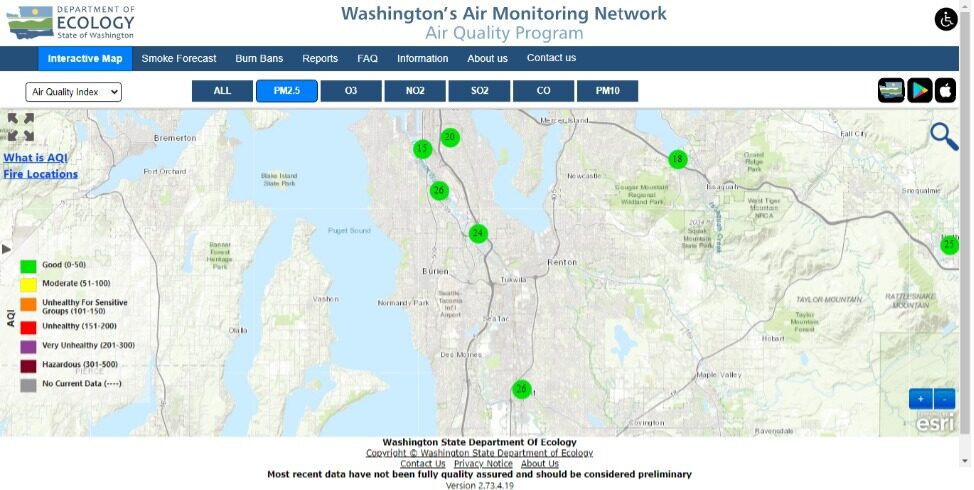
Washington State Department of Ecology – Air Quality Index Map, Seattle/Sea-Tac Region
Screenshot of Washington's Air Monitoring Network interactive map (Air Quality Program, WDOE, version 2.73.4.19) showing PM2.5 Air Quality Index readings across the greater Seattle–Sea-Tac–Puget Sound area. All visible monitoring stations display green indicators (Good, AQI 0–50).