TagMap(375)
-
 2022-12-02
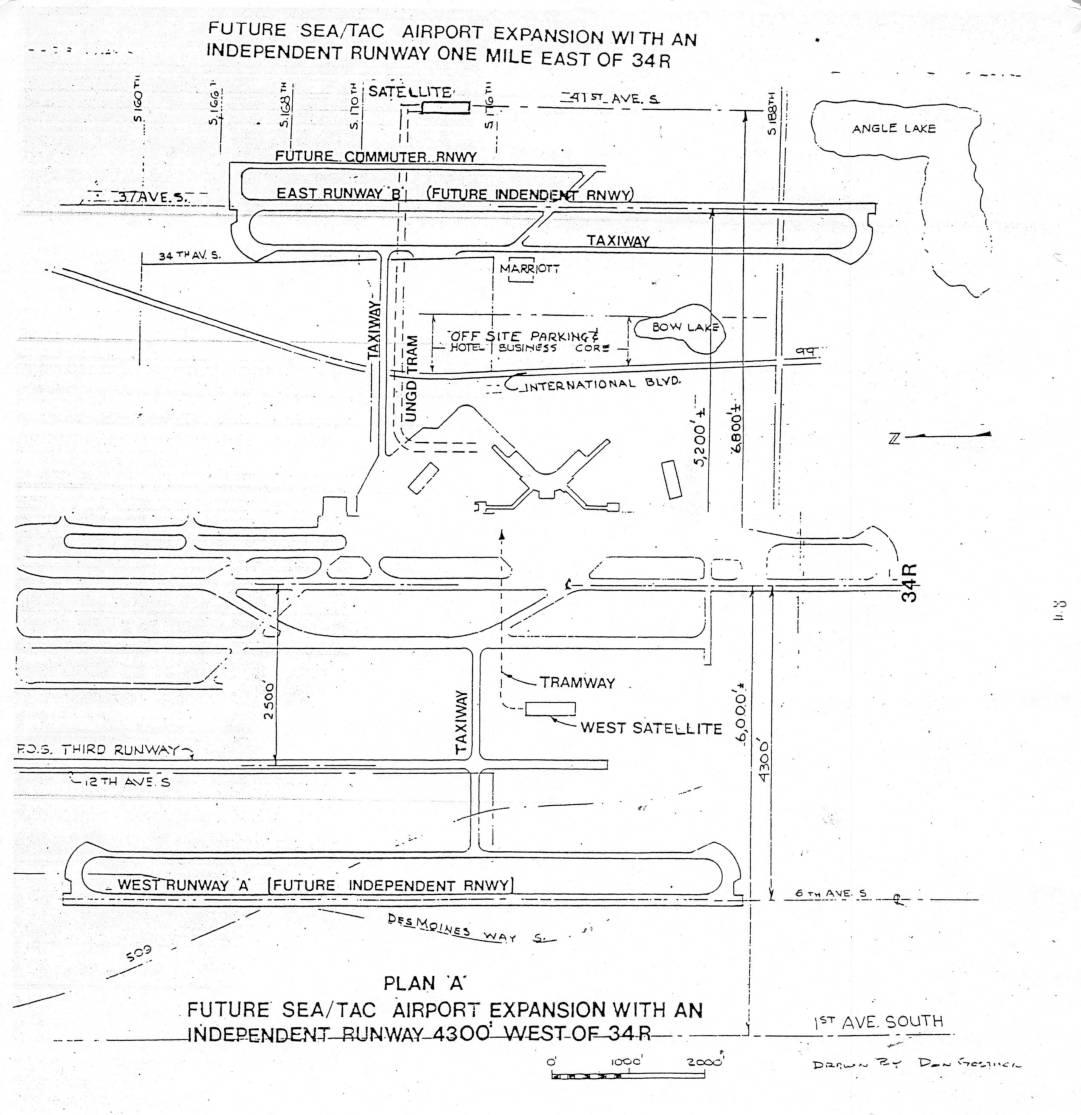
Future Sea-Tac Airport Expansion — Independent Runway Plans East (Runway B, 1 Mile) and West (Runway A, 4,300 ft) of 34R
This document presents two conceptual expansion plans for Seattle-Tacoma (Sea-Tac) Airport, showing proposed future runway configurations including an independent runway located one mile east of runway 34R (Plan A shows an alternative 4,300 feet west of 34R). The drawings detail proposed taxiways, satellite terminals, a future commuter runway, an underground tram system, and associated ground infrastructure such as off-site parking and hotel/business core areas. These plans were likely developed as part of noise and capacity planning studies to evaluate how additional independent runways could affect surrounding communities, including areas near Angle Lake, Bow Lake, and along key corridors such as International Boulevard and Des Moines Way South. -
-
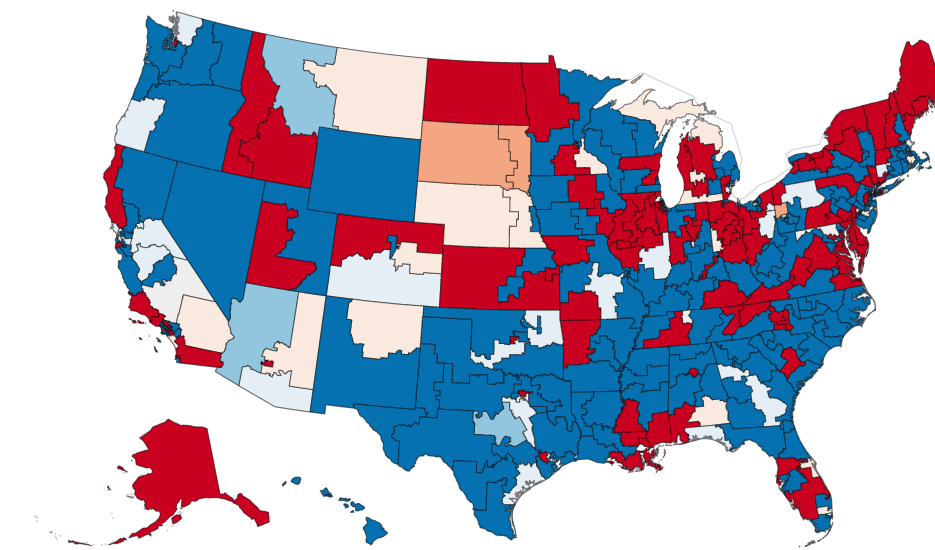
Choropleth Map of US Congressional Districts or Counties Shaded by Likely Party Affiliation
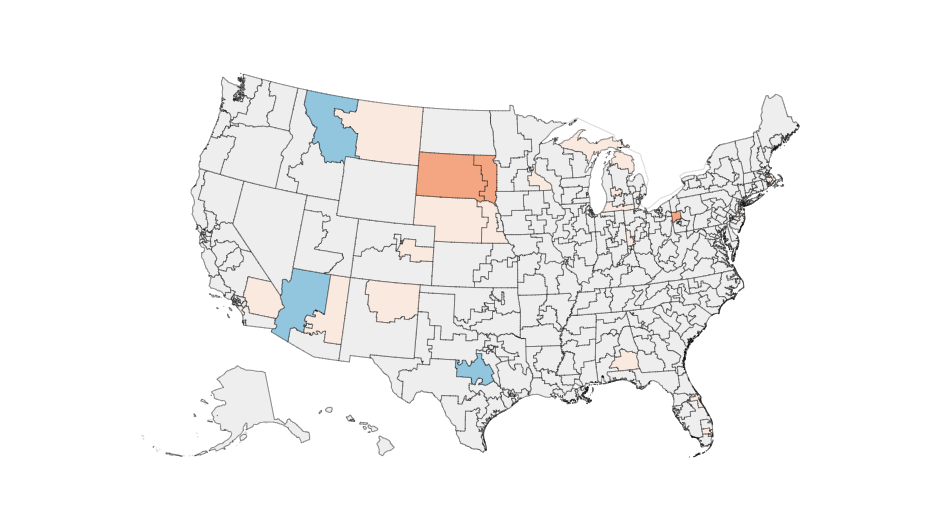
A choropleth map of the contiguous United States plus Alaska and Hawaii showing congressional districts or counties shaded in red and blue, likely indicating Republican and Democratic party affiliation or election results. No title, date, or legend text is visible in the image. -
U.S. County-Level Vote Map With Regional Highlights
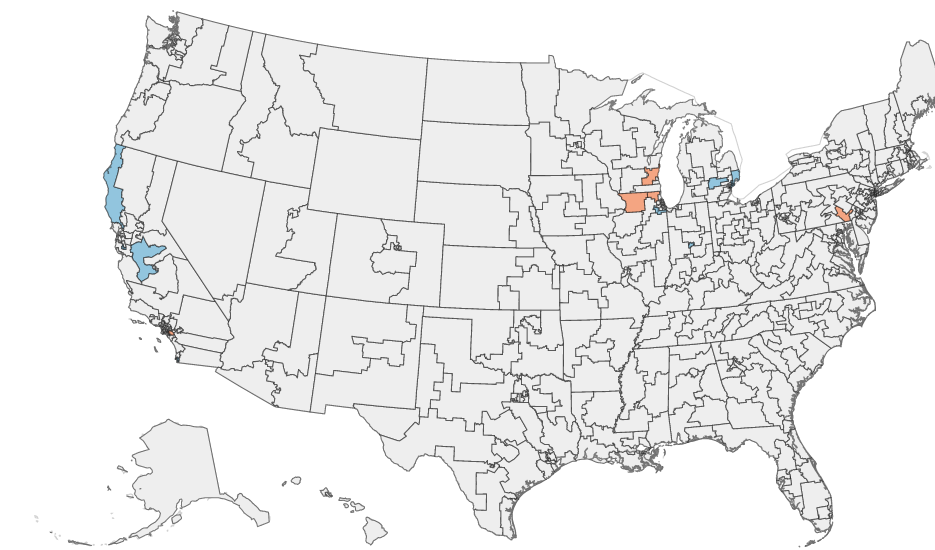
A map of the contiguous United States displaying county or district boundaries, with select areas highlighted in blue (primarily in California and the Pacific Northwest) and orange/red (primarily in the mid-Atlantic region, including areas around Maryland/Virginia). No labels, title, or legend are visible to identify the specific data being represented. -
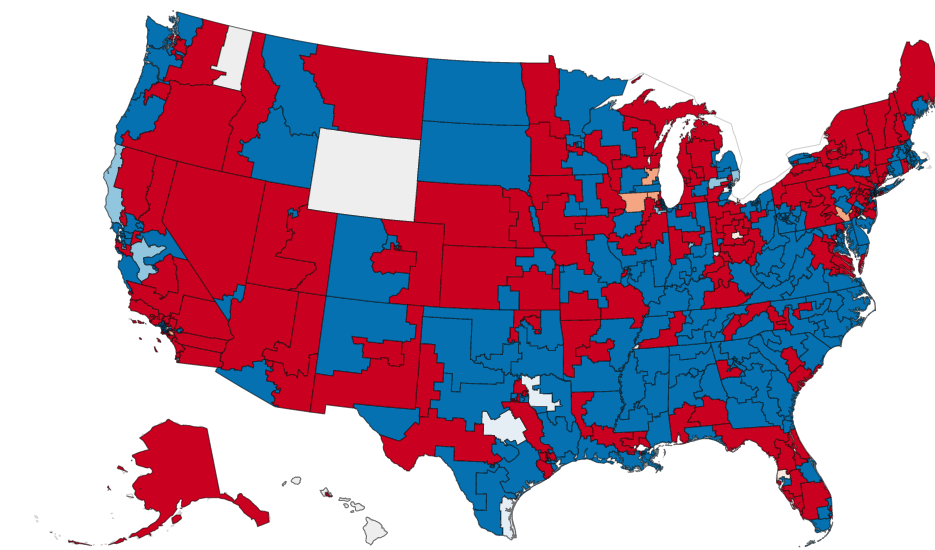
US Choropleth Map Likely Showing Election Results or Party Affiliation by District
A choropleth map of the United States showing districts or counties colored in red and blue, likely representing Republican and Democratic party affiliations or election results. One state (Wyoming) appears white/uncolored, and a small area near the Great Lakes is shaded in a neutral orange-tan color, possibly indicating a third-party result or missing data. -
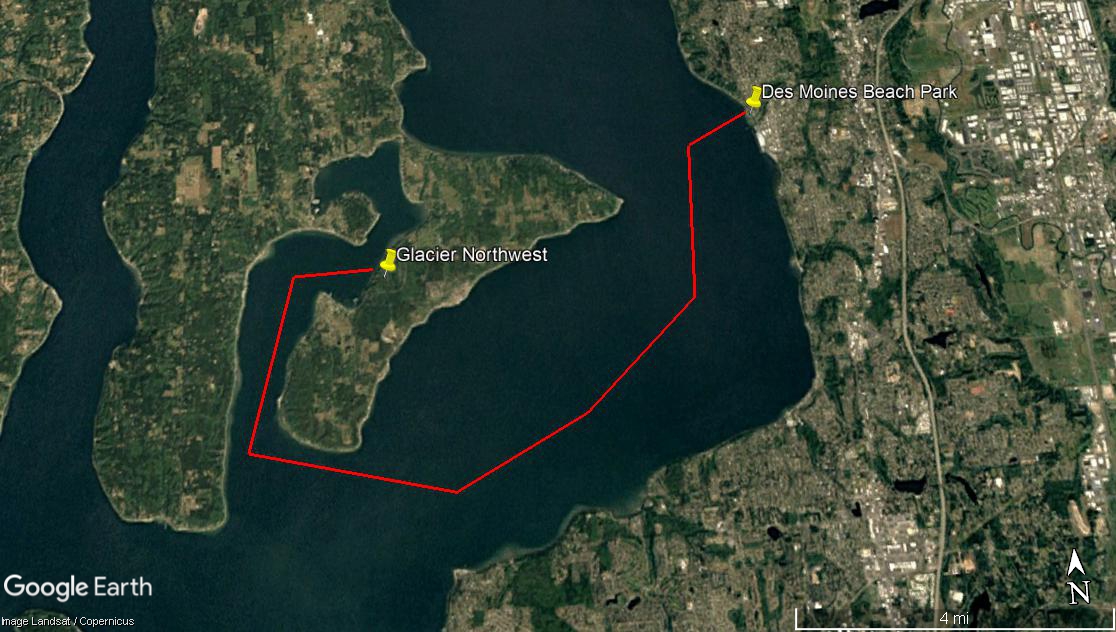
Maury Island Barge Path to Des Moines Beach Park
A Google Earth satellite image (Landsat/Copernicus imagery) showing a red polygon outlining an area of Puget Sound near Vashon Island, with yellow pins marking Glacier Northwest and Des Moines Beach Park. The map covers approximately 4 miles of water between what appears to be a peninsula near Glacier Northwest's facility and the Des Moines, Washington shoreline. -
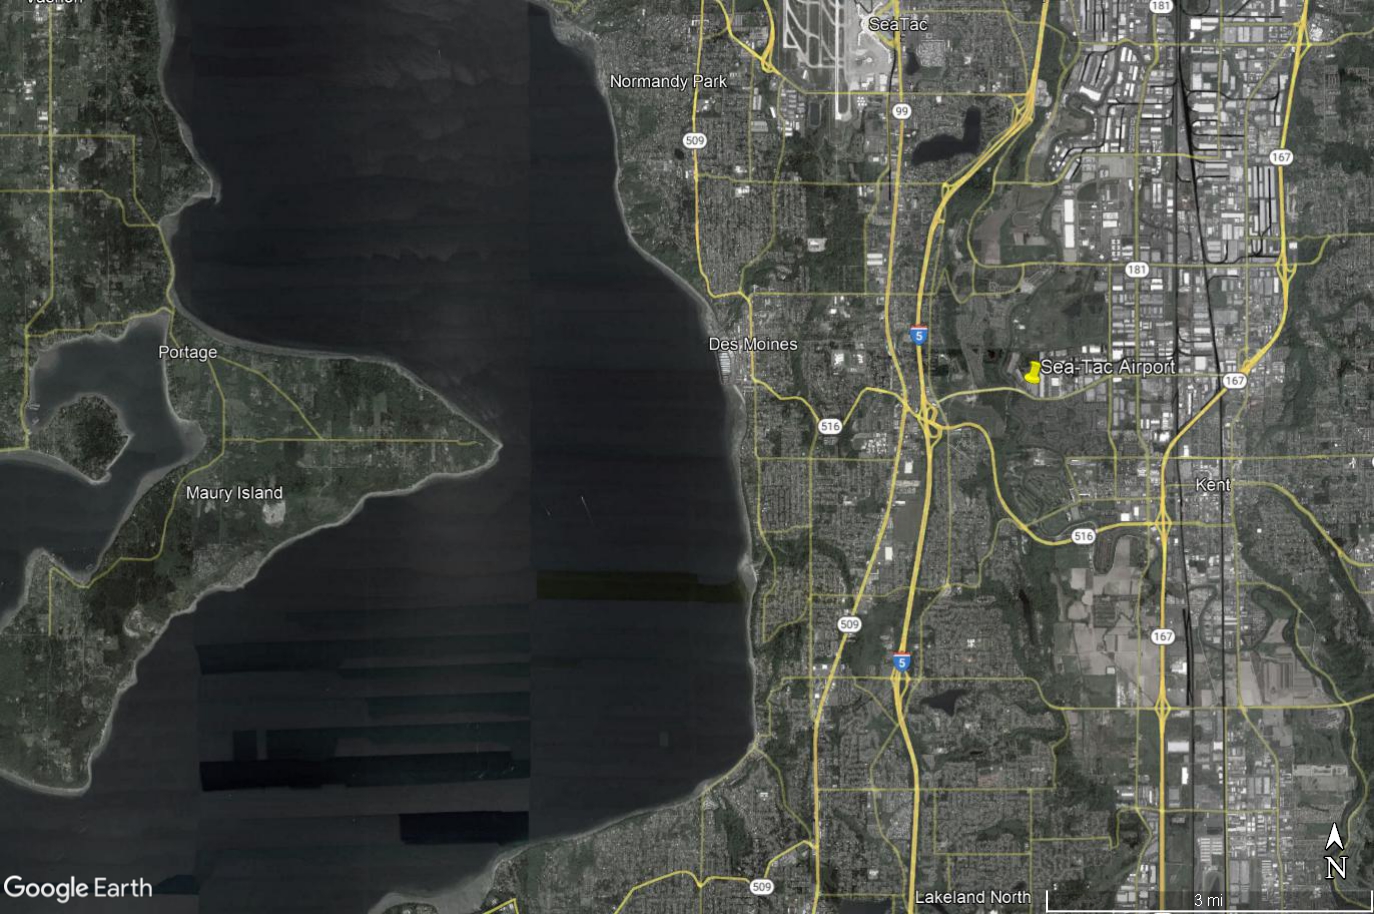
Google Earth Aerial View: Sea-Tac Airport to Maury Island and Des Moines Beach Noise-Impact Study Area
Google Earth aerial/satellite image showing Seattle-Tacoma International Airport (Sea-Tac) and surrounding communities including Des Moines, Normandy Park, Kent, Maury Island, and Portage, with Interstate 5, SR-509, SR-516, and SR-167 visible. The image includes a yellow pin marker at Sea-Tac Airport and covers the broader noise-impact study area west of Puget Sound to east of the airport corridor. -
 2022-09-12
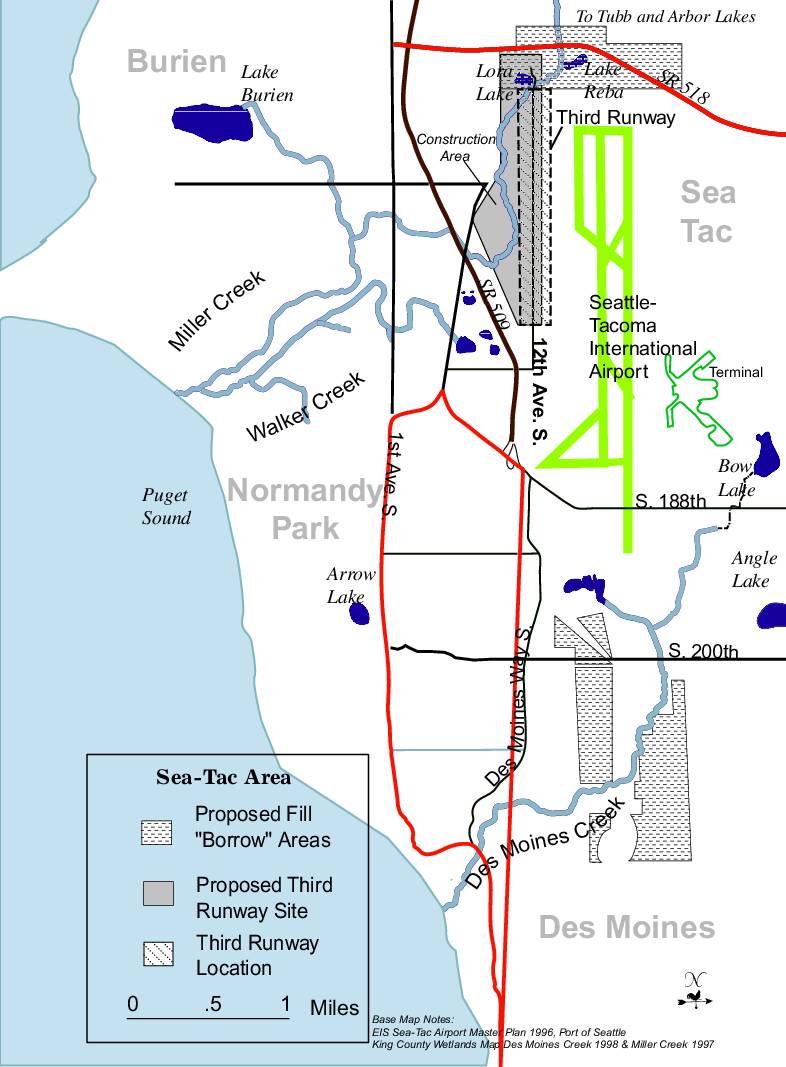
Sea-Tac area third runway construction map
This map document illustrates the planned Third Runway expansion at Seattle-Tacoma International Airport, showing the proposed runway location, construction staging area, and fill 'borrow' areas in the Sea-Tac region. The map covers surrounding communities including Burien, Normandy Park, and Des Moines, and highlights nearby waterways such as Des Moines Creek, Miller Creek, and Walker Creek that could be affected by construction. Based on the 1996 Port of Seattle EIS Sea-Tac Airport Master Plan and 1997–1998 King County Wetlands Maps, the document provides geographic context for environmental and land-use planning related to the runway project. -
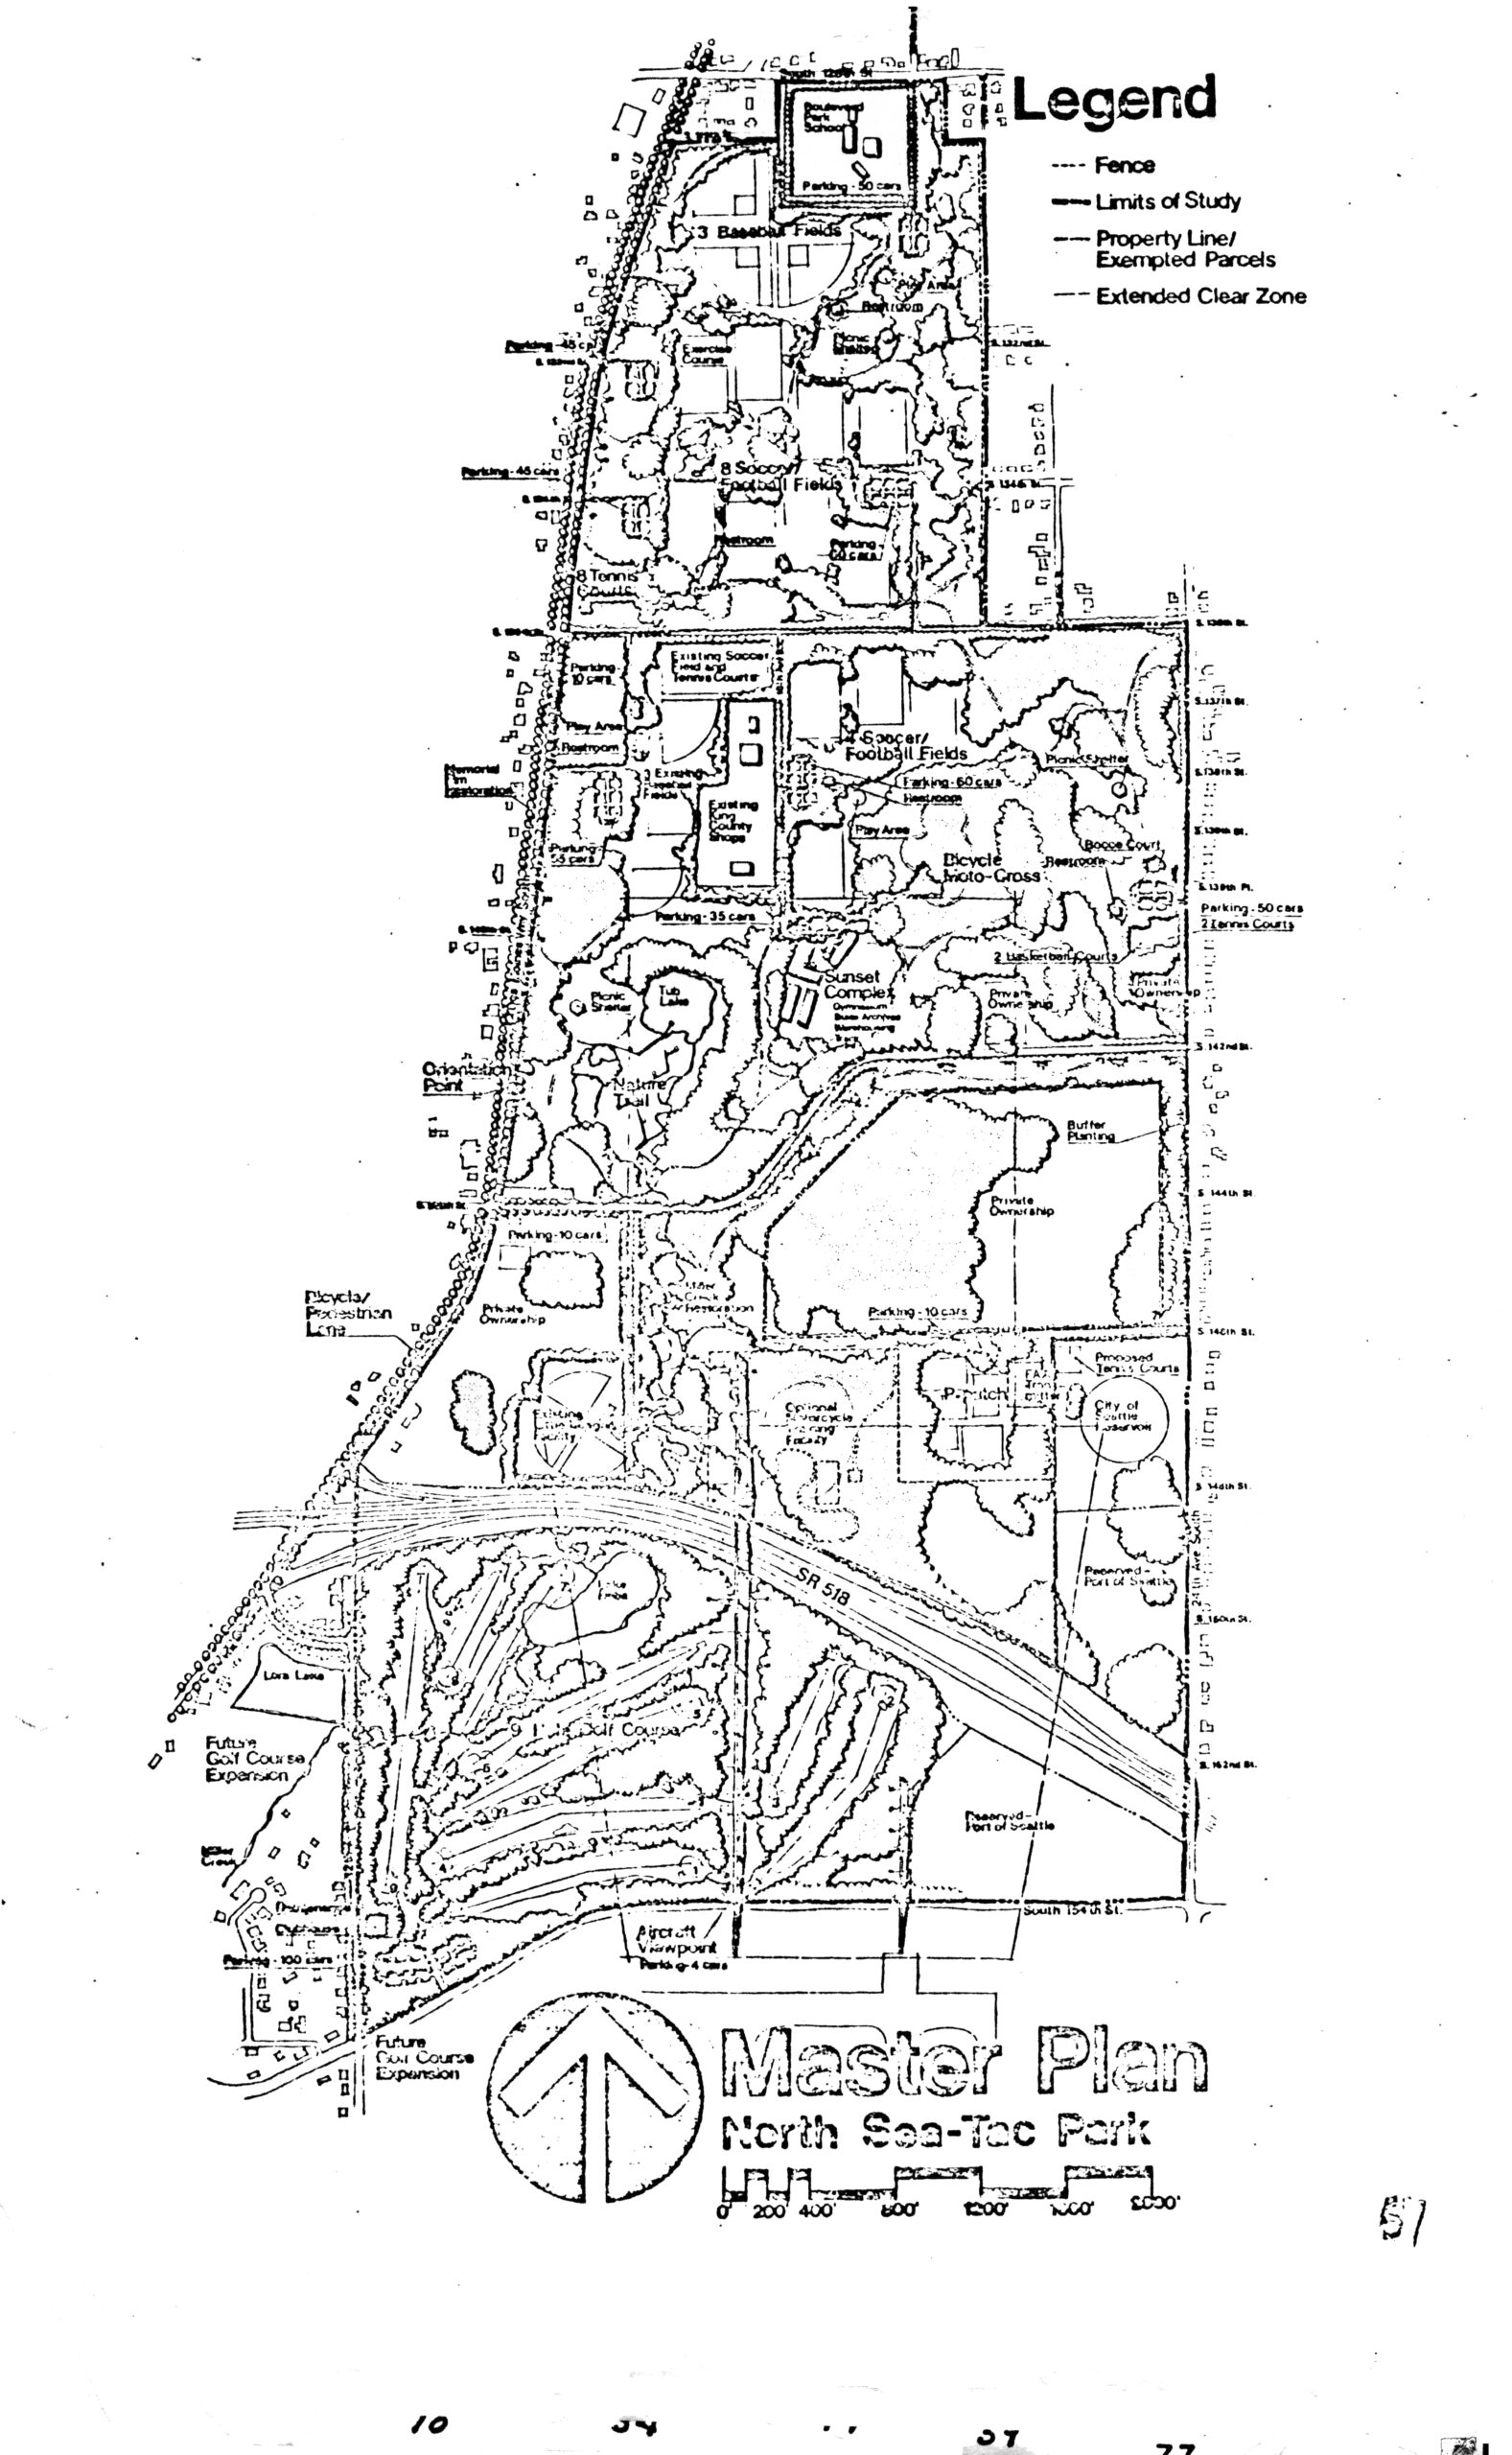
North Sea-Tac Park Master Plan (v51) hi-res
A master plan map of North Sea-Tac Park showing proposed recreational facilities including baseball fields, soccer/football fields, tennis courts, a golf course, bicycle/motocross area, Sunset Complex, and an Aircraft Viewpoint. The map includes a legend distinguishing fences, limits of study, property lines/exempted parcels, and extended clear zones, with SR 518 bisecting the lower portion of the park. -
 2022-08-28
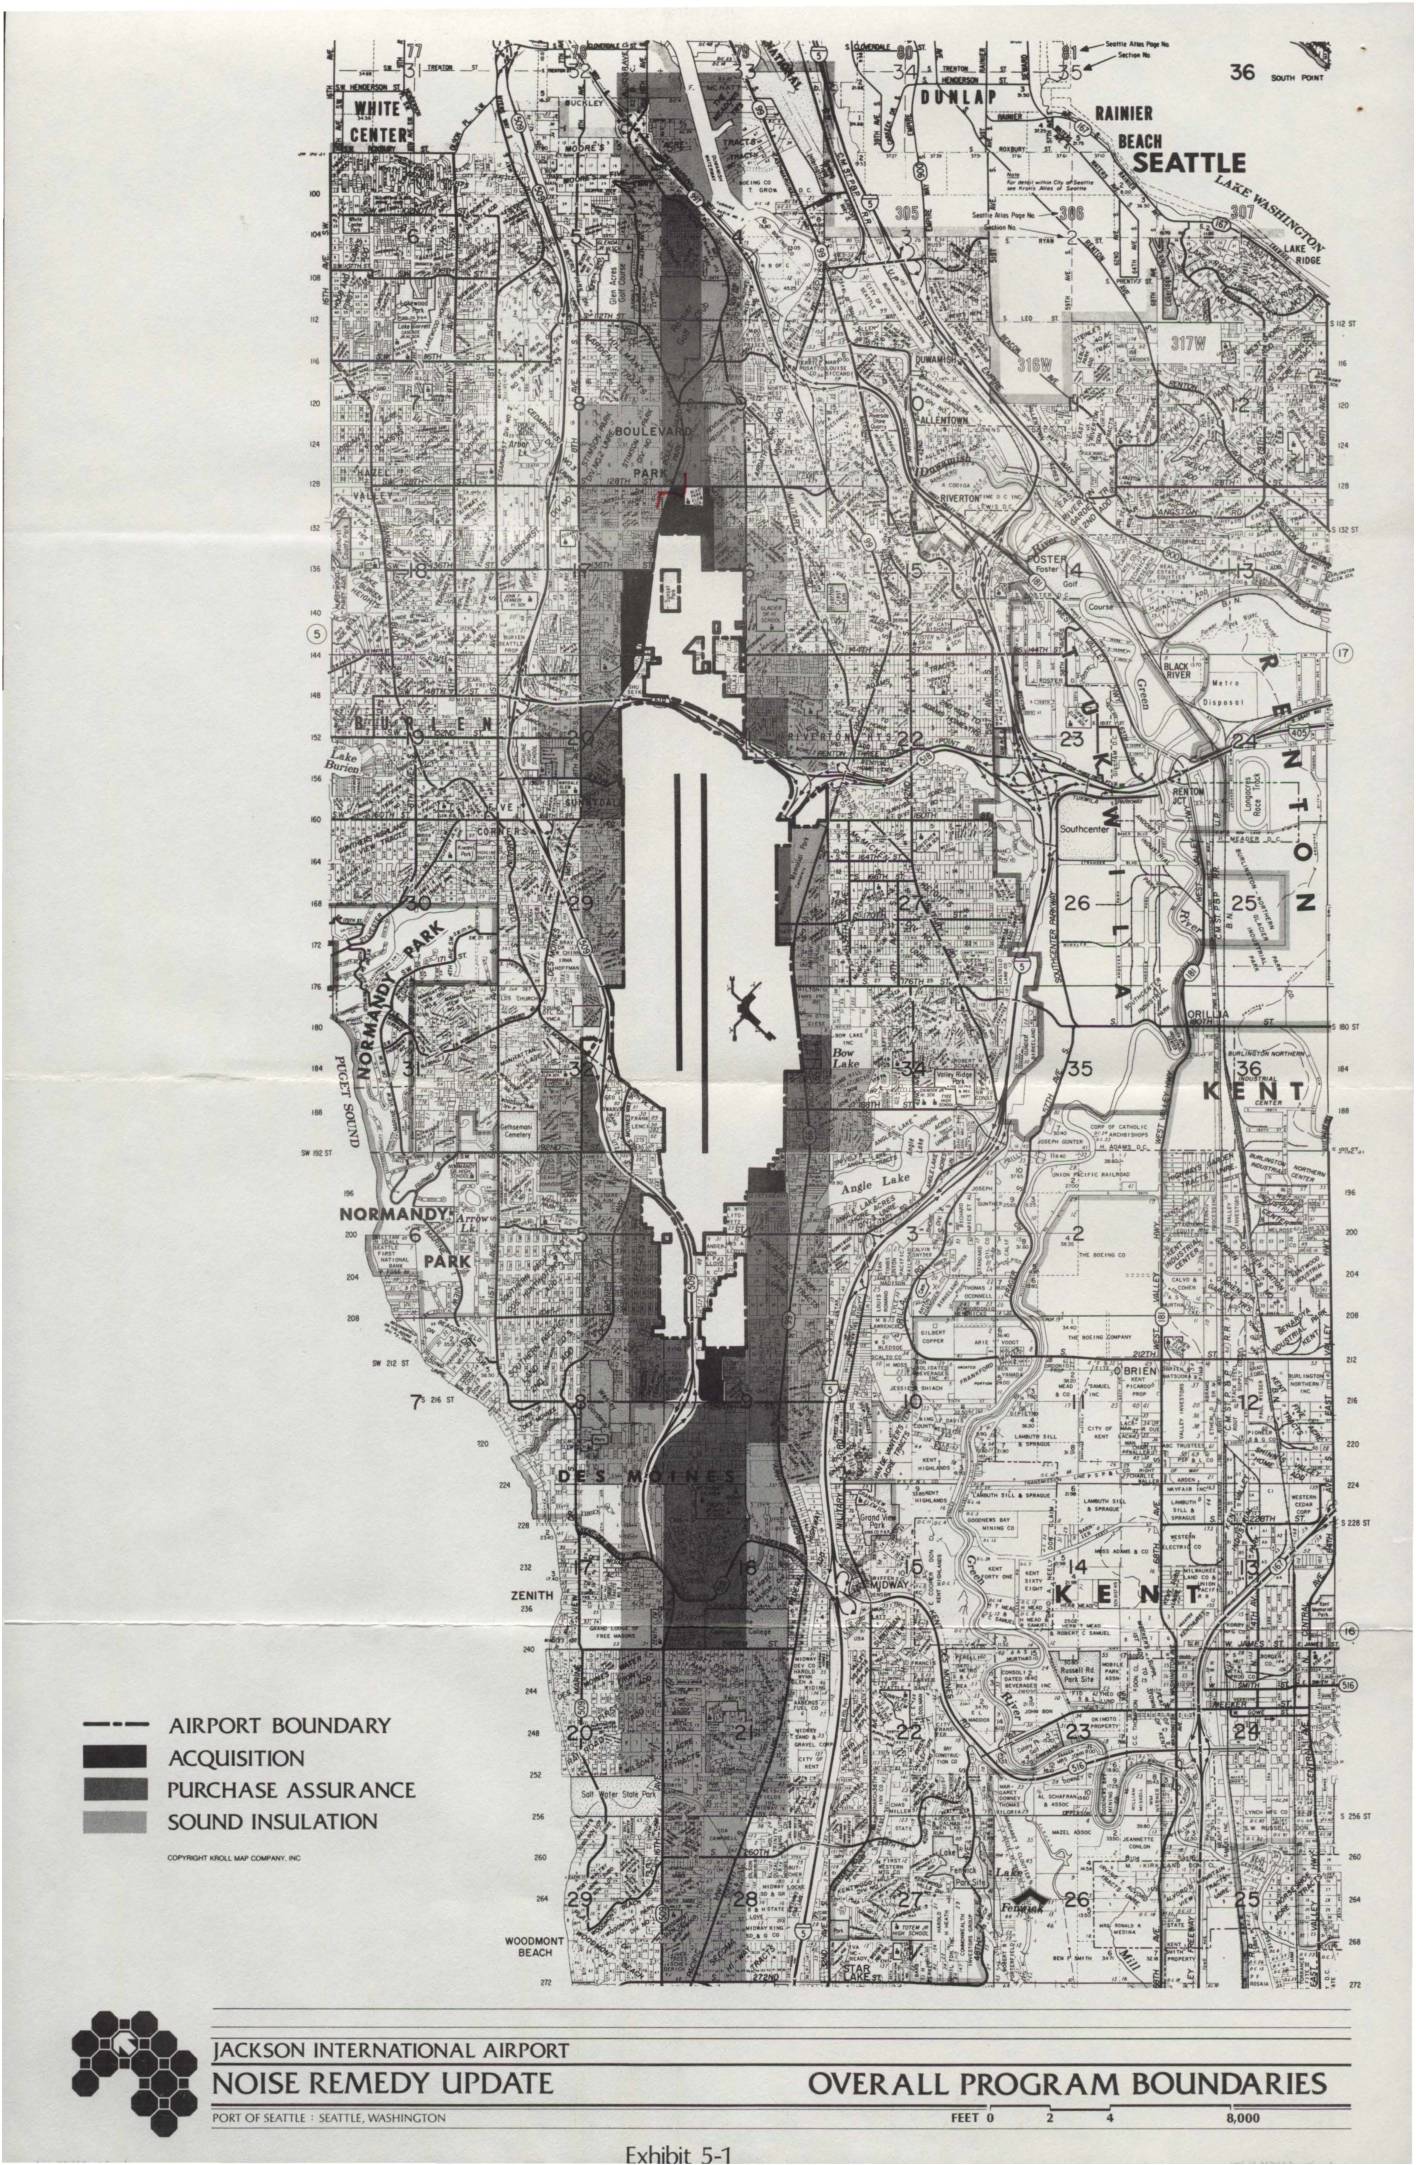
Jackson International Airport noise remedy update overall program boundaries
This document presents the Noise Remedy Update for Jackson International Airport (Sea-Tac), operated by the Port of Seattle, outlining the overall program boundaries for noise mitigation efforts in surrounding communities. It includes detailed maps showing three categories of noise remedy zones: Acquisition (properties purchased by the Port), Purchase Assurance (properties guaranteed a buyer), and Sound Insulation (properties eligible for noise-reduction improvements). The affected areas span multiple neighborhoods north and south of the airport, including White Center, Boulevard Park, Normandy Park, Des Moines, and parts of Kent and Renton.