TagMap(375)
-
18-120 DailyFTMbyFlow_Page_24
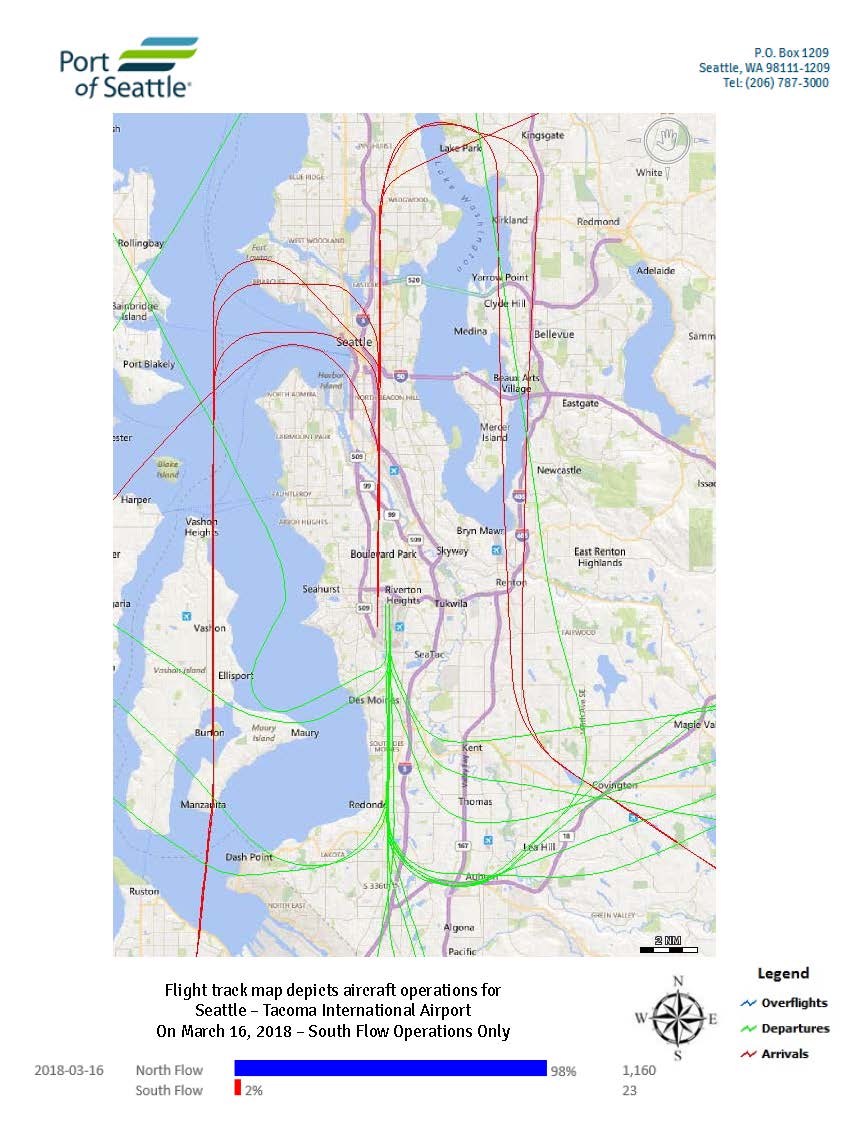
Port of Seattle flight track map depicting aircraft operations at Seattle-Tacoma International Airport on March 16, 2018, showing South Flow Operations Only. On that date, North Flow accounted for 98% of operations (1,160 flights) while South Flow accounted for 2% (23 flights); the map displays overflights (blue), departures (green), and arrivals (red) across the greater Seattle-Tacoma area. -
18-120 DailyFTMbyFlow_Page_23
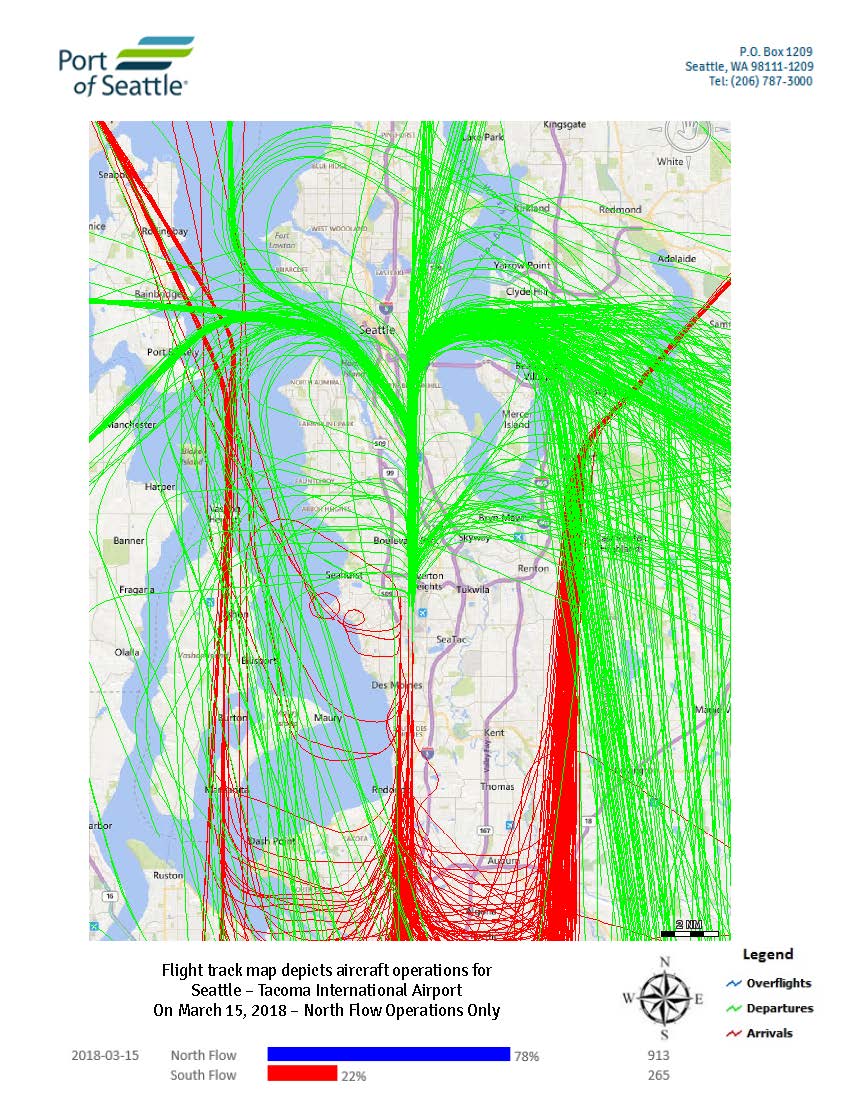
Port of Seattle flight track map depicting aircraft operations at Seattle-Tacoma International Airport on March 15, 2018, showing North Flow operations only (78%, 913 flights) and South Flow (22%, 265 flights). Green lines indicate departures, red lines indicate arrivals, and blue lines indicate overflights, with tracks shown over the greater Seattle-Tacoma metropolitan area. -
18-120 DailyFTMbyFlow_Page_26
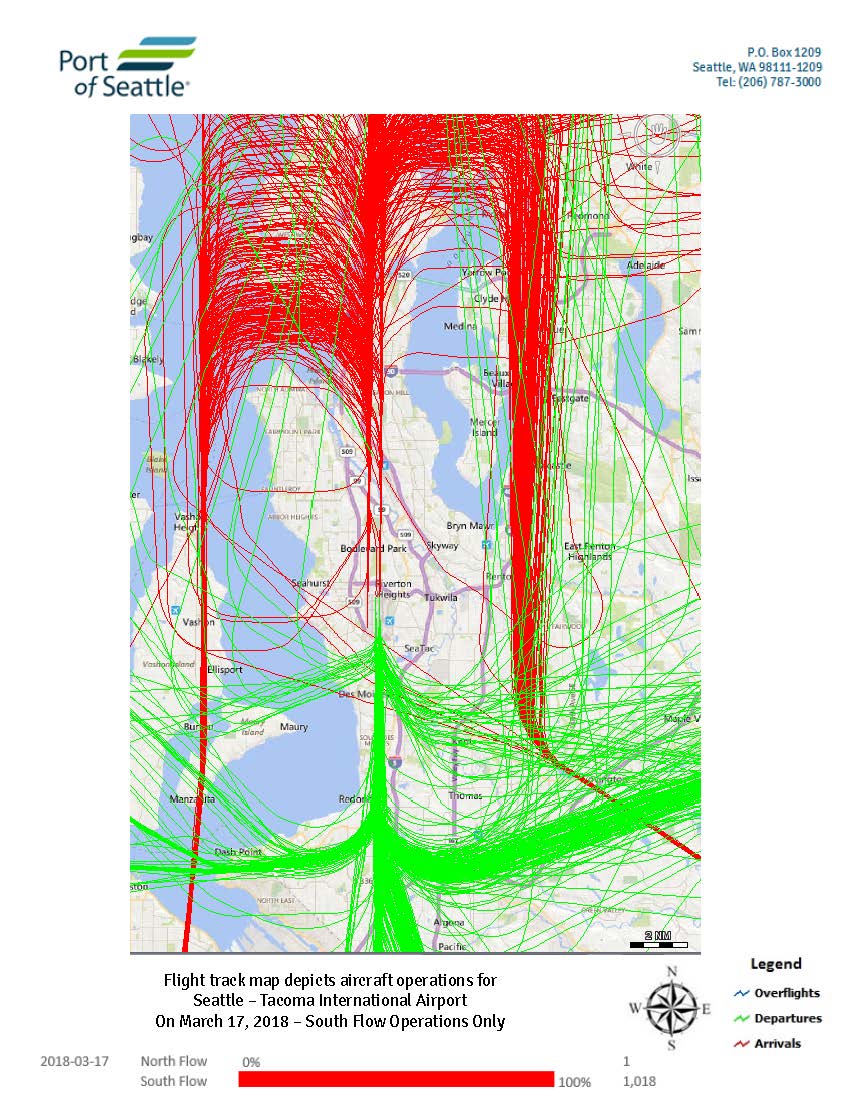
This Port of Seattle flight track map depicts all aircraft operations at Seattle-Tacoma International Airport on March 17, 2018, during 100% South Flow conditions, totaling 1,018 operations. Green lines represent departures, red lines represent arrivals, and blue lines represent overflights, with flight paths concentrated over the Puget Sound region and surrounding communities. -
18-120 DailyFTMbyFlow_Page_25
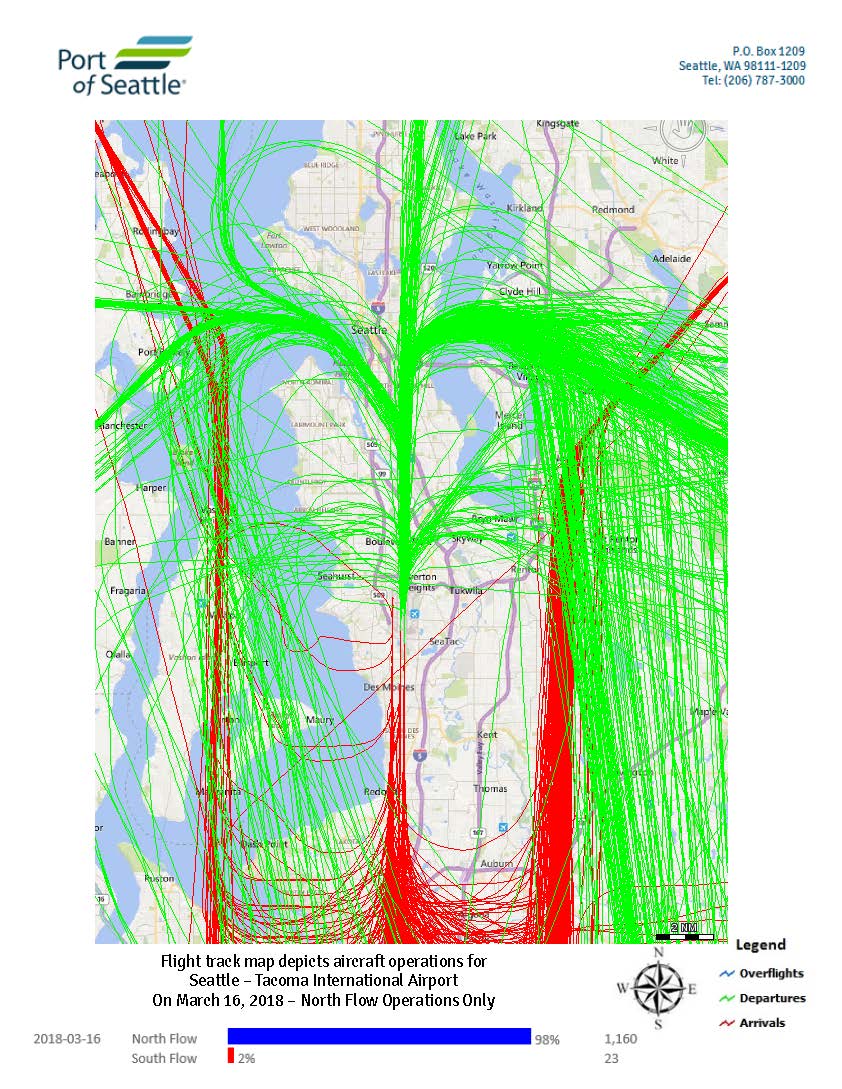
Flight track map produced by the Port of Seattle depicting aircraft operations at Seattle-Tacoma International Airport on March 16, 2018, North Flow Operations Only. On that date, North Flow accounted for 98% of operations (1,160 flights) and South Flow 2% (23 flights); green lines indicate departures, red lines indicate arrivals, and blue lines indicate overflights. -
18-120 DailyFTMbyFlow_Page_27
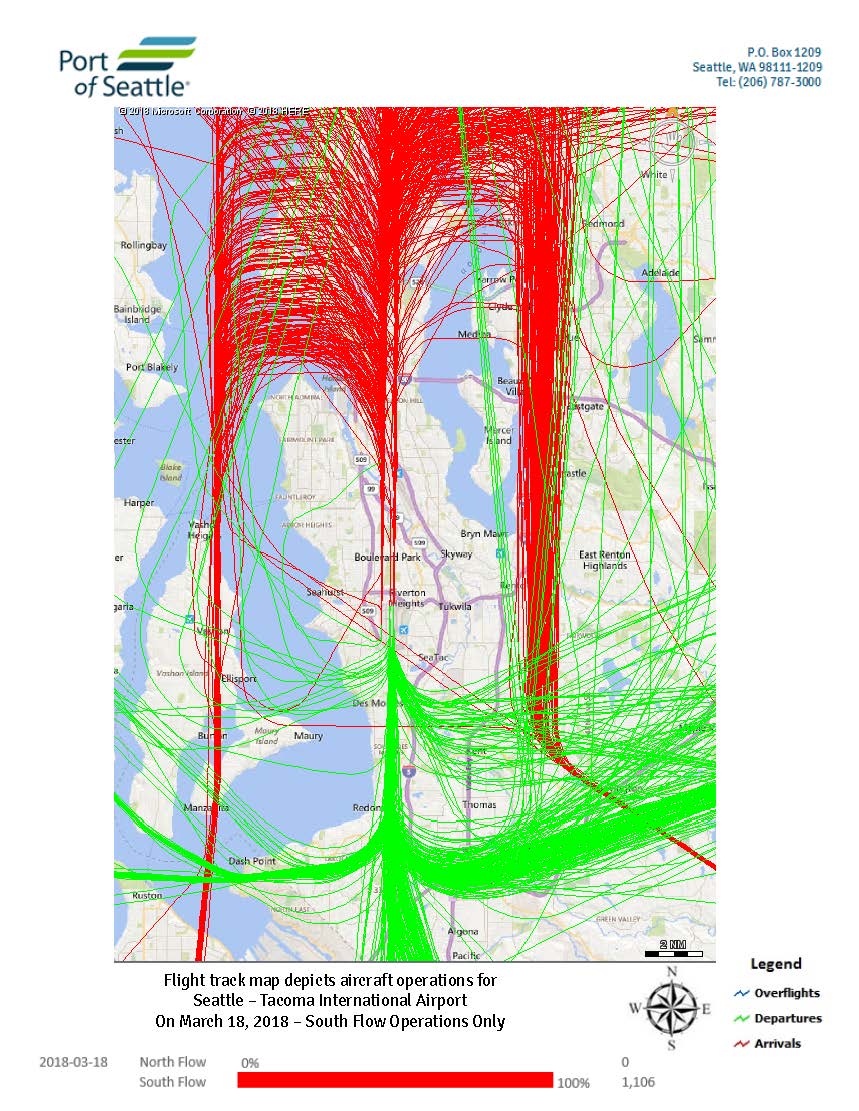
A Port of Seattle flight track map depicting aircraft operations at Seattle-Tacoma International Airport on March 18, 2018, showing 100% South Flow operations with 1,106 total operations. Green lines represent departures, red lines represent arrivals, and blue lines represent overflights, with tracks fanning out from the airport toward Puget Sound and the greater Seattle-Tacoma region. -
18-120 DailyFTMbyFlow_Page_04
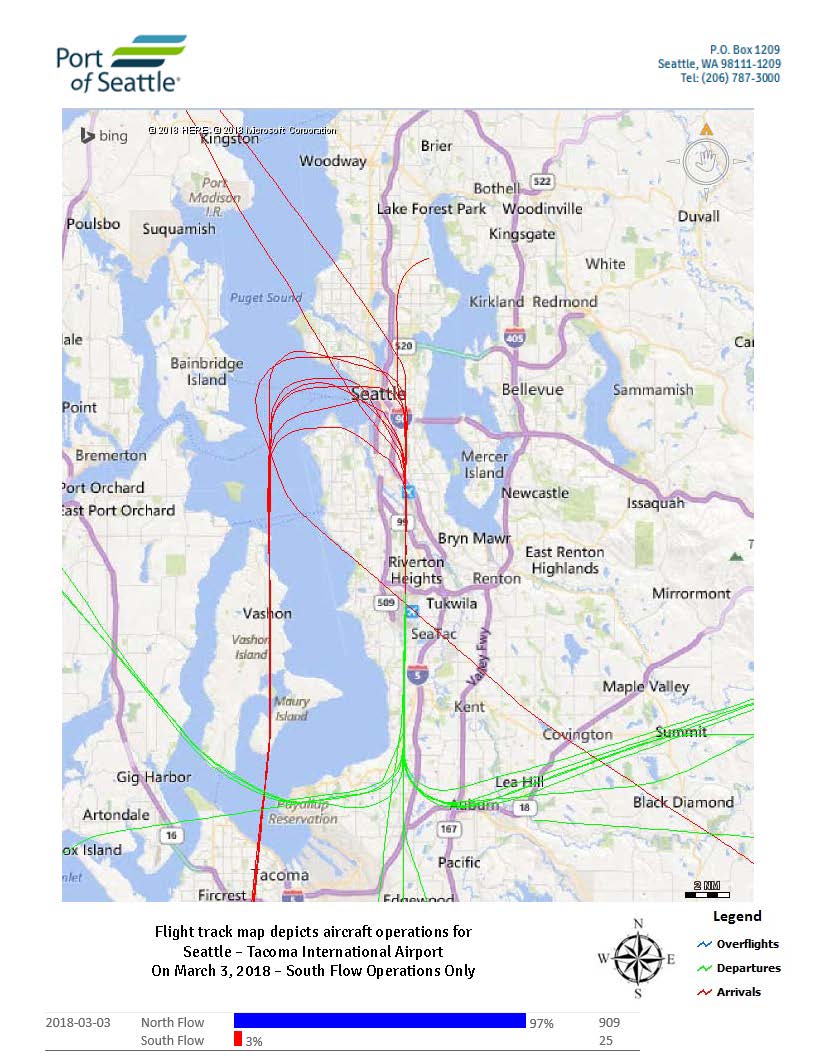
Port of Seattle flight track map depicting aircraft operations at Seattle-Tacoma International Airport on March 3, 2018, showing South Flow operations only (3%, 25 flights) alongside the dominant North Flow operations (97%, 909 flights). The map distinguishes overflights, departures (green), and arrivals (red) over the greater Seattle-Tacoma region. -
18-120 DailyFTMbyFlow_Page_03
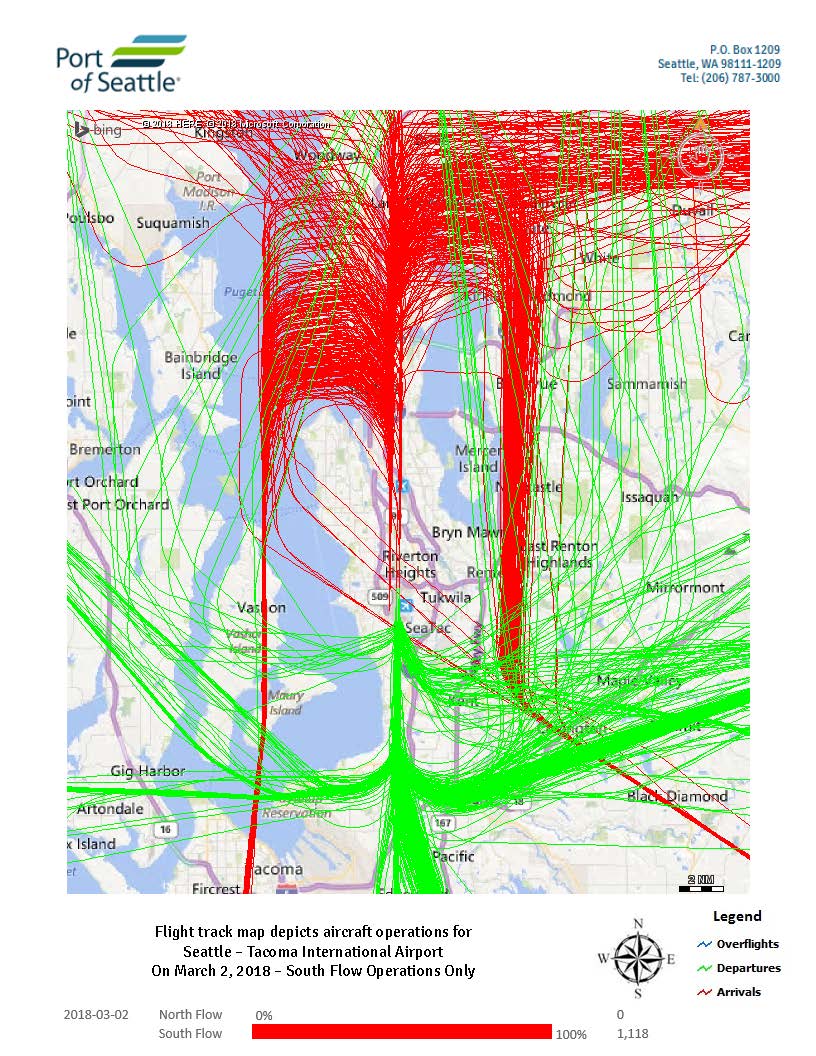
Port of Seattle flight track map depicting aircraft operations at Seattle-Tacoma International Airport on March 2, 2018, showing South Flow Operations Only (100%, 1,118 operations). Green lines represent departures, red lines represent arrivals, and blue lines represent overflights, with tracks concentrated along the north-south runway axis over Puget Sound and surrounding communities. -
18-120 DailyFTMbyFlow_Page_02
A Port of Seattle letterhead document showing a Bing Maps-based flight track visualization centered on the Seattle/Puget Sound region, with green lines depicting aircraft flight paths converging toward Sea-Tac Airport and red lines indicating other tracks or boundaries. The Port of Seattle logo and P.O. Box 1209, Seattle, WA 98111-1209 contact information are visible in the header. -
18-120 DailyFTMbyFlow_Page_01
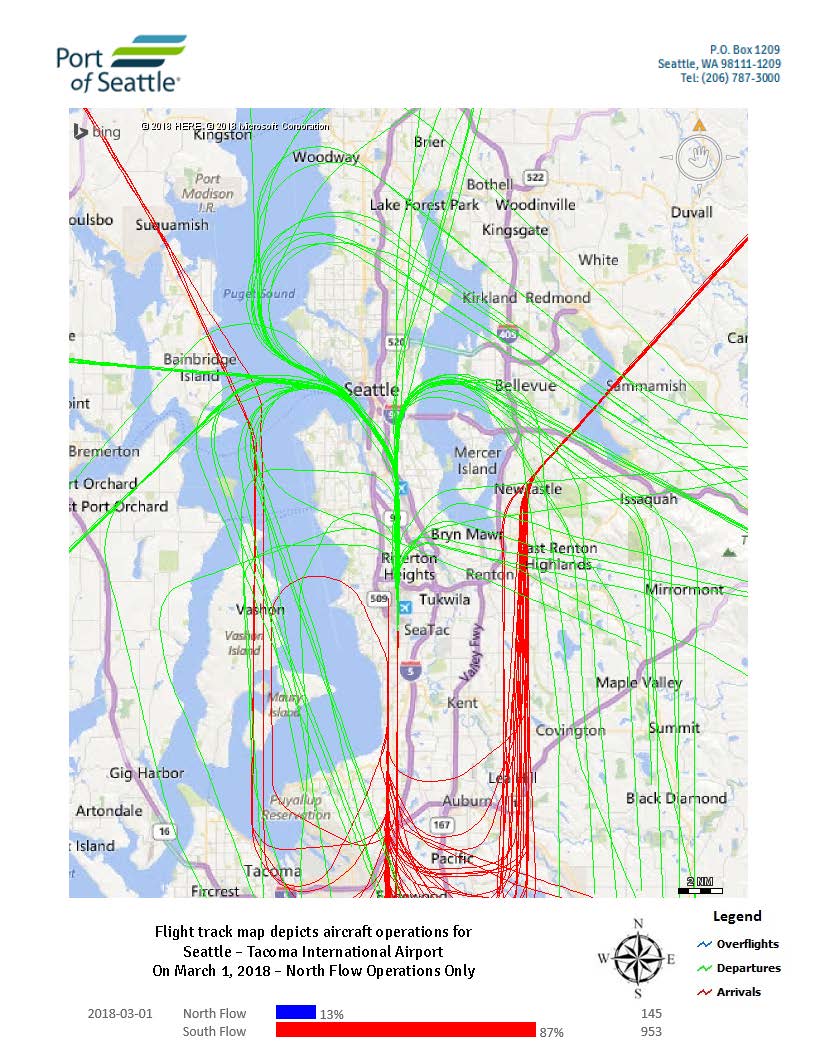
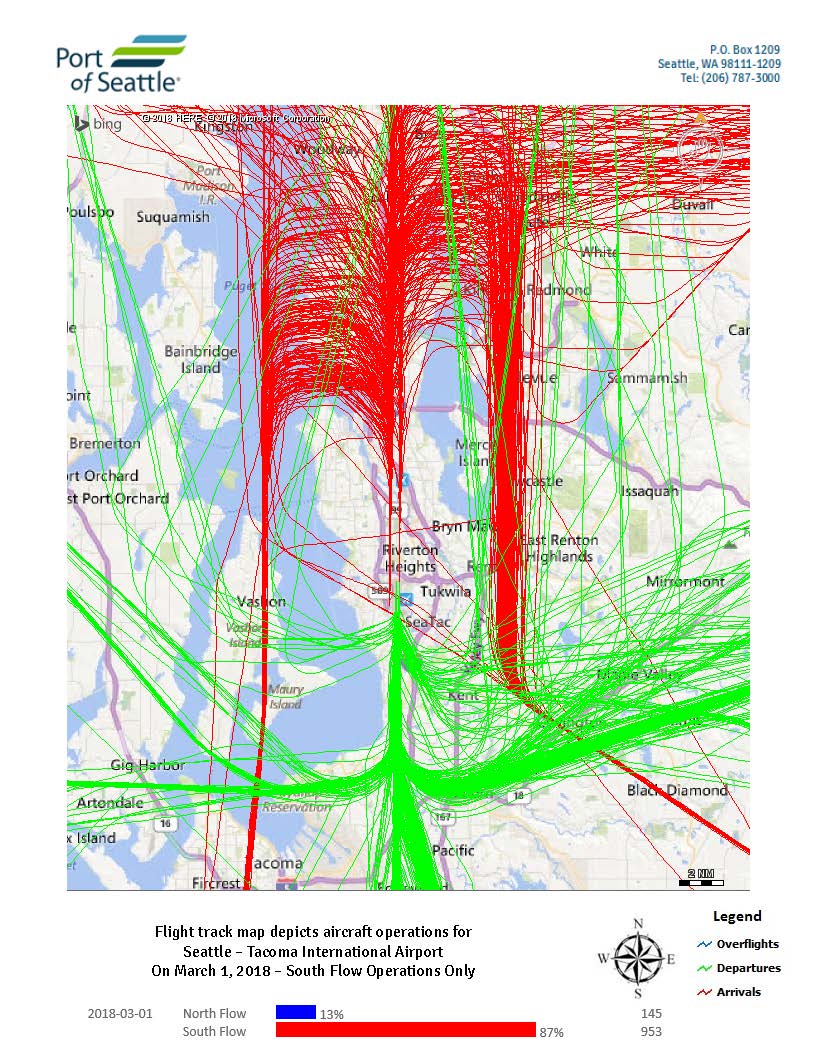
Port of Seattle flight track map showing aircraft operations at Seattle-Tacoma International Airport on March 1, 2018, during South Flow operations only. The map displays arrivals (red), departures (green), and overflights (blue) with South Flow accounting for 87% of operations (953 flights) and North Flow 13% (145 flights). -
18-120 DailyFTMbyFlow_Page_09
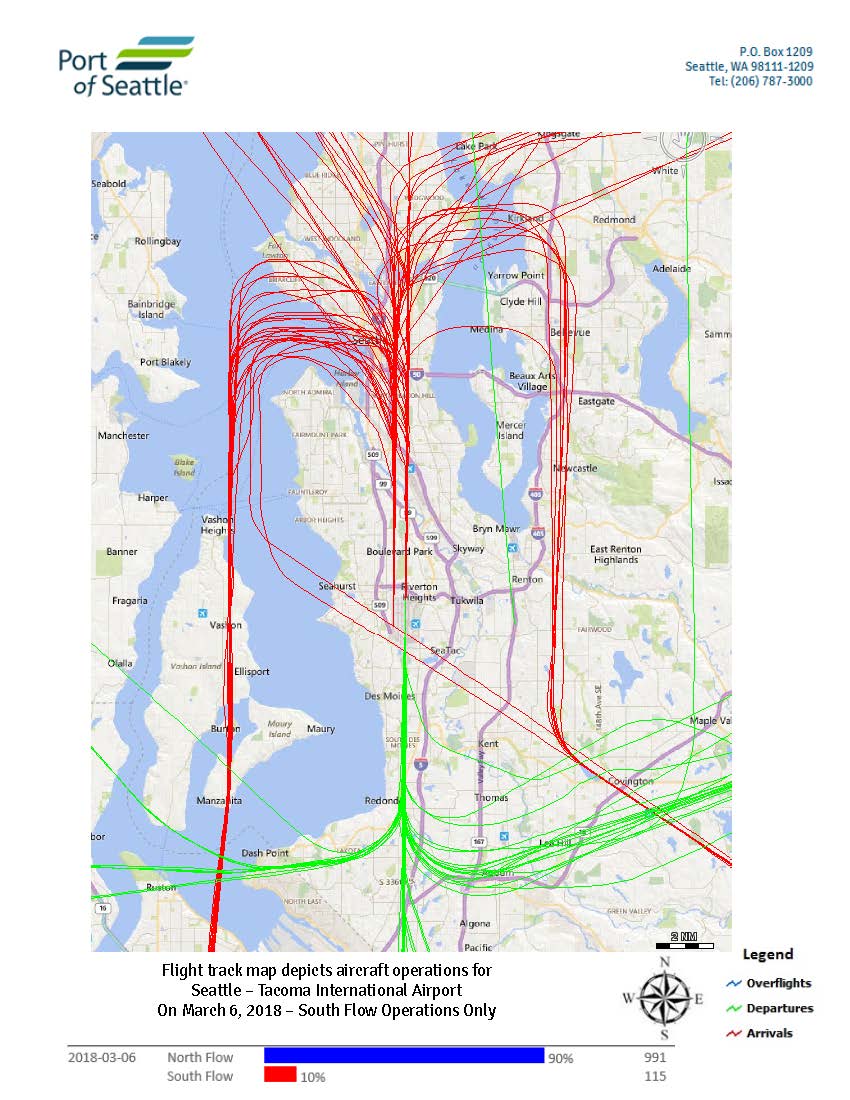
Port of Seattle flight track map depicting aircraft operations at Seattle-Tacoma International Airport on March 6, 2018, showing South Flow operations only. The map indicates arrivals (red), departures (green), and overflights (blue), with South Flow comprising 10% (115 operations) and North Flow comprising 90% (991 operations) of that day's traffic.