TagSea-Tac Airport(1855)
-
 2024-10-08
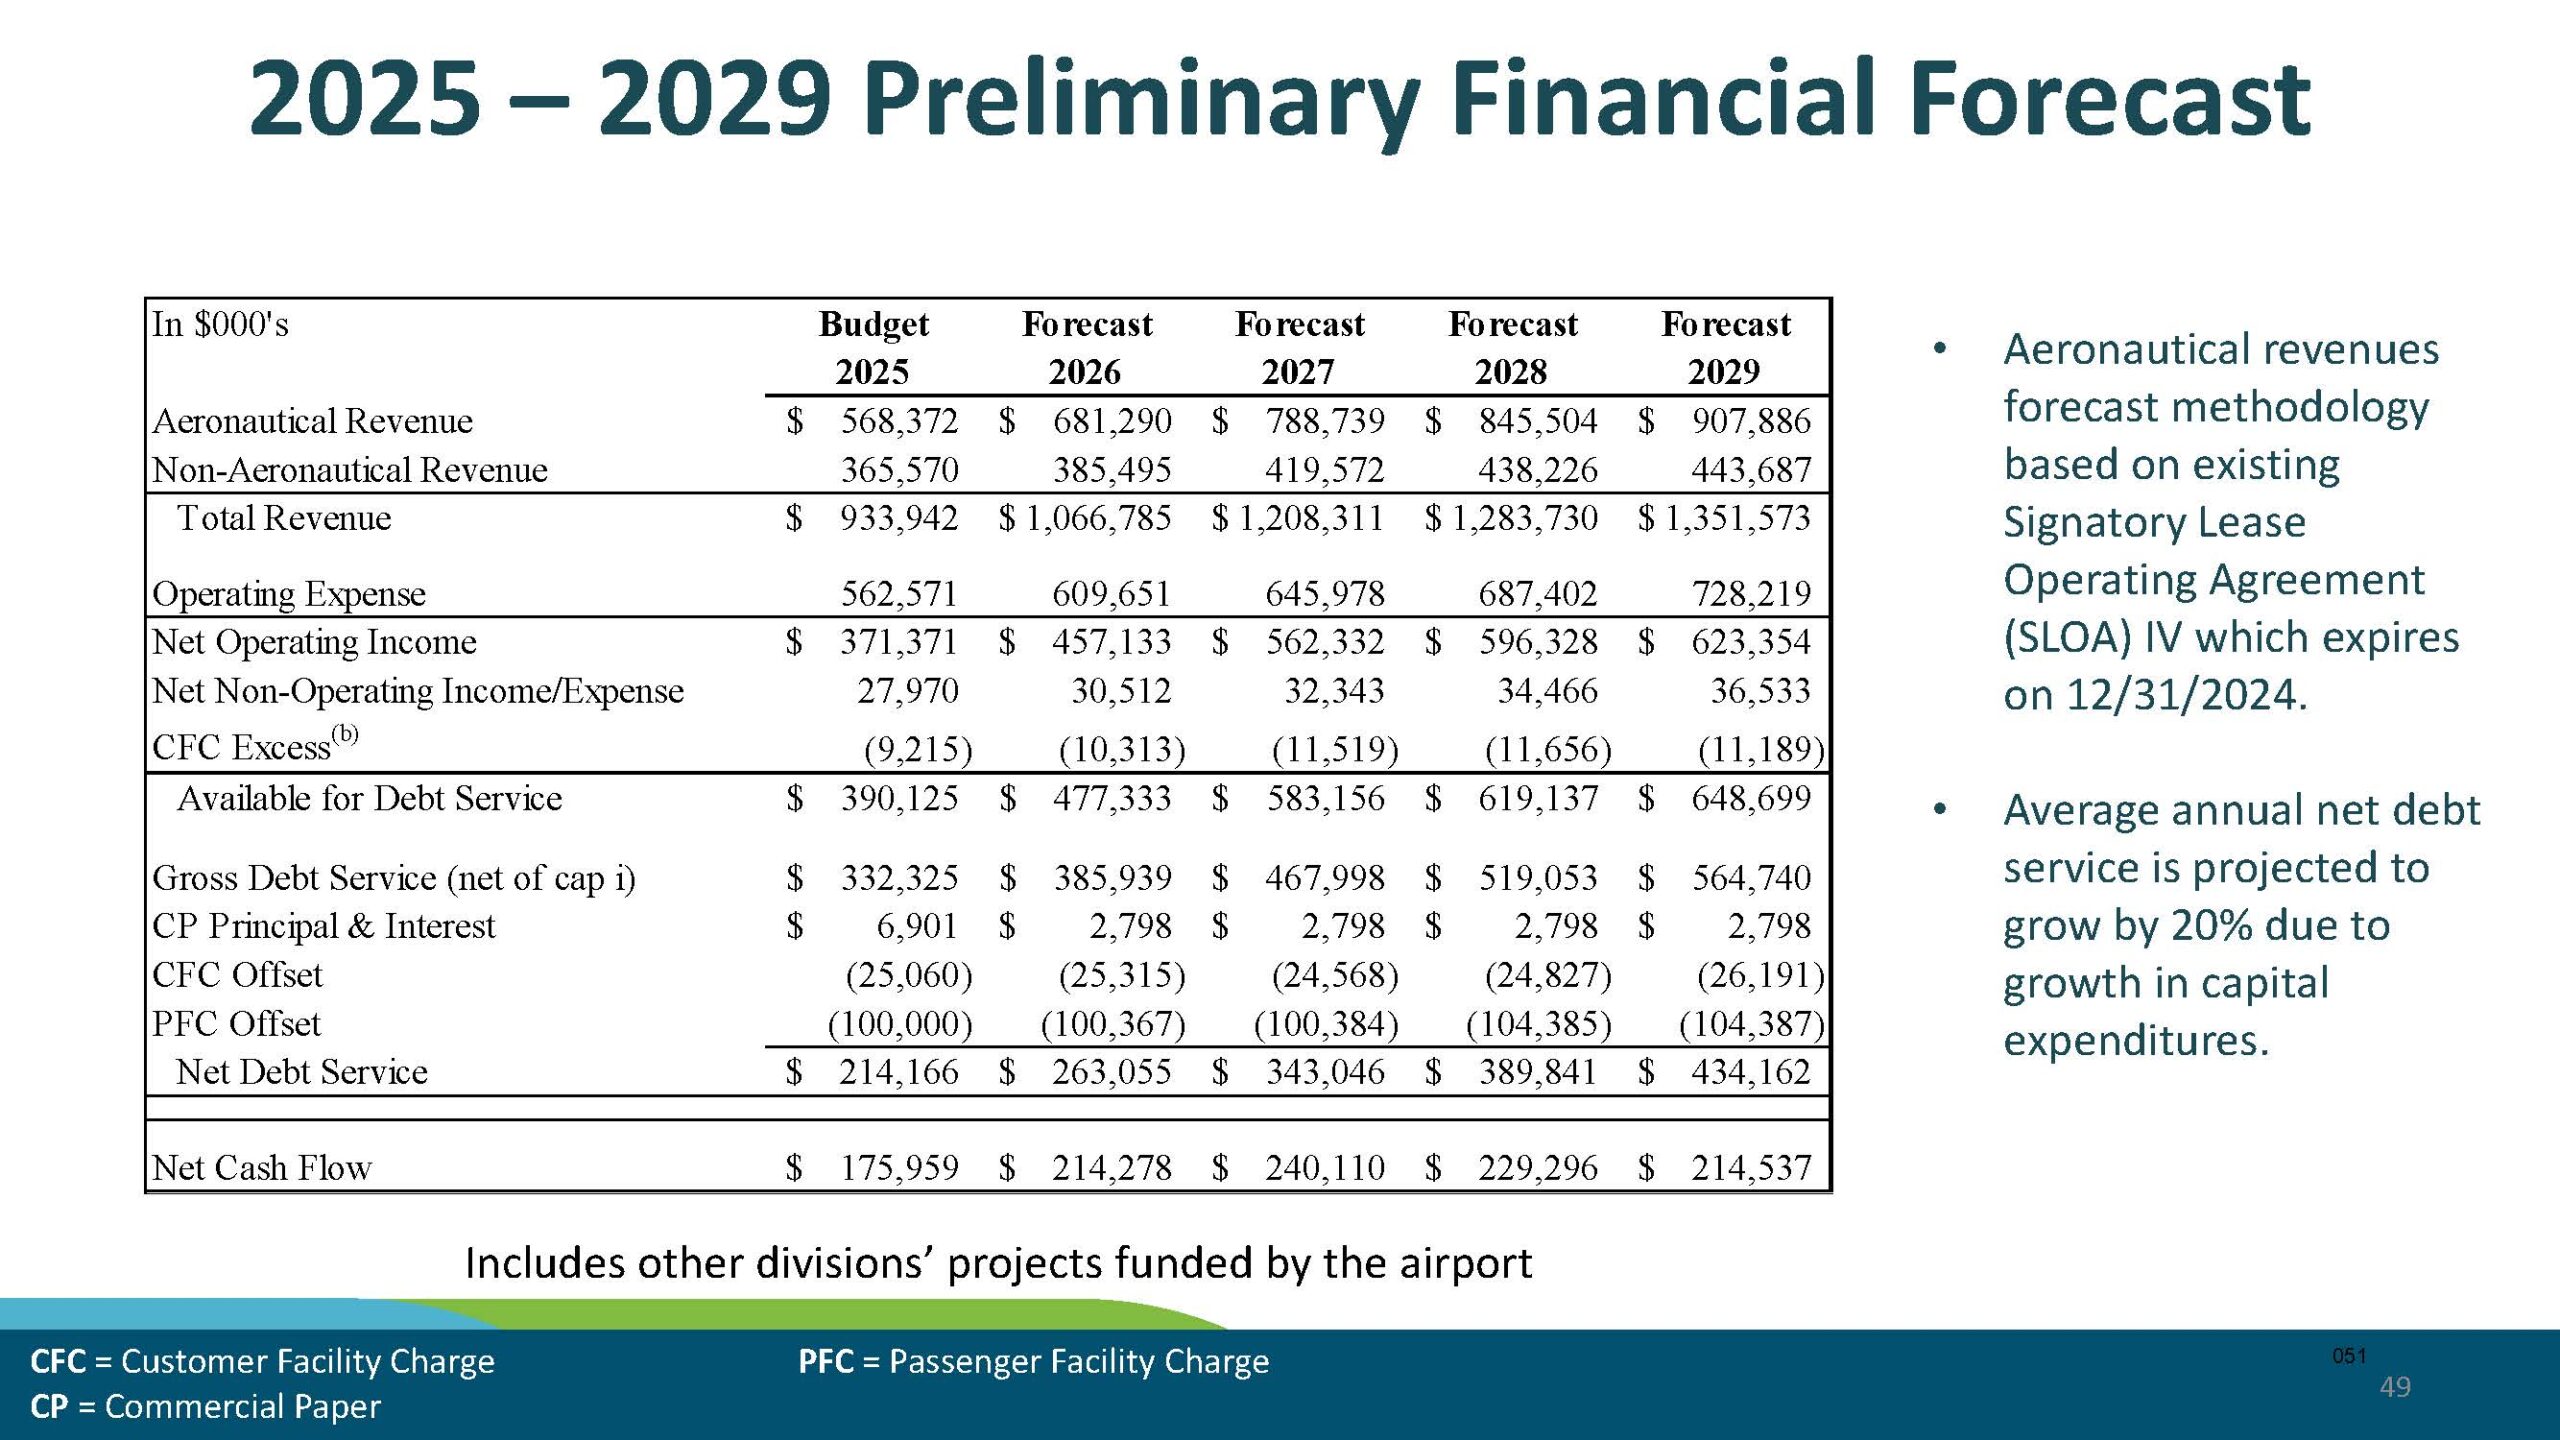
Sea-Tac Airport Aviation & Marina Budget Presentation — Financial Forecast 2025–2029 (Page 51)
A financial forecast slide for Seattle-Tacoma International Airport covering budget year 2025 and forecast years 2026–2029, showing aeronautical and non-aeronautical revenues, operating expenses, debt service, and net cash flow in thousands of dollars. Notes indicate the aeronautical revenue methodology is based on the Signatory Lease Operating Agreement (SLOA) IV expiring 12/31/2024, and average annual net debt service is projected to grow by 20% due to capital expenditure growth. -
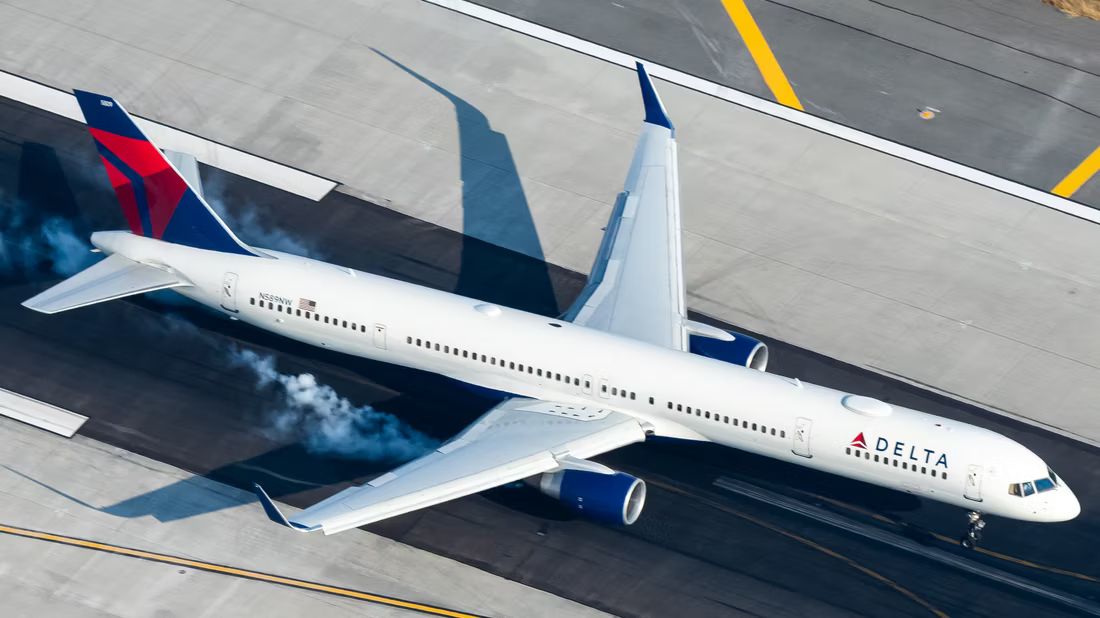
Delta Air Lines Boeing 757 (N559NW) on Runway
An aerial view of a Delta Air Lines Boeing 757, bearing tail number N559NW and a U.S. flag decal, taxiing or beginning its takeoff roll on a runway. The aircraft displays Delta's current livery with white fuselage, blue engines and winglets, and the red-and-blue widget logo on the tail; smoke is visible from the engines. -
 2024-10-03
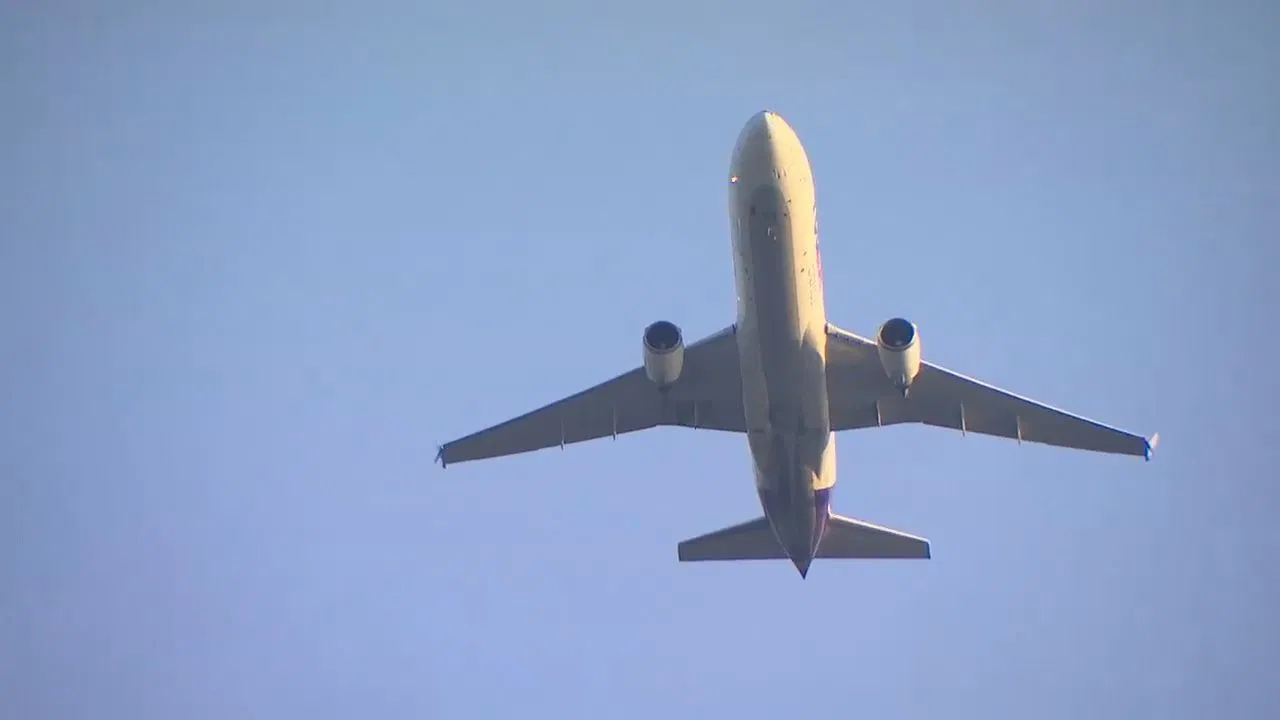
Commercial Jet Aircraft Viewed from Below Against Blue Sky
A white twin-engine narrow-body commercial jet aircraft, viewed from below against a clear blue sky, with landing gear retracted and what appears to be a purple or magenta tail livery partially visible. The aircraft type appears consistent with an Airbus A320-family or Boeing 737-family; no tail number or airline logo is legibly readable from this angle. -
 2024-10-01
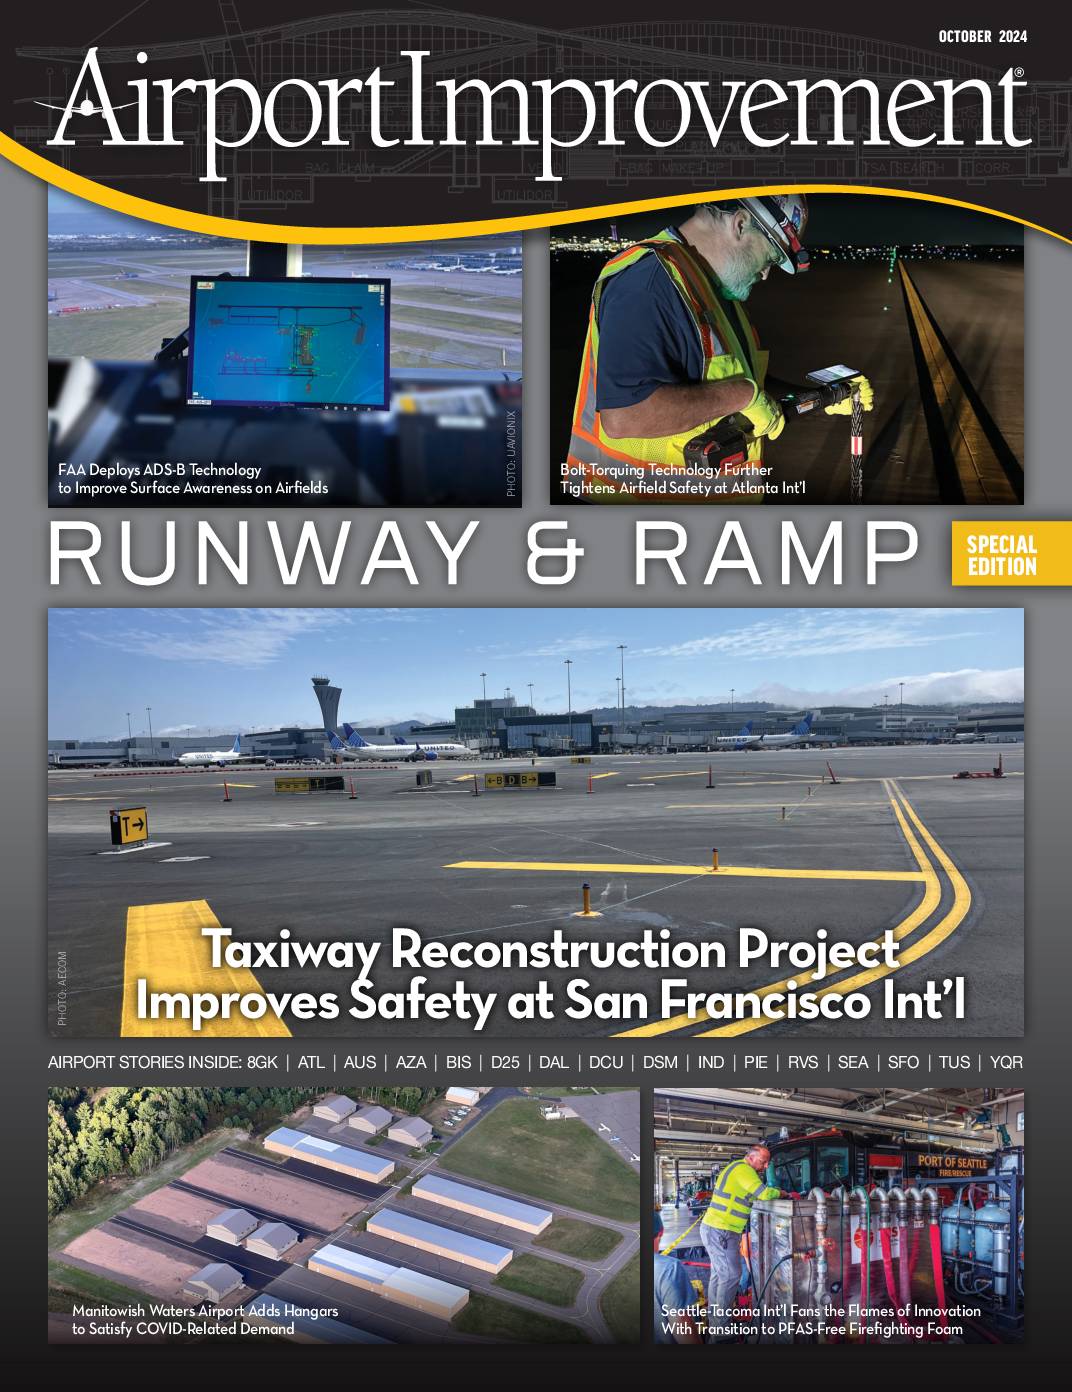
Airport Improvement Magazine, October 2024: Runway & Ramp Special Edition
The October 2024 special edition of Airport Improvement magazine covers runway and ramp safety projects at airports across the United States, including Seattle-Tacoma International Airport's transition to PFAS-free firefighting foam. The Seattle-Tacoma article focuses on cleaning PFAS contamination from firefighting vehicles, reflecting broader efforts to eliminate hazardous fluorine-based chemicals from airport operations. Additional stories cover FAA technology deployments, taxiway reconstruction, and airfield safety improvements at airports nationwide. -
 2024-10-01
Sustainable Airport Master Plan: Near-Term Projects Environmental Review — Release of the FAA NEPA Draft Environmental Assessment and Public Comment Period
Jan 16 2025 presentation to PSRC by Dave Kaplan, Clare Gallagher. Port of Seattle presentation covering the Sustainable Airport Master Plan (SAMP) Near-Term Projects (NTPs) Environmental Review, released October–November 2024. Covers the FAA NEPA Draft Environmental Assessment (Draft EA) and public comment period for Sea-Tac Airport (SEA). Includes historical passenger growth data from 1949 (130,600 -
 2024-10-01
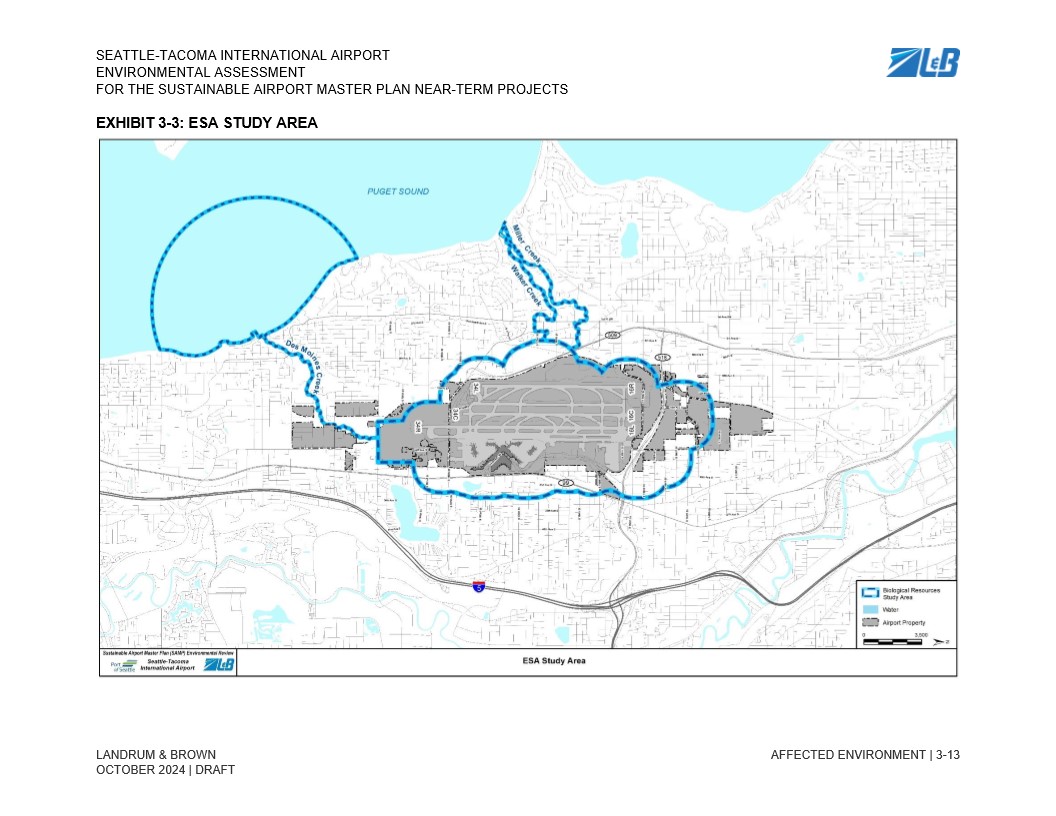
SAMP Exhibit 3-3 Area of Potential Effects (APE) Water
Exhibit 3-3 from the Seattle-Tacoma International Airport Environmental Assessment for the Sustainable Airport Master Plan (SAMP) Near-Term Projects, prepared by Landrum & Brown, dated October 2024 (Draft). The map depicts the Biological Resources ESA Study Area boundary (shown in blue dashed line) surrounding the airport property, extending to Puget Sound to the west and encompassing nearby waterways including Miller Creek and Walker Creek. -
 2024-10-01
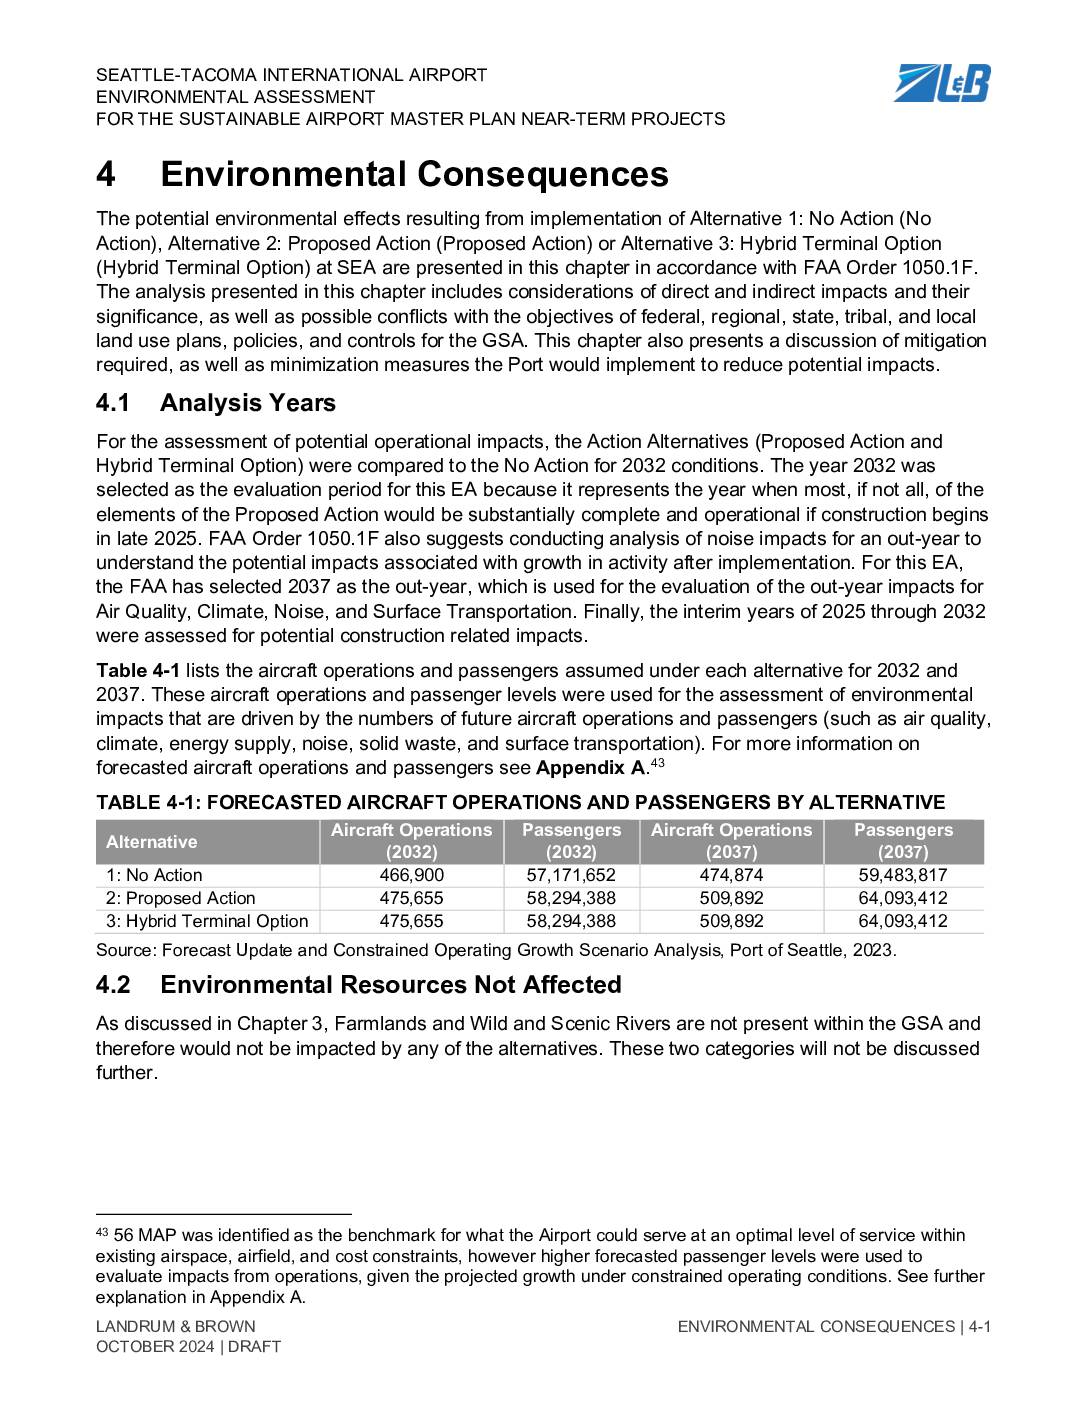
Seattle-Tacoma International Airport Environmental Assessment for the SAMP Near-Term Projects: Chapter 4 — Environmental Consequences
This October 2024 draft Environmental Assessment evaluates the potential environmental impacts of near-term construction and operational projects at Seattle-Tacoma International Airport under three alternatives: No Action, a Proposed Action, and a Hybrid Terminal Option. The analysis covers impacts through 2032 and an out-year of 2037, finding that increases in air quality emissions and effects on biological resources are not considered significant, with mitigation measures proposed for stormwater management and migratory bird nesting. Farmlands and Wild and Scenic Rivers were determined to have no presence in the study area and required no further analysis. -
 2024-10-01
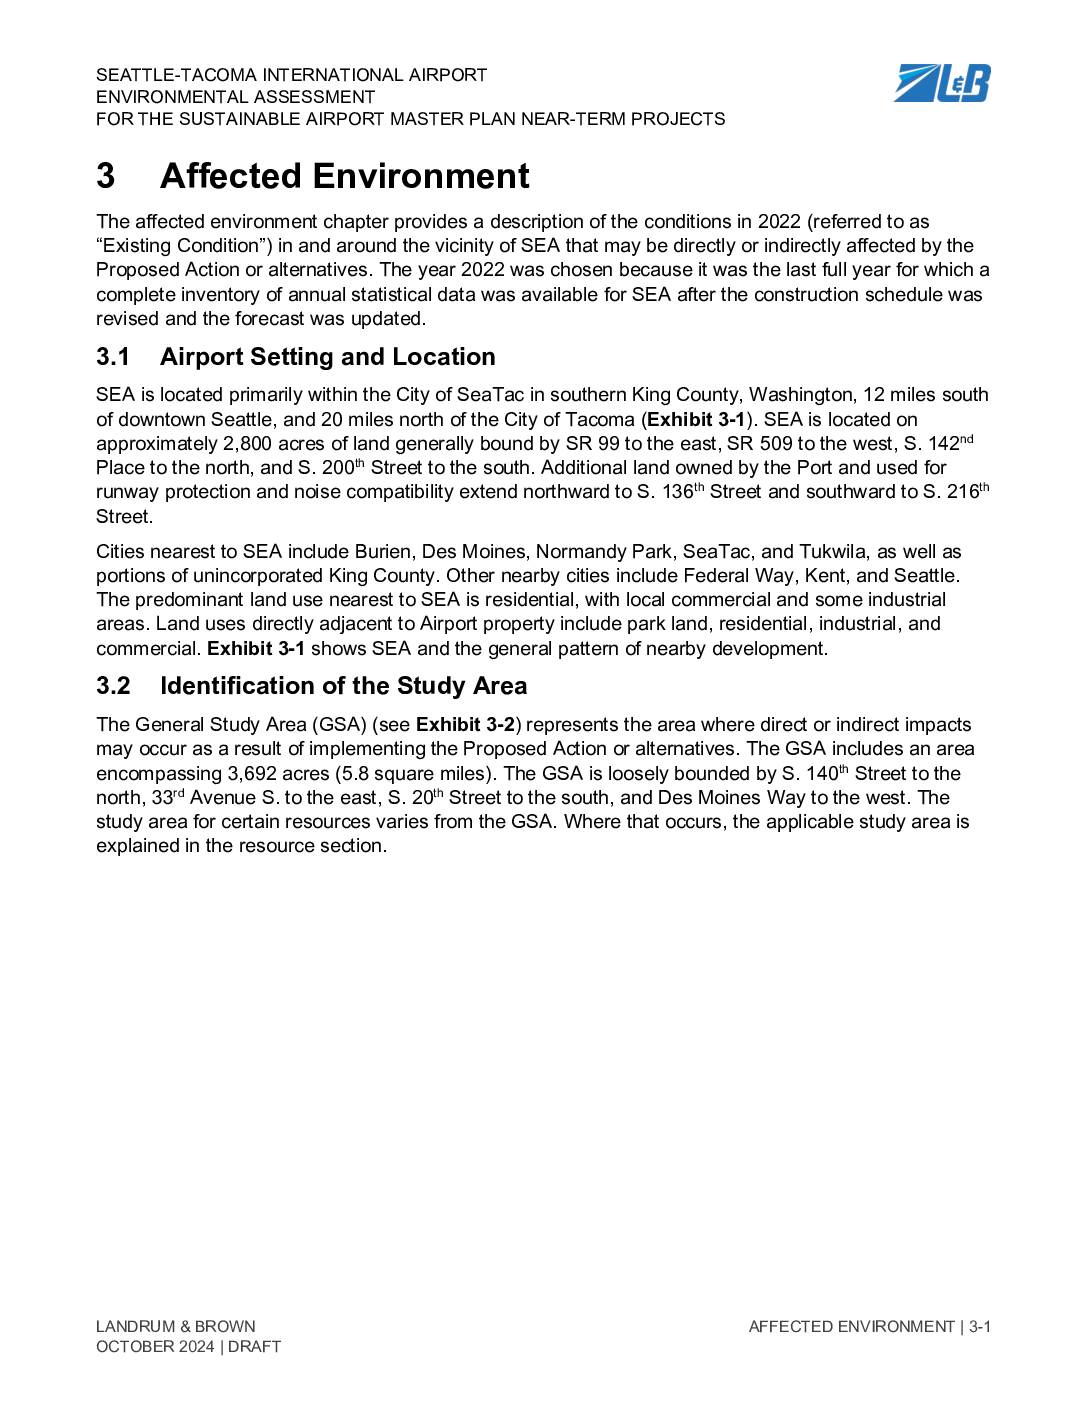
Chapter 3: Affected Environment — Seattle-Tacoma International Airport Environmental Assessment for the Sustainable Airport Master Plan Near-Term Projects
This draft Environmental Assessment from October 2024 examines the existing conditions around Seattle-Tacoma International Airport (SEA) as part of the Sustainable Airport Master Plan Near-Term Projects. Using 2022 as the baseline year, it describes SEA's location on approximately 2,800 acres in the City of SeaTac, situated 12 miles south of downtown Seattle and surrounded primarily by residential neighborhoods. The study covers a General Study Area of 3,692 acres to identify where proposed airport development actions could have direct or indirect environmental impacts on nearby communities. -
 2024-10-01
Draft Environmental Assessment for the Sustainable Airport Master Plan Near-Term Projects: Cover, Table of Contents, and Acronyms
This October 2024 Draft Environmental Assessment, prepared by Landrum & Brown for the Port of Seattle and the FAA, evaluates the environmental impacts of near-term construction projects at Seattle-Tacoma International Airport as part of its Sustainable Airport Master Plan. The assessment covers a wide range of environmental topics—including noise and noise-compatible land use, air quality, water resources, and environmental justice—for proposed improvements to passenger terminals, cargo facilities, airfield design, taxiways, and fuel storage. It is intended to support FAA decision-making under the National Environmental Policy Act (NEPA) and addresses the airport's ability to accommodate a projected 56 million annual passengers. -
 2024-09-24
Appendix D: Biological Resources — Biological Evaluation and Section 7 Consultation Request, SEA SAMP Near-Term Projects
The FAA submitted a Biological Evaluation to support an informal consultation under the Endangered Species Act for near-term construction projects at Seattle-Tacoma International Airport, all expected to be completed by 2032. The projects aim to expand passenger and cargo capacity, upgrade taxiway layouts, and increase fuel storage including sustainable aviation fuel. The evaluation assessed potential impacts on 14 species, determining that several—including Chinook salmon, bull trout, and killer whales—may be affected but not likely adversely, while the remaining species, such as the marbled murrelet and North American wolverine, would face no effect.