TagSea-Tac Airport(1855)
-
 2024-09-20
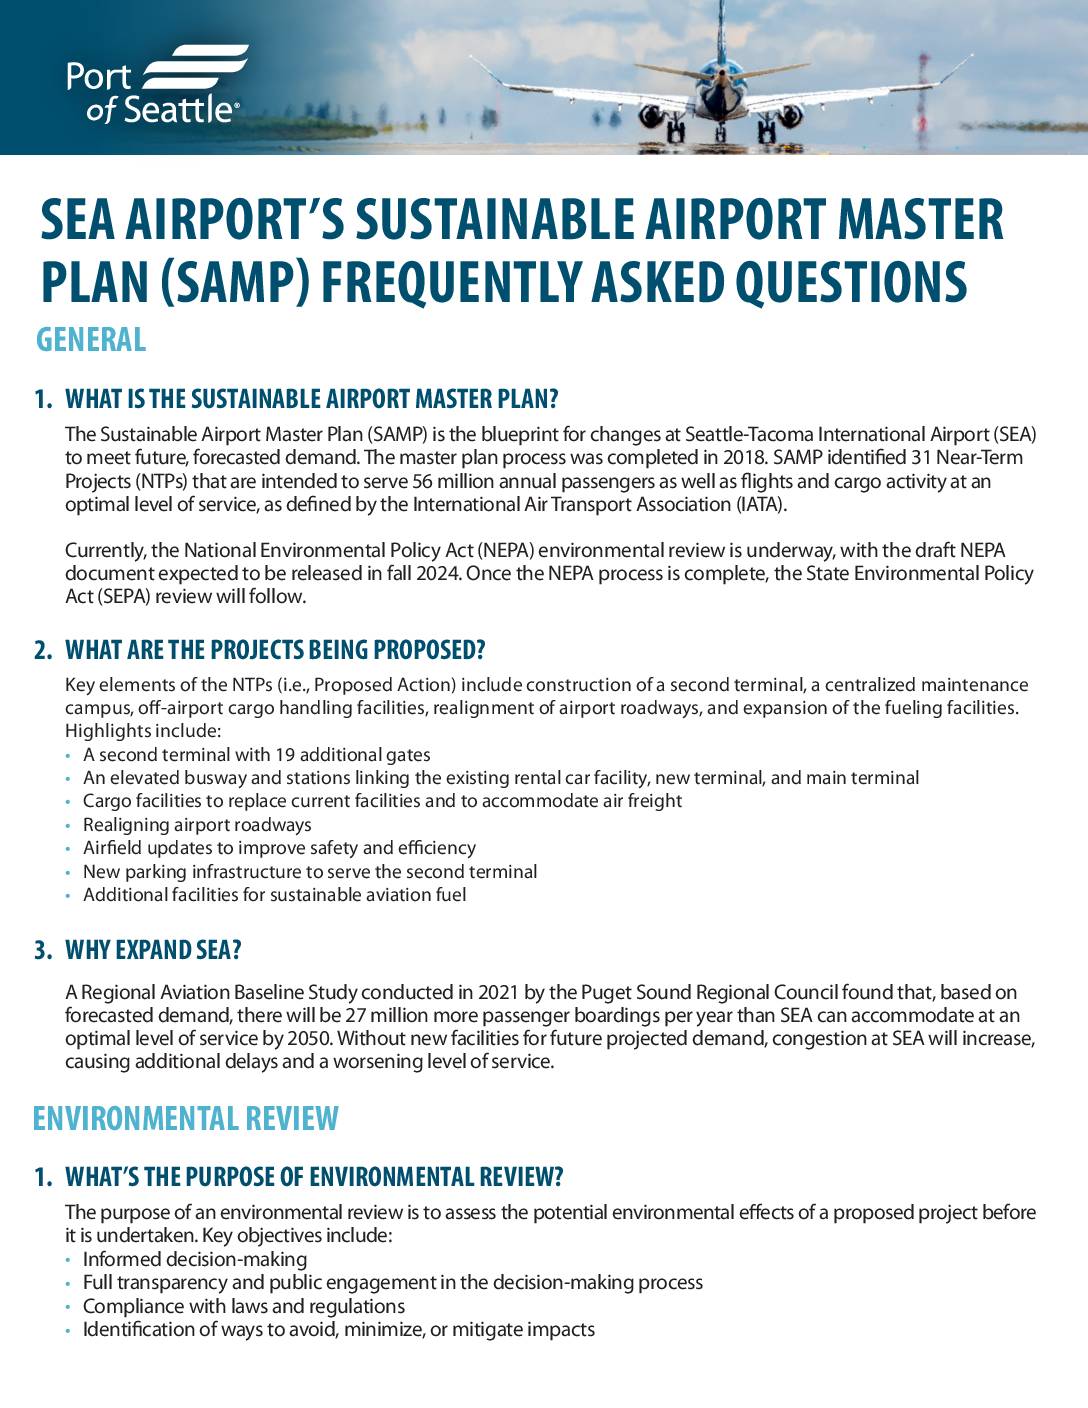
SEA Airport’s Sustainable Airport Master Plan (SAMP) Frequently Asked Questions
The Port of Seattle's Sustainable Airport Master Plan (SAMP) outlines 31 near-term construction projects at Seattle-Tacoma International Airport, including a second terminal with 19 gates, new cargo facilities, and roadway changes, all aimed at serving up to 56 million passengers annually by 2050. A federal environmental review (NEPA) is underway to assess potential impacts, with a 45-day public comment period opening October 21, 2024, allowing community members to submit feedback online, by mail, or at public libraries in Burien, Des Moines, and SeaTac. A separate state-level environmental review (SEPA) will follow once the federal process is complete. -
 2024-09-18
US Senate Committee on Commerce Science and Transportation Aviation Cybersecurity Threats
U.S. Senator Maria Cantwell (D-Wash.), Chair of the Senate Committee on Commerce, Science and Transportation, will convene a full committee hearing titled “Aviation Cybersecurity Threats” on Wednesday, September 18, 2024, at 10:00 AM EDT. This hearing will examine cybersecurity threats faced by airports and airlines, impacts and disruptions to passengers, along with how the nation’s aviation -
 2024-09-13
Sea-Tac Airport cyberattack caused by global ransomware gang, Port says
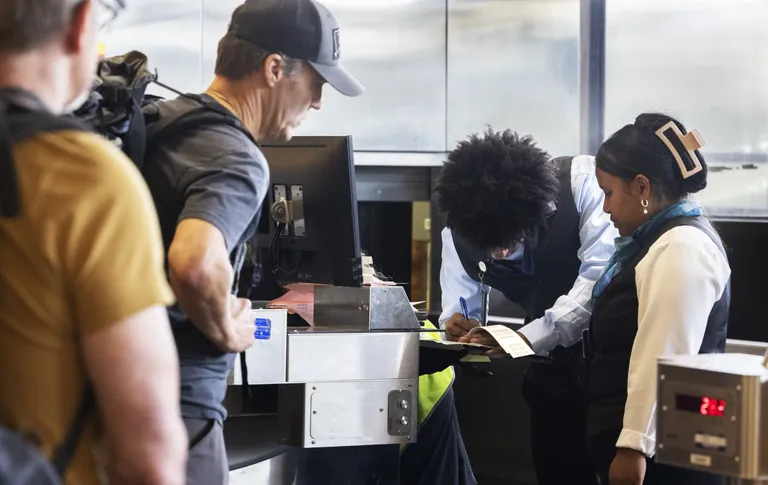
A ticket agent with WestJet Airlines at Seattle-Tacoma International Airport writes a luggage tag by hand at the airport on Aug. 26, after a cyberattack disrupted computer systems. The cyberattack, by a group called Rhysida, resulted in internet and technology outages during the busy traveling season leading up to Labor Day. (Ellen M. Banner / -
 2024-09-09
Appendix L: Surface Transportation Existing Conditions Report — SAMP NTP Environmental Review
This technical report analyzes existing surface transportation and traffic conditions around Seattle-Tacoma International Airport as part of the Sustainable Airport Master Plan (SAMP) Near-Term Projects Environmental Review. It examines 108 intersections — including signalized, stop-controlled, and uncontrolled locations — along key travel routes connecting the airport to surrounding communities, focusing on weekday PM peak-hour traffic volumes. The study also includes freeway analysis of SR 518 and I-5 ramps and segments at the request of WSDOT. -
 2024-09-09
SAMP NTP Environmental Review: Affected Environment — Surface Transportation Existing Conditions Report
This report analyzes existing traffic conditions around Seattle-Tacoma International Airport as part of the Sustainable Airport Master Plan (SAMP) Near-Term Projects Environmental Review. It examines 108 intersections—including 63 signalized, 41 stop-controlled, and 4 uncontrolled—along key routes connecting the airport to surrounding communities, focusing on the weekday PM peak hour (4–6 p.m.). Freeway segments of SR 518 and I-5 were also evaluated at WSDOT's request to provide a comprehensive picture of surface transportation conditions in the airport study area. -
 2024-09-07
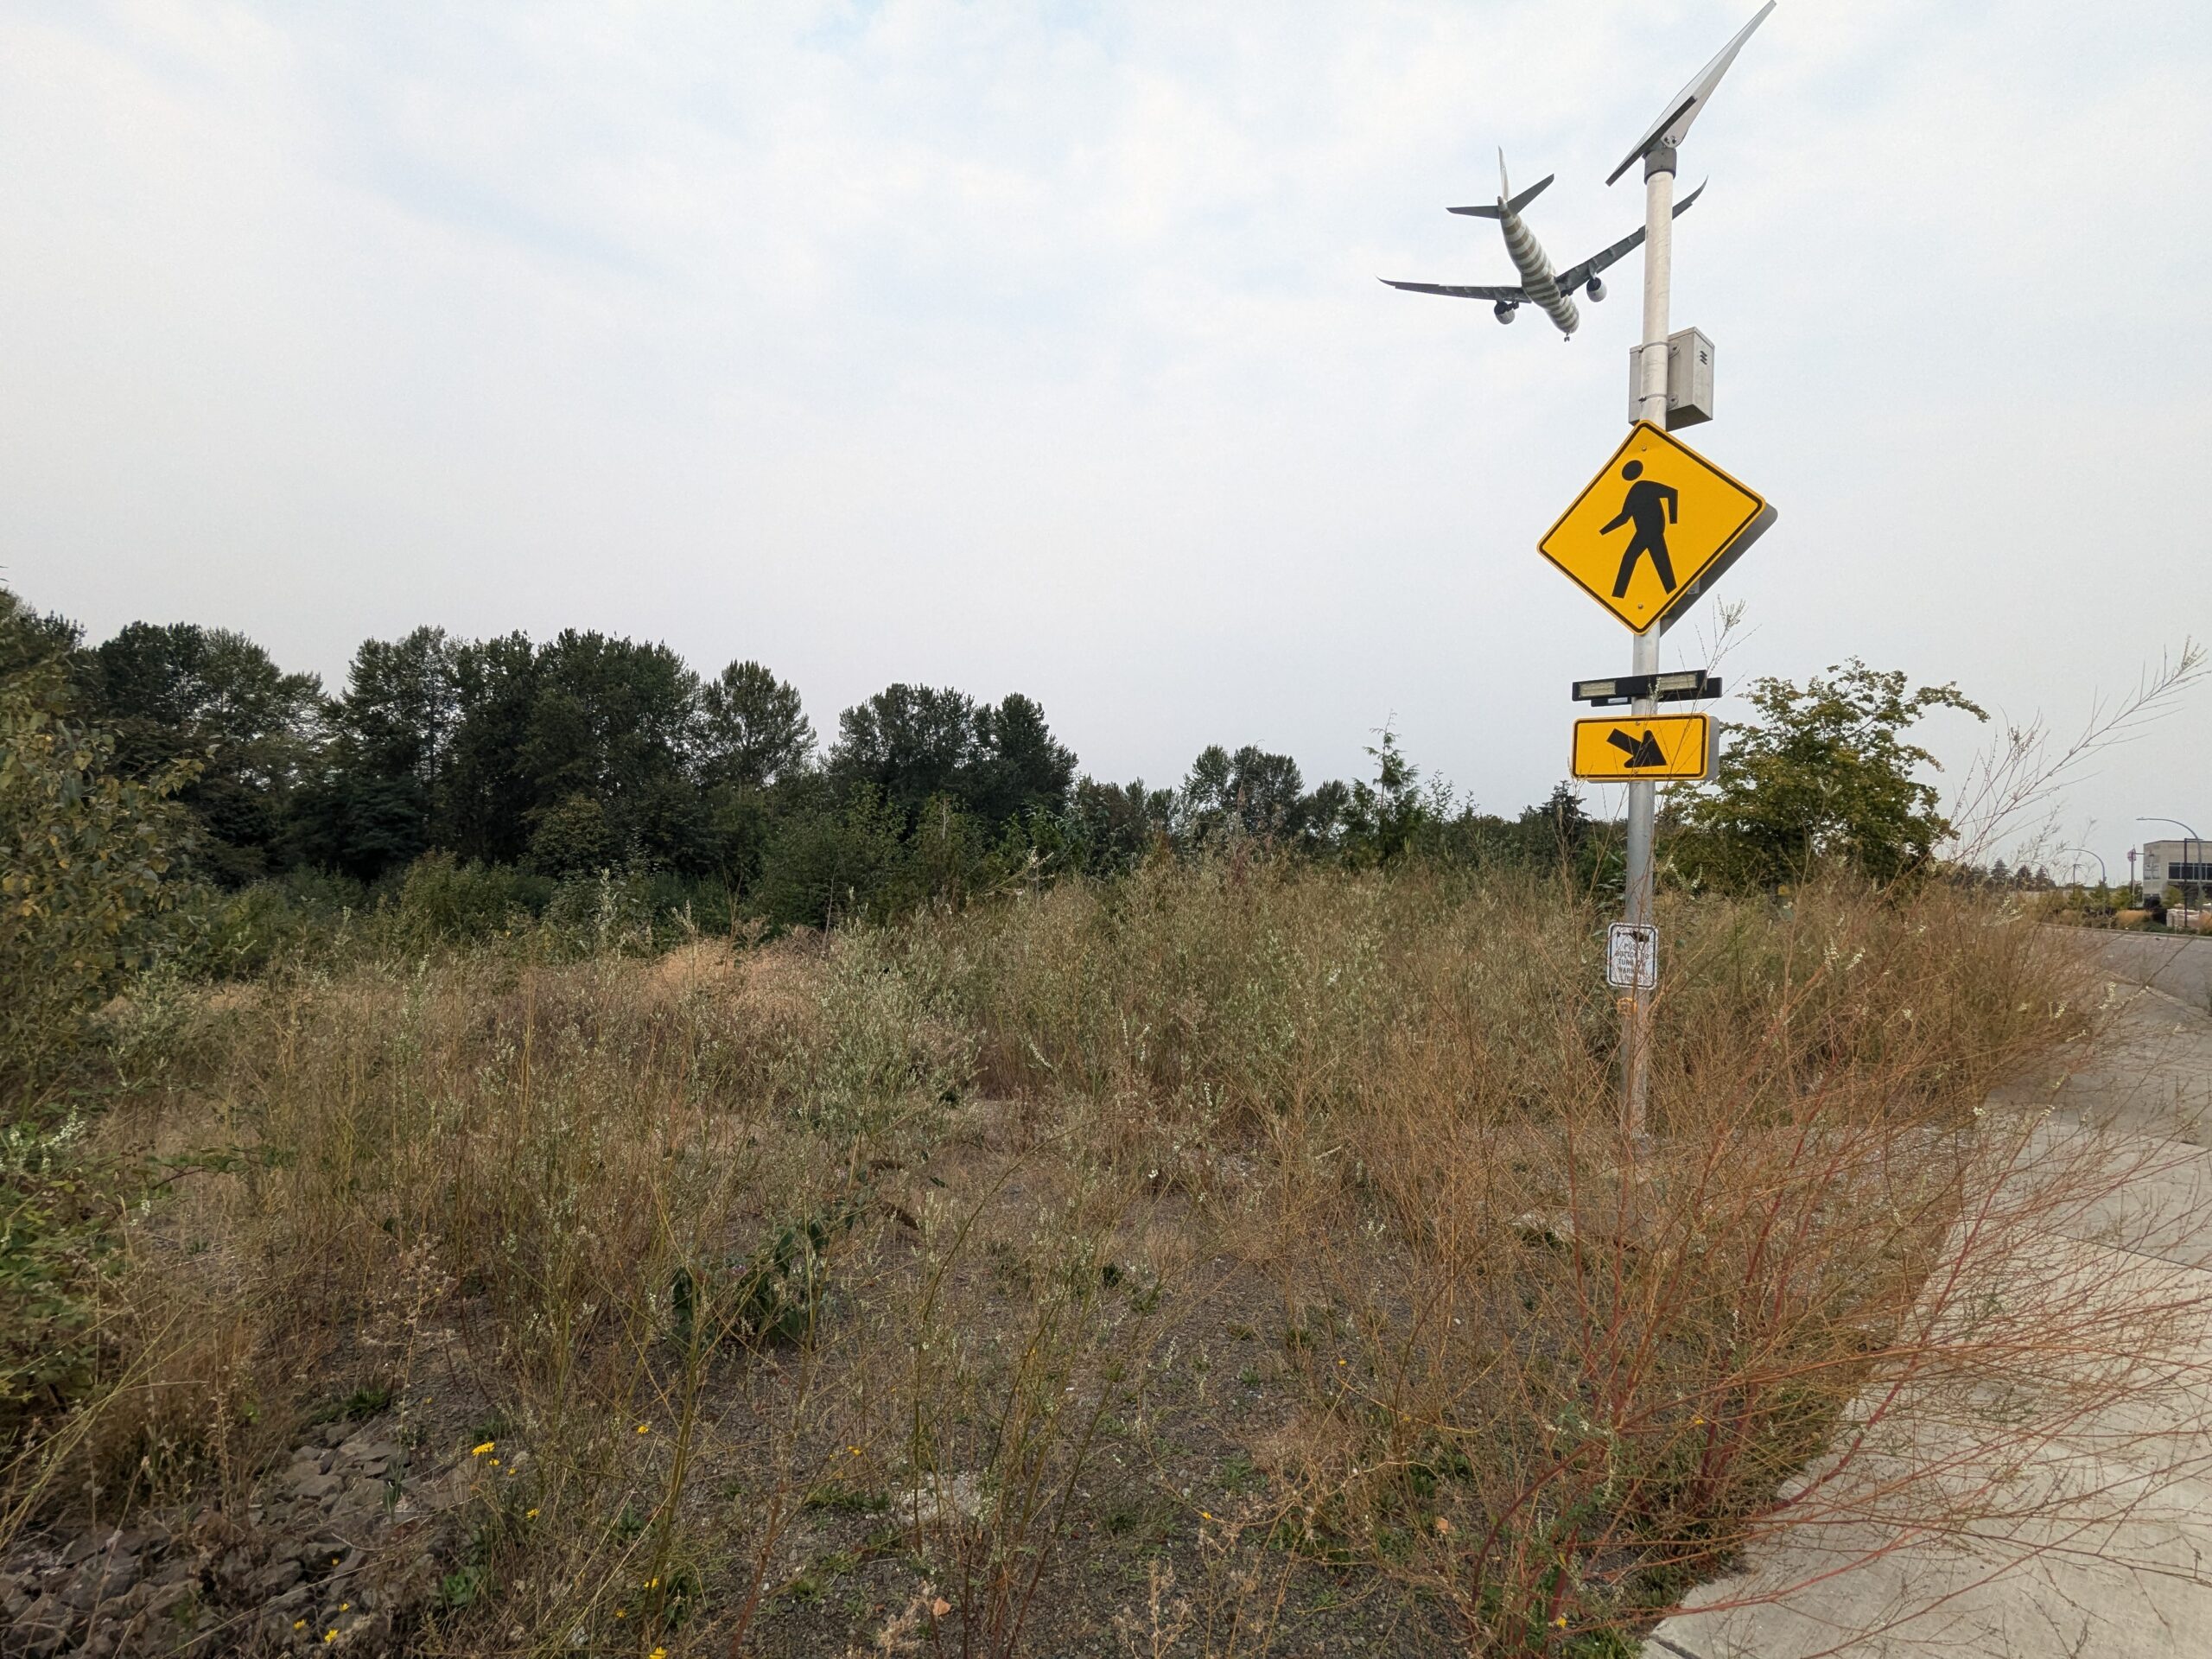
Commercial Aircraft On Approach Near Pedestrian Crossing Sign
A commercial jet aircraft is visible on low final approach over an undeveloped, overgrown lot adjacent to a road. A yellow pedestrian crossing warning sign and a secondary yellow caution sign are mounted on a pole in the foreground, consistent with infrastructure near a major airport flight path. -
 2024-09-07
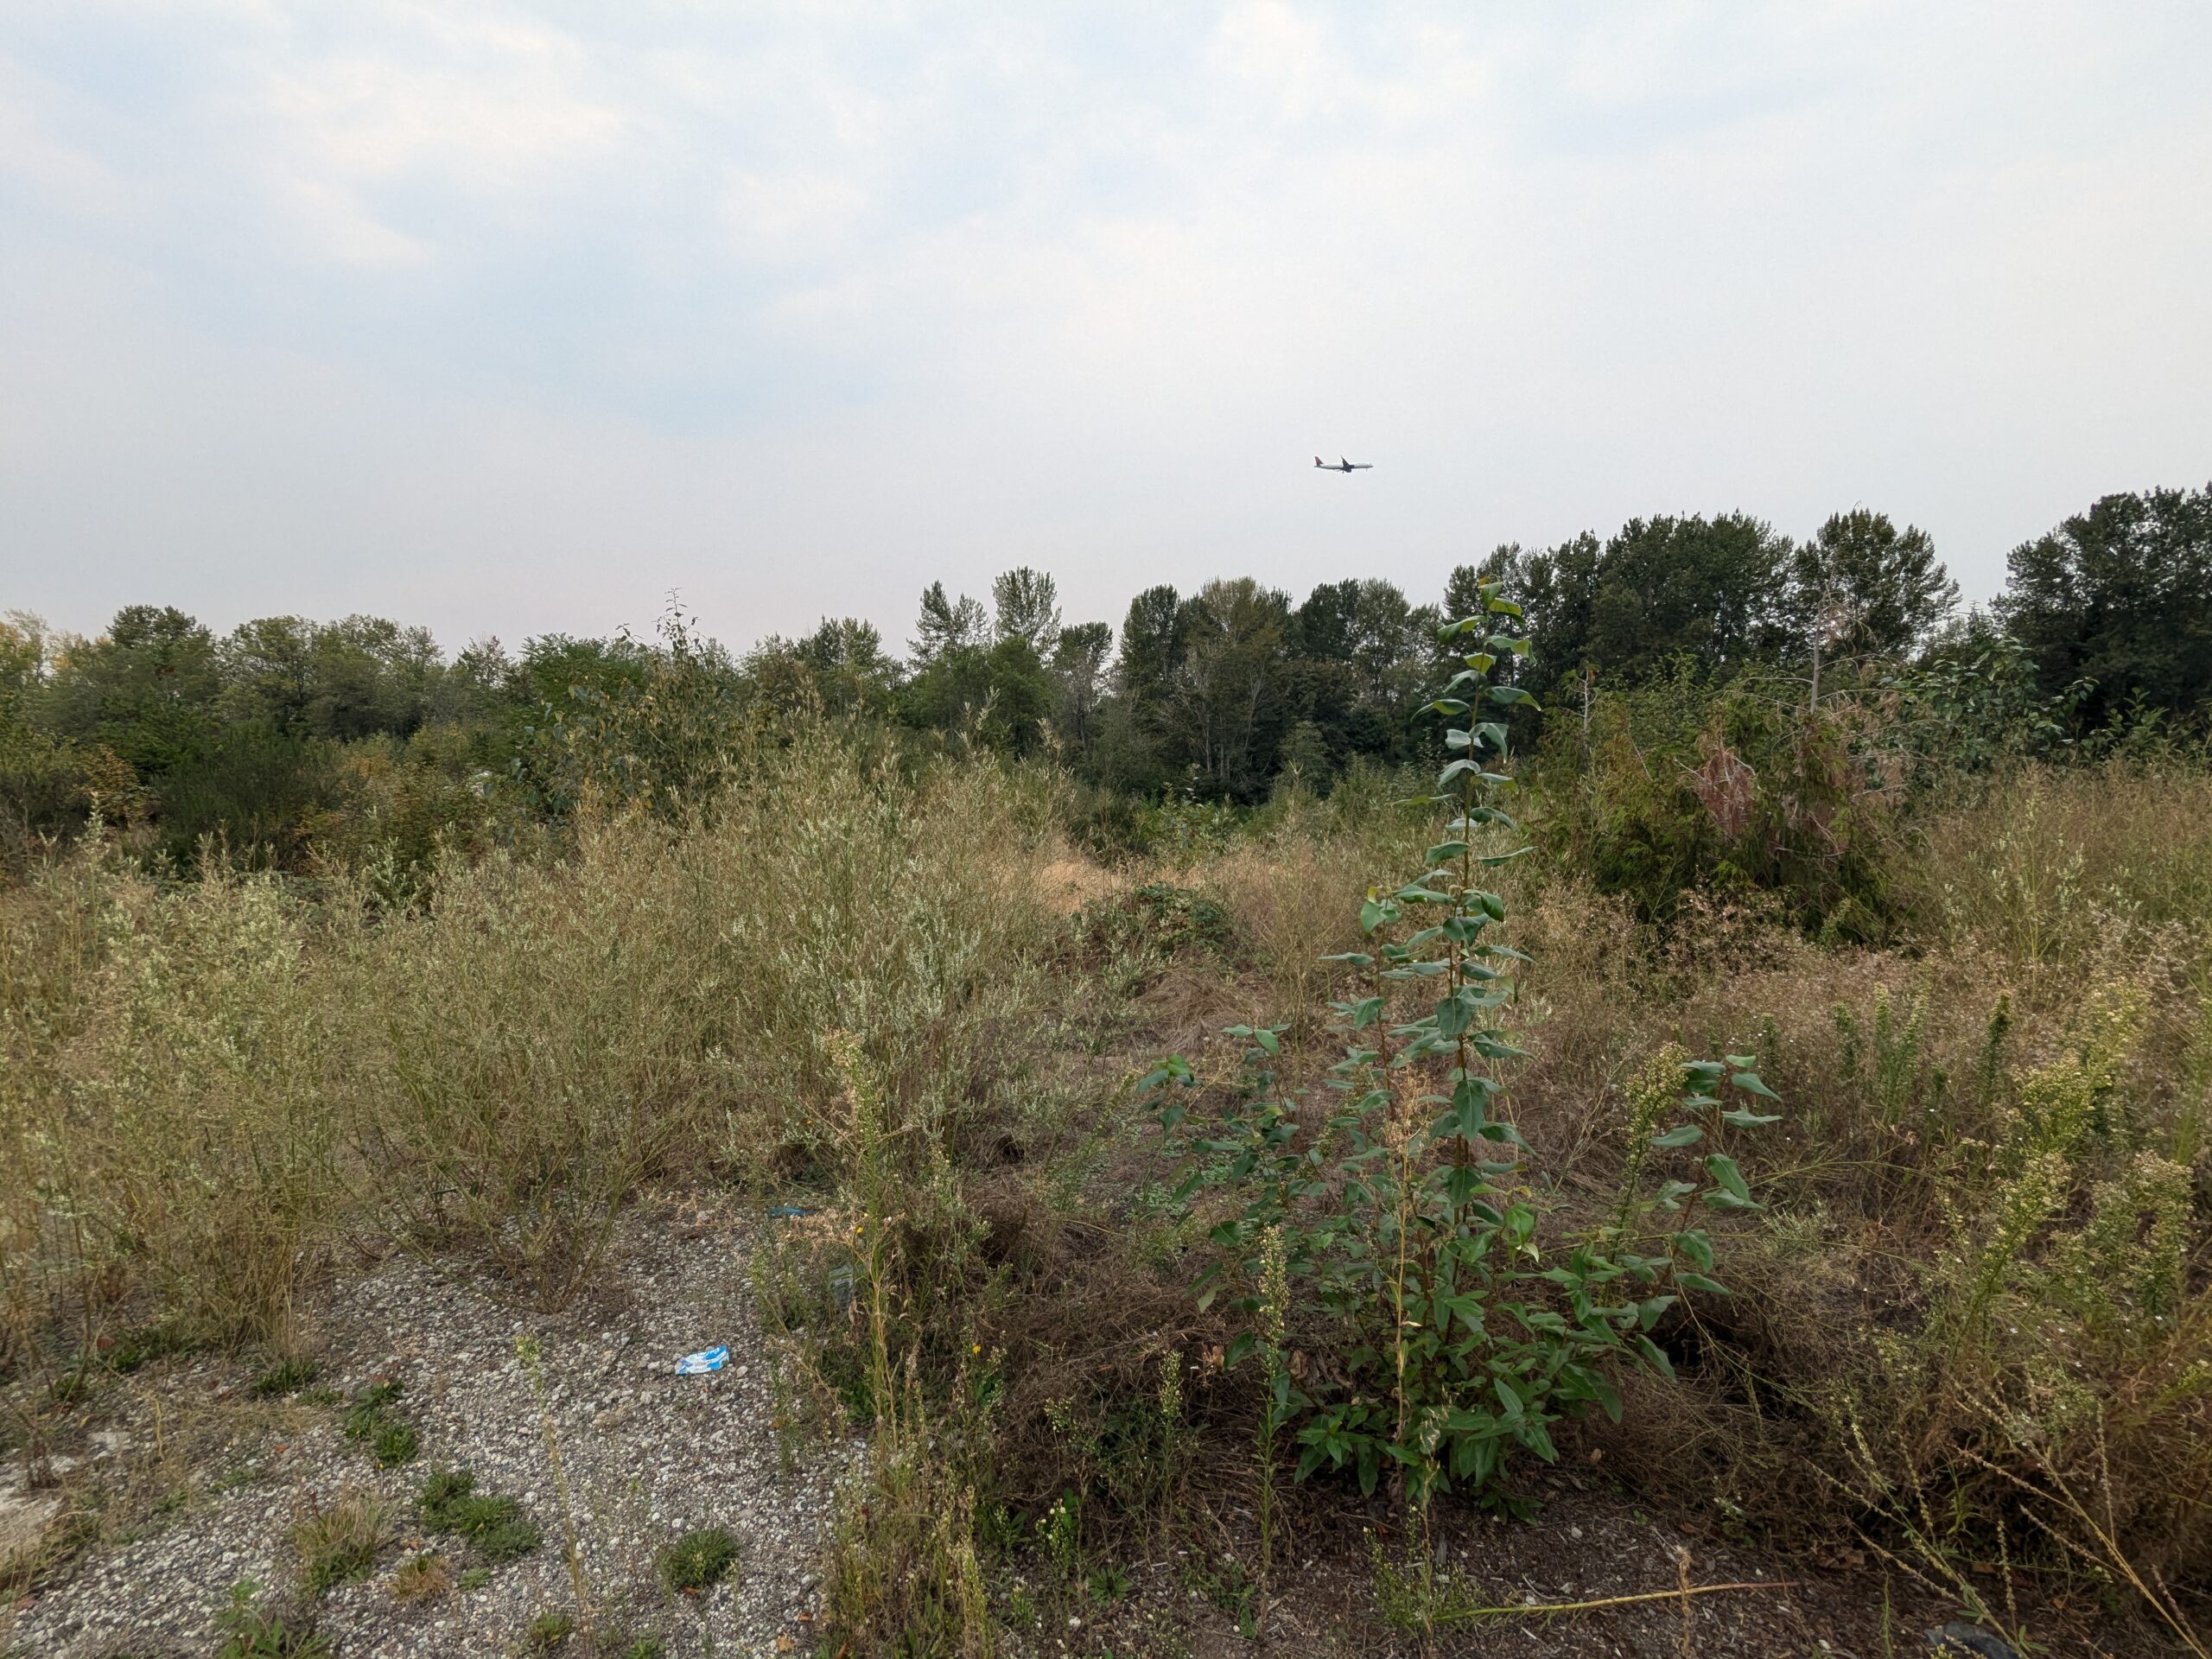
Aircraft On Approach Over Undeveloped Scrubland Near Airport
A commercial aircraft is visible on final approach in the hazy sky above an overgrown, undeveloped parcel with gravel ground cover and scattered shrubs and trees. The proximity of the low-flying aircraft and the disturbed, vacant land character are consistent with property in the flight path corridor near a major airport. -
 2024-09-07
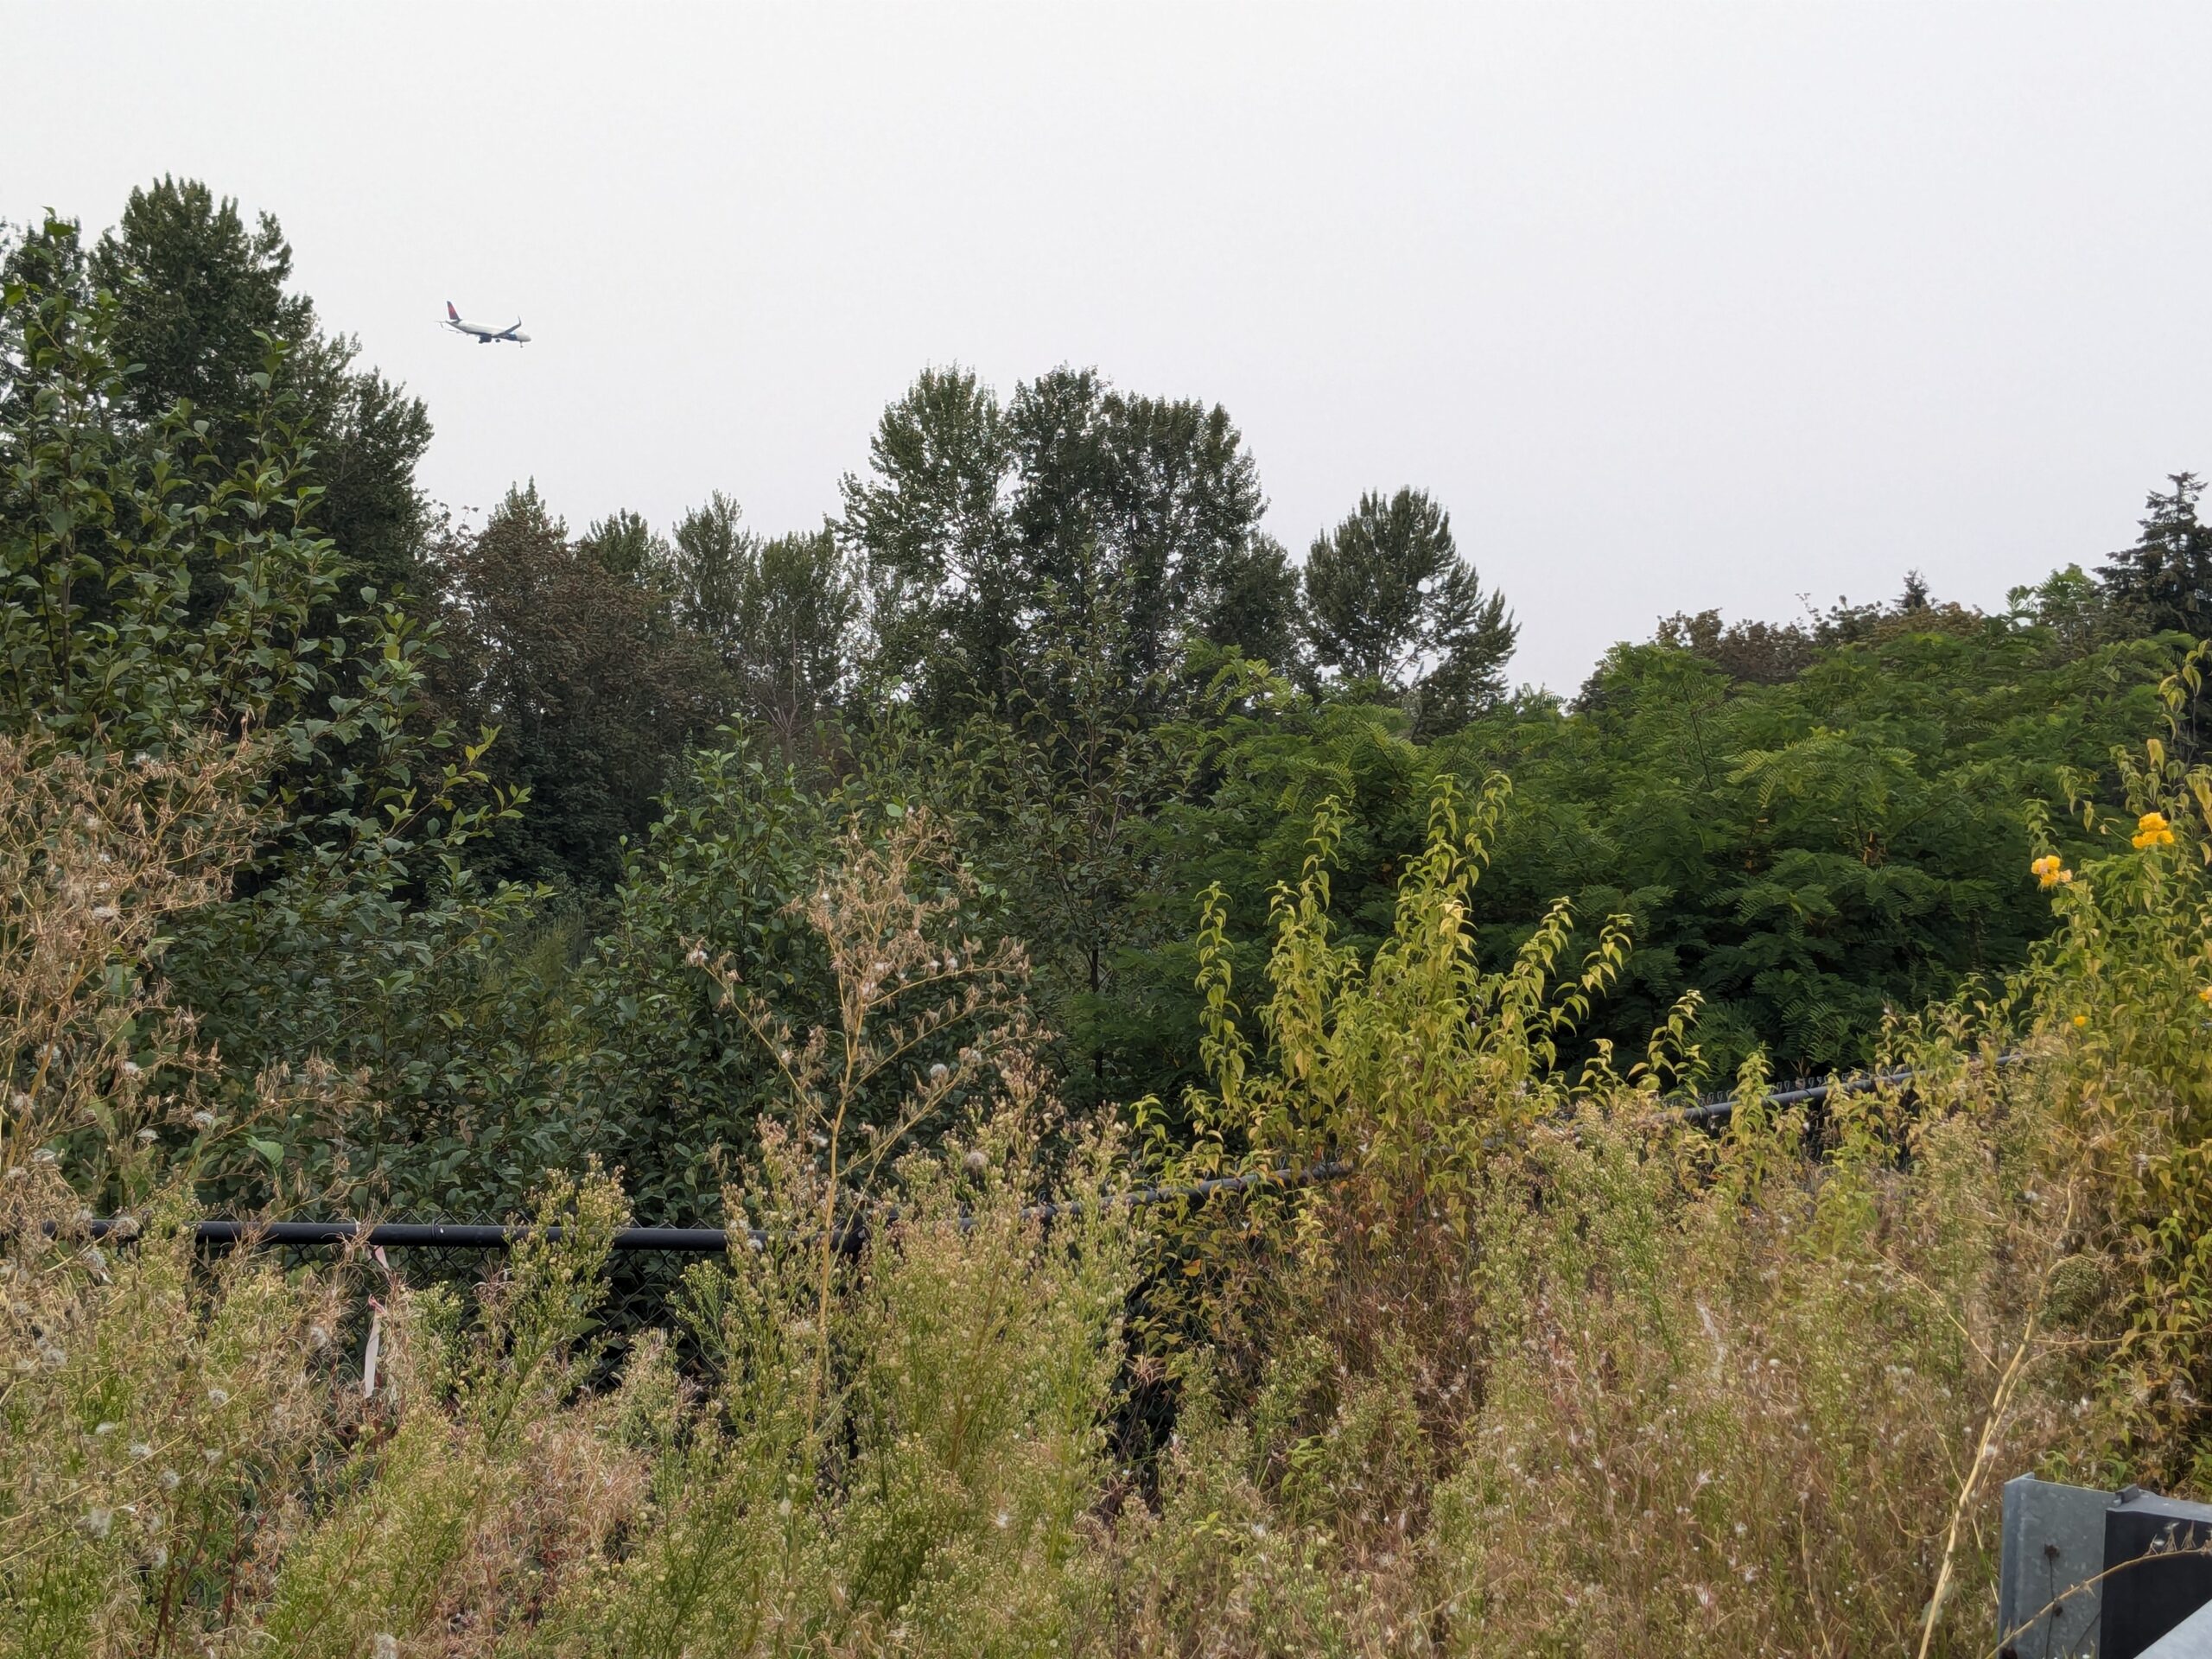
Commercial Aircraft On Approach Over Vegetated Area Near Sea-Tac Airport
A commercial passenger aircraft, appearing to display red livery consistent with an Alaska Airlines or Delta Air Lines livery, is captured on final approach descent above a dense tree line and overgrown vegetation. A guardrail is visible in the foreground, suggesting the photo was taken from a roadside or elevated embankment in the airport vicinity. -
 2024-09-07
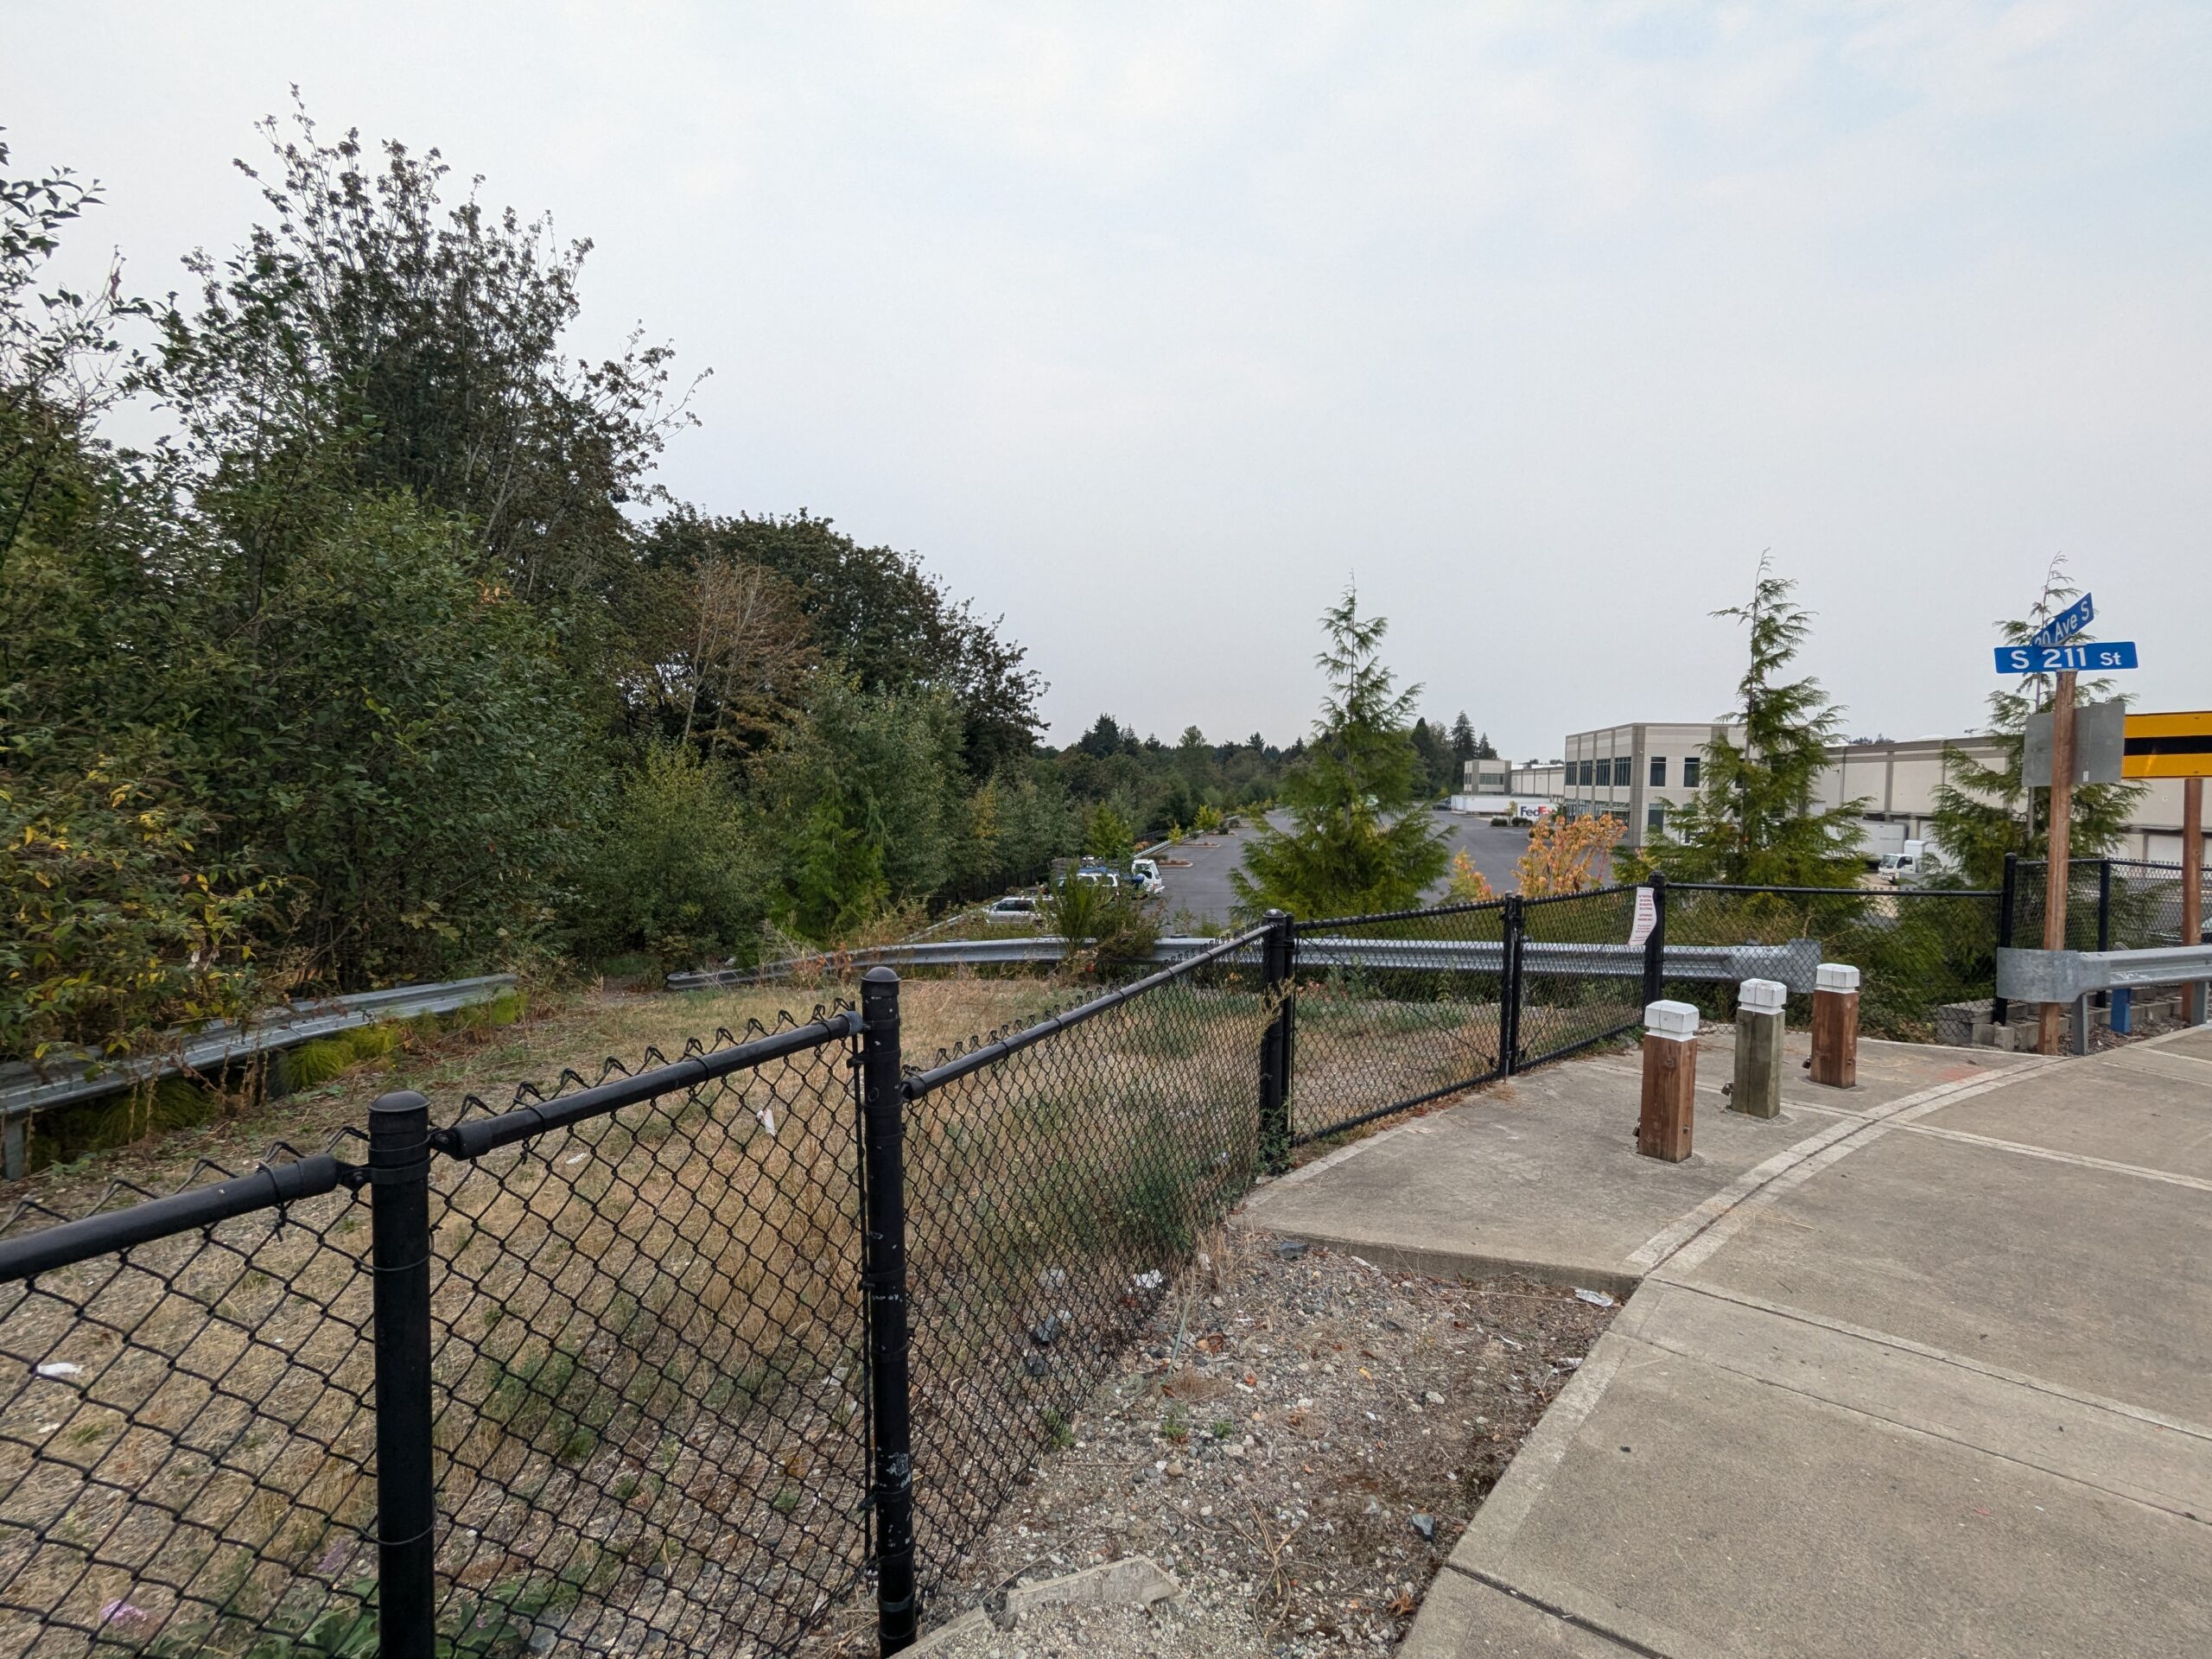
S 211th Street intersection near Sea-Tac Airport industrial area
View from a pedestrian path at the intersection of S 211th Street and an avenue (partially visible street sign), showing a chain-link fence, undeveloped vegetated land, and a commercial/industrial building with a FedEx vehicle visible in the background. The area is consistent with the industrial zone near Seattle-Tacoma International Airport. -
 2024-09-05
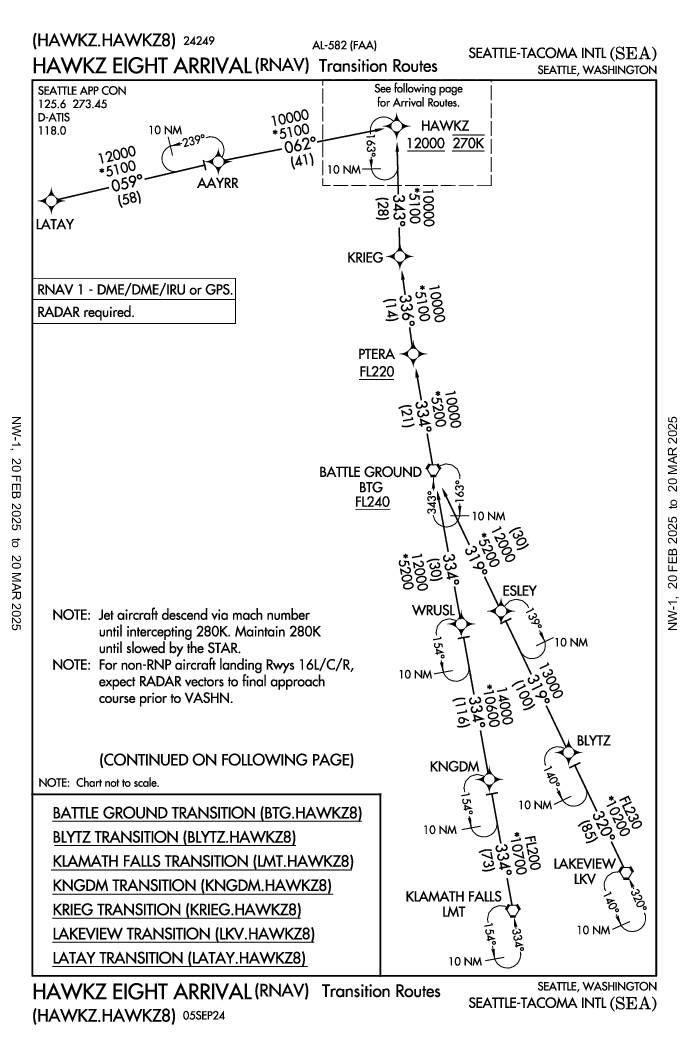
HAWKZ Eight Arrival (RNAV) — Transition Routes, Seattle-Tacoma International Airport
The HAWKZ Eight Arrival (HAWKZ8) is a standard terminal arrival route (STAR) used to guide aircraft into Seattle-Tacoma International Airport (SEA) from multiple directions, including transitions from waypoints such as Battle Ground, Klamath Falls, and Lakeview. The procedure requires RNAV 1 capability (DME/DME/IRU or GPS) and radar, and directs jet aircraft to descend via Mach number until intercepting 280 knots. Aircraft follow a series of waypoints and altitude restrictions, ultimately converging at the HAWKZ fix at 12,000 feet and 270 knots before continuing to the airport.