TagPart 150(269)
-
 2018-01-01
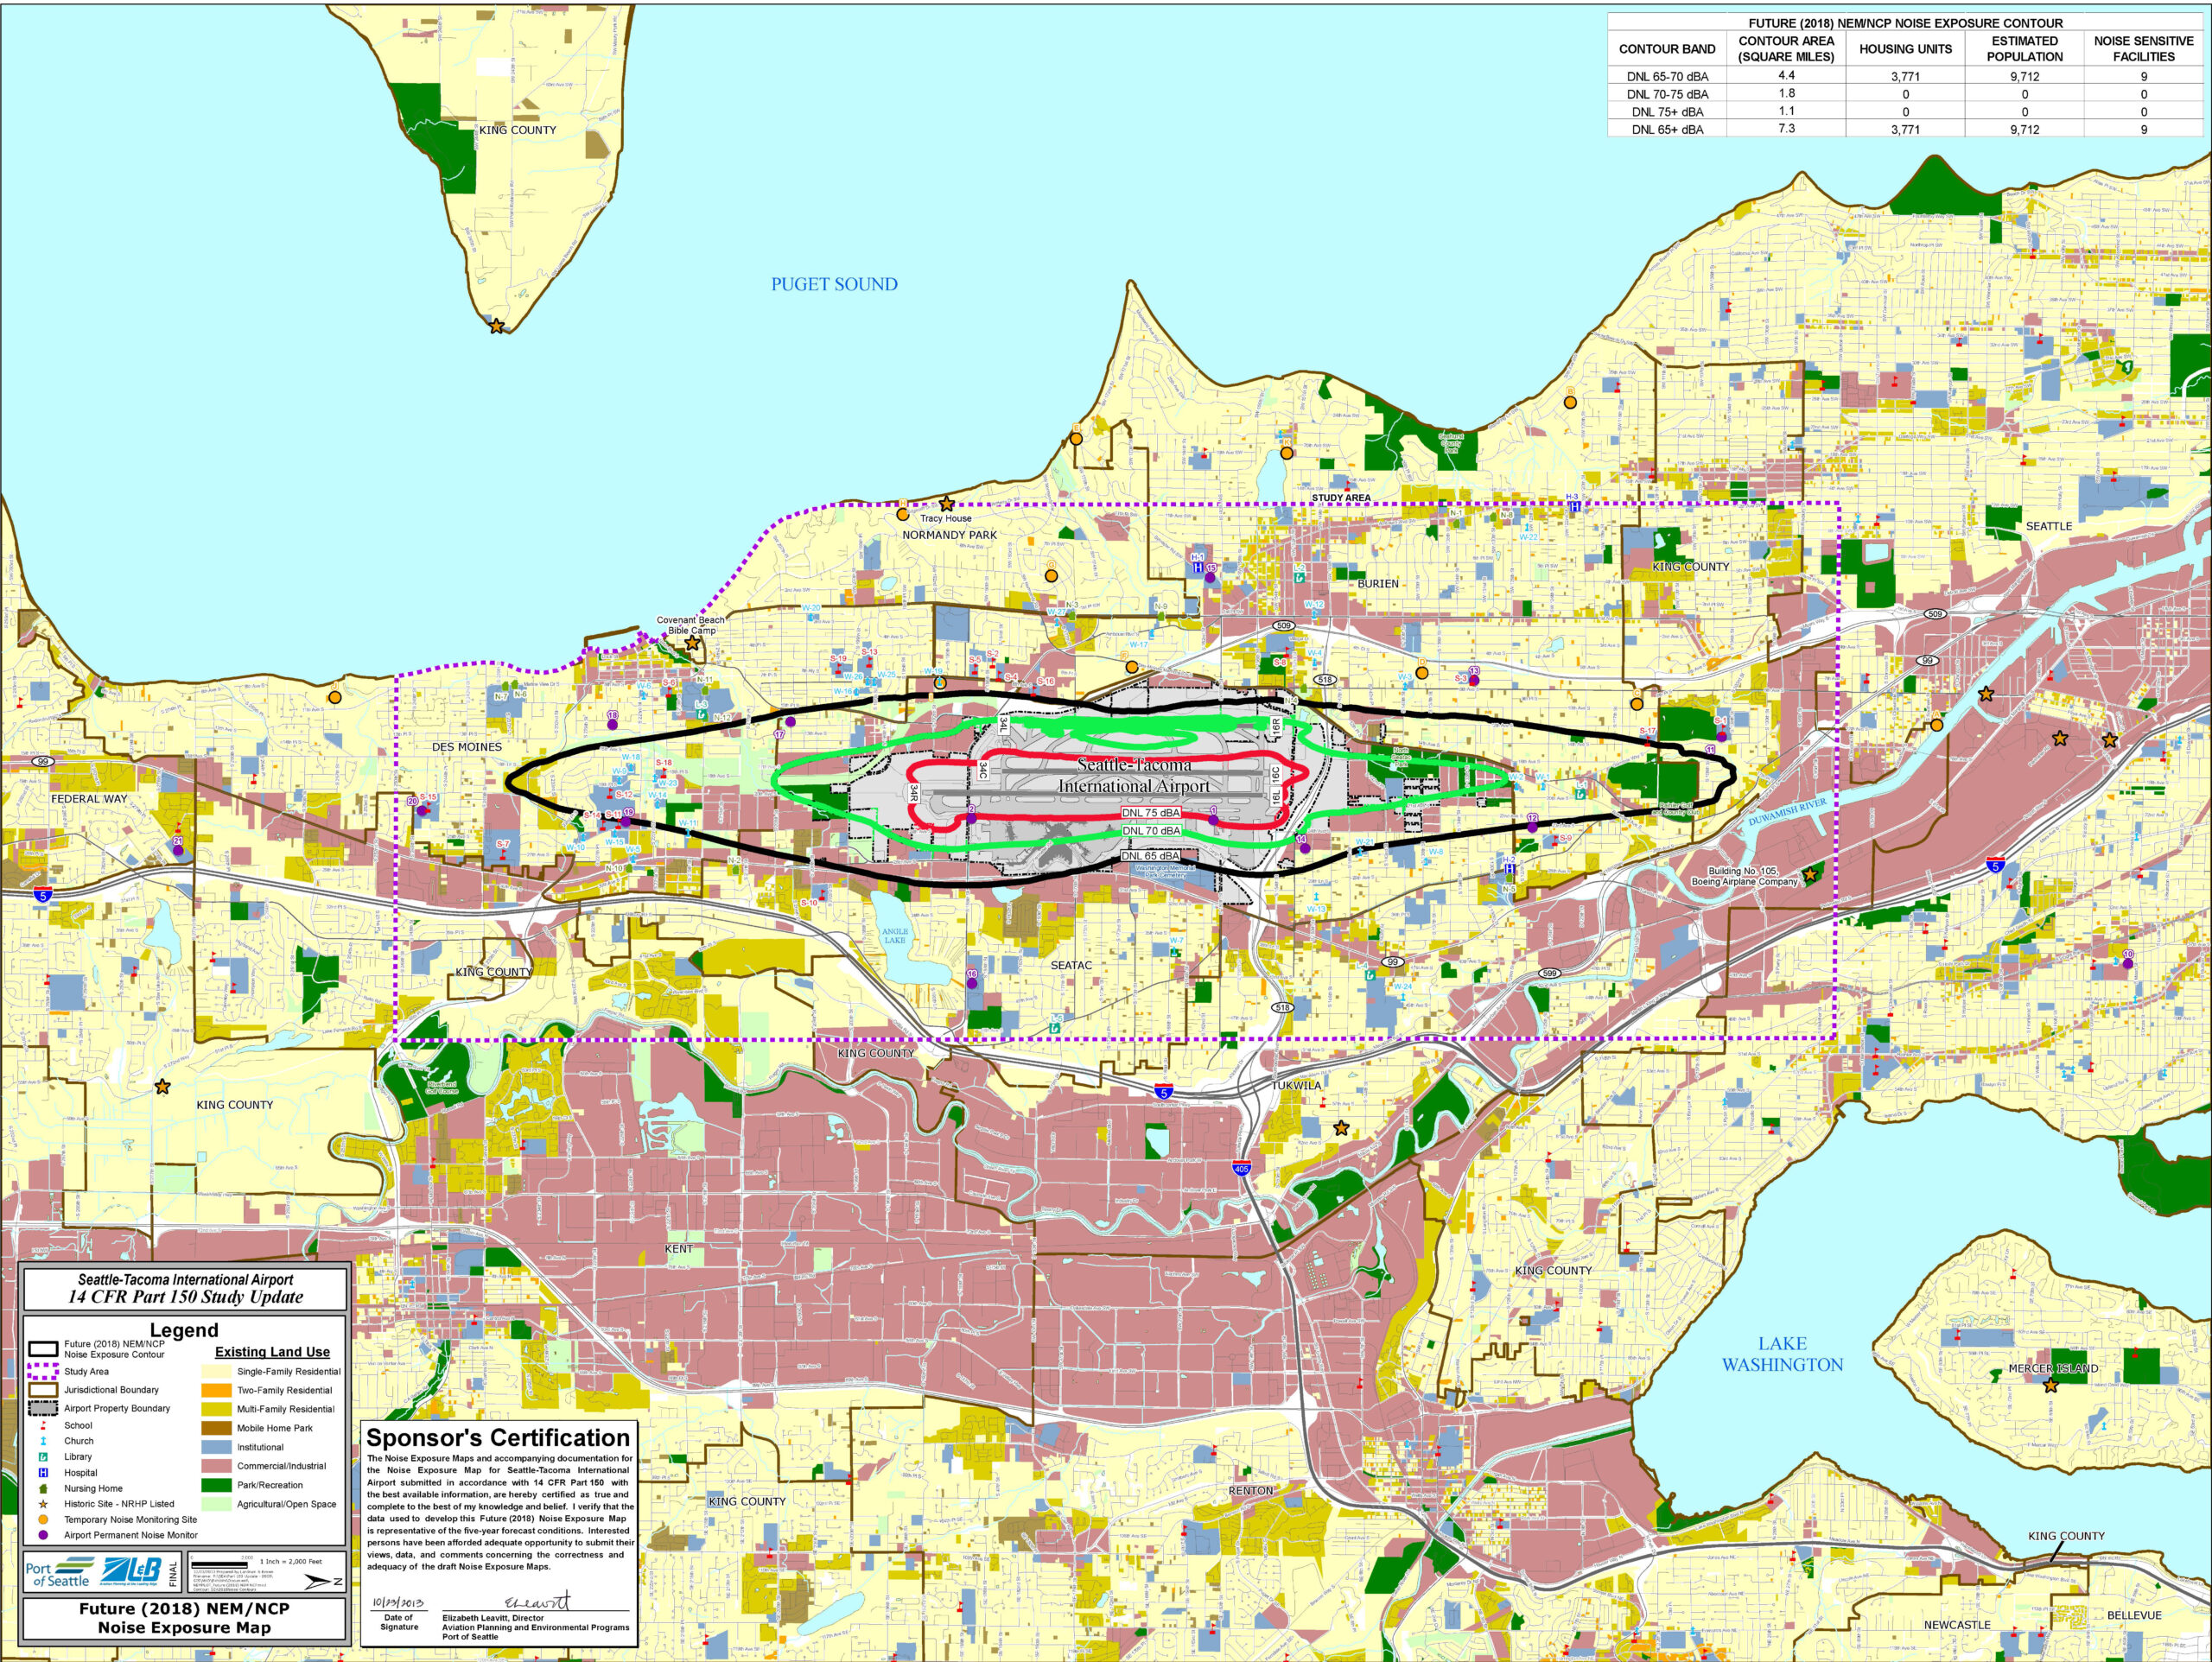
Part 150 2013 Noise Exposure Map NEM PLOT Future 2018
This is the Future (2018) Noise Exposure Map (NEM/NCP) for Seattle-Tacoma International Airport, produced as part of a 14 CFR Part 150 Study Update by the Port of Seattle. The map displays DNL noise contour bands (65–70, 70–75, and 75+ dBA) overlaid on surrounding land uses, with a data table showing the DNL 65–70 dBA contour covering 4.4 square miles and affecting an estimated 9,712 people; it includes a Sponsor's Certification signed by Elizabeth Leavitt, Director of Aviation Planning and Environmental Programs for the Port of Seattle. -
 2018-01-01
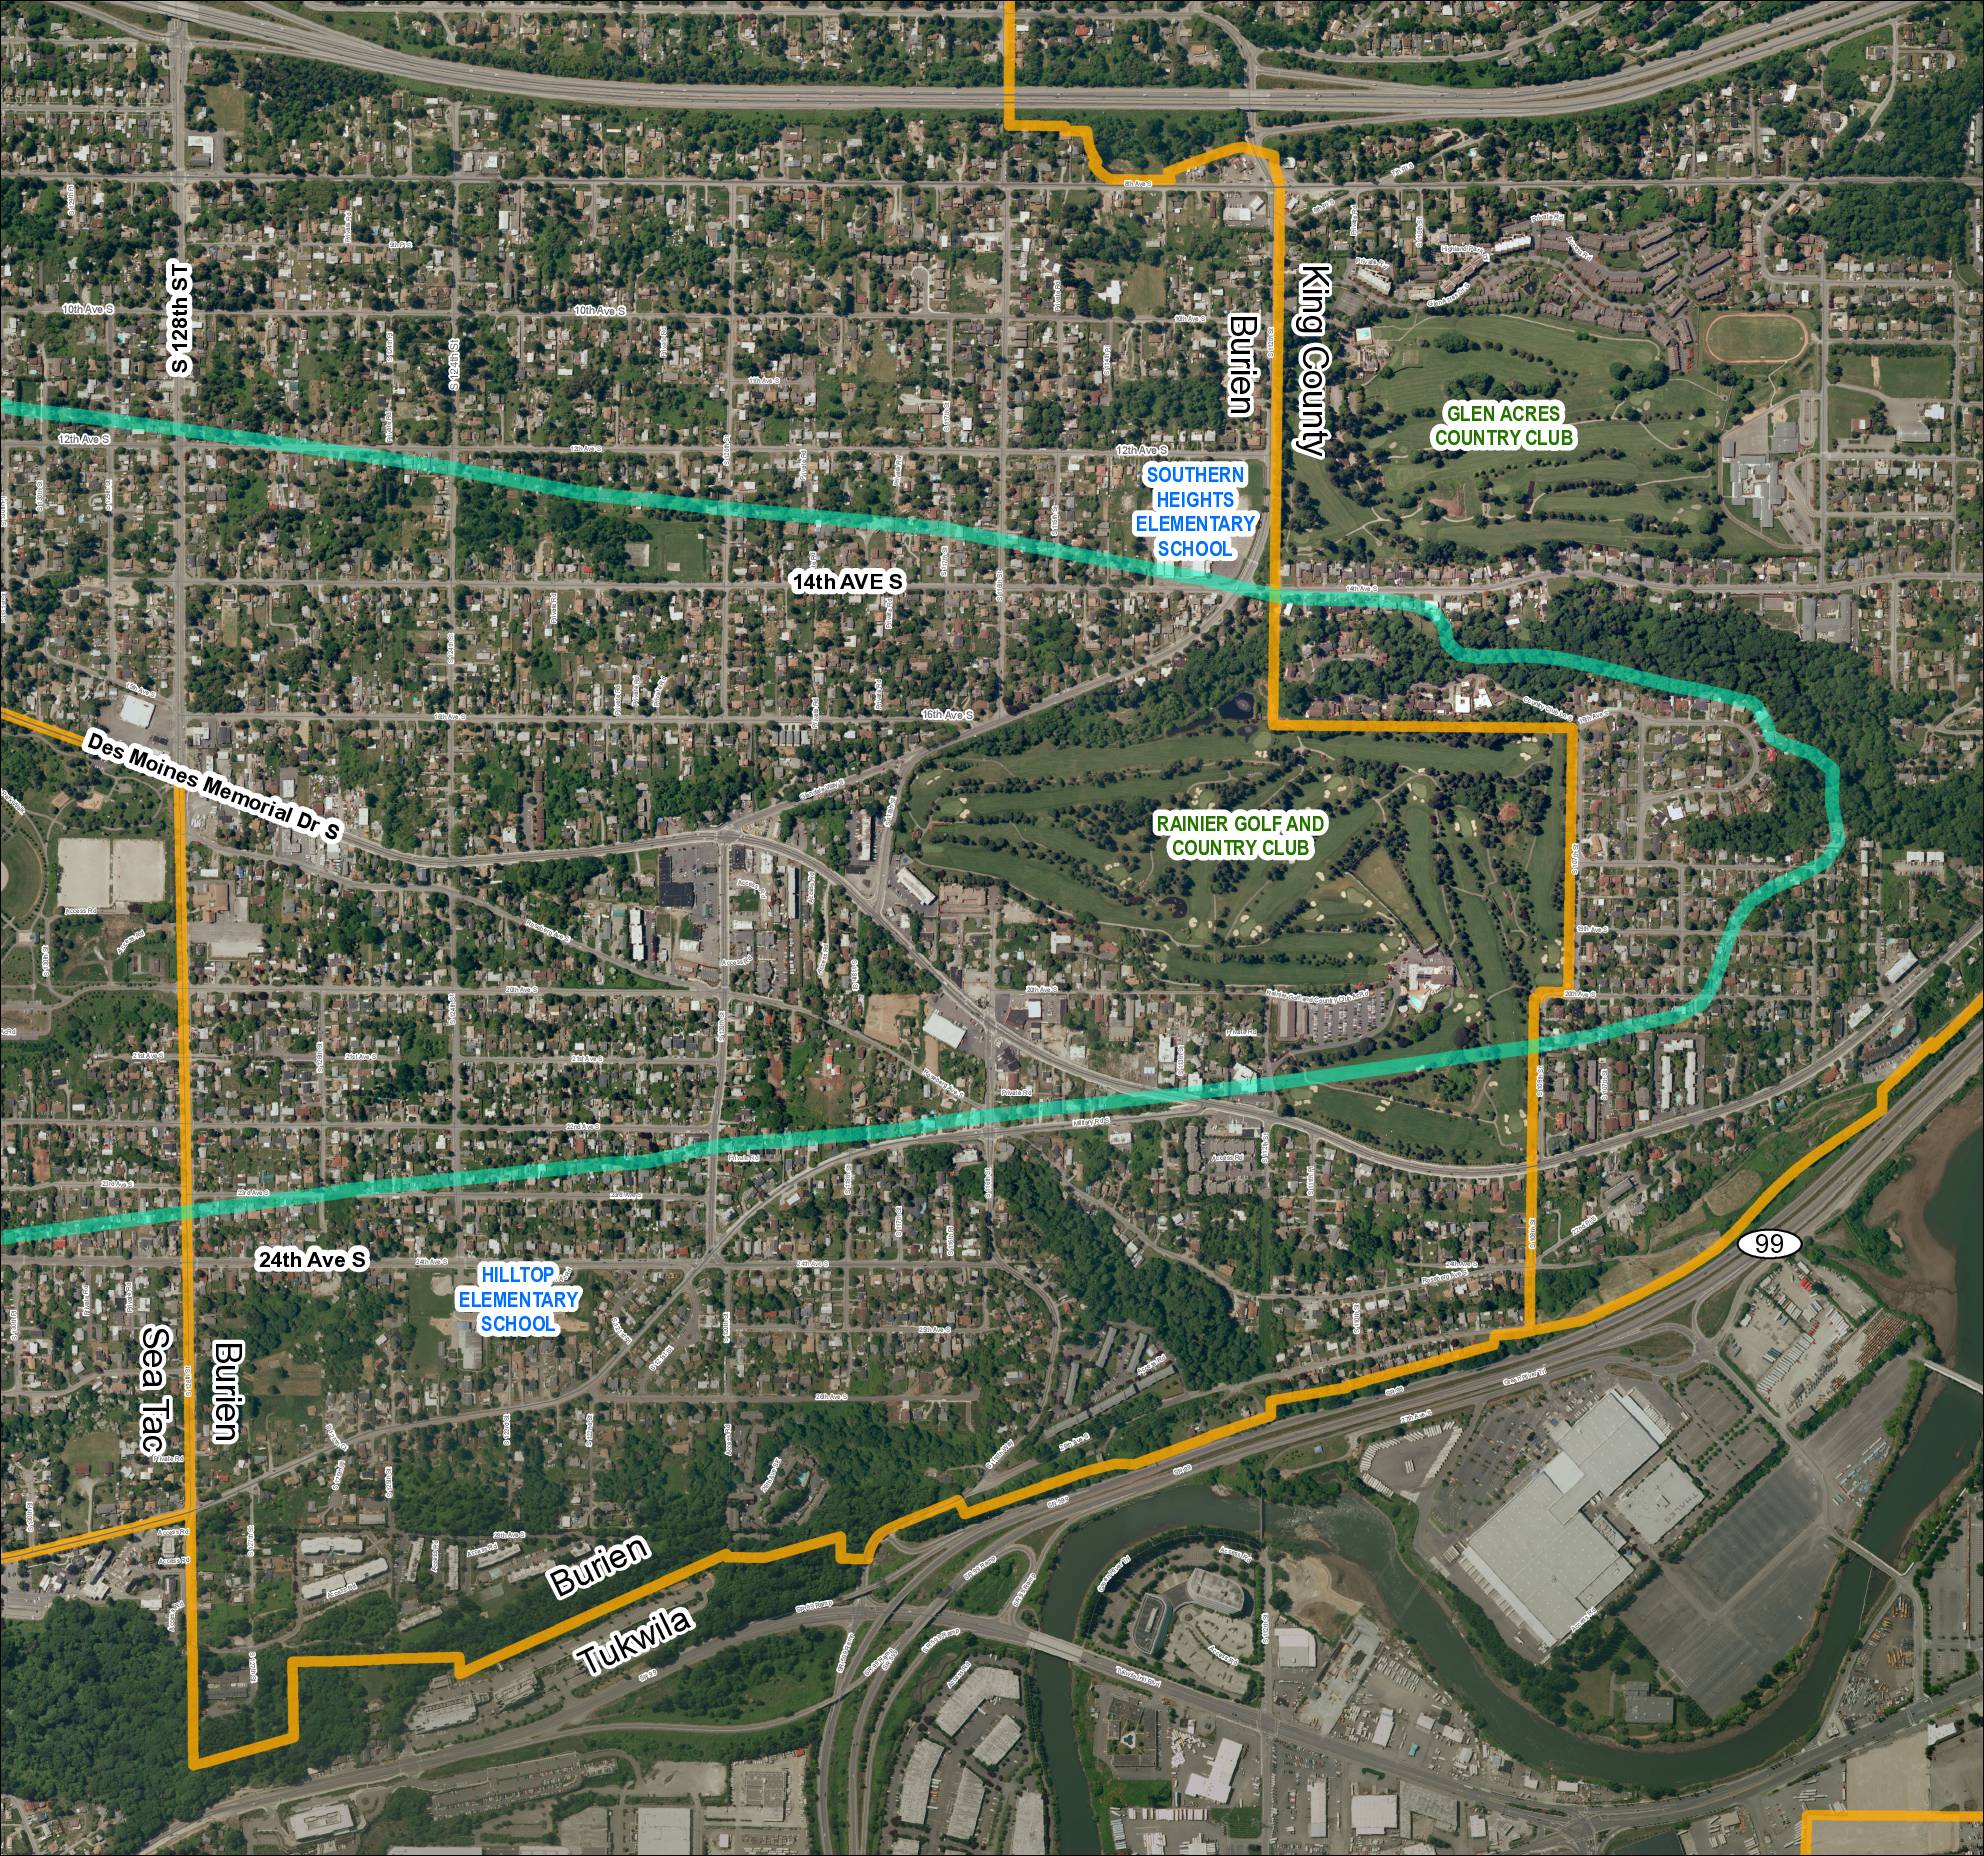
Grid 5: Sea-Tac Airport Area Map (2018)
This aerial map covers the residential and commercial areas surrounding Sea-Tac Airport, spanning portions of Burien, SeaTac, Tukwila, and unincorporated King County. It highlights key landmarks including Southern Heights Elementary School, Hilltop Elementary School, Rainier Golf and Country Club, and Glen Acres Country Club, along with major roadways such as SR 99, SR 599, Des Moines Memorial Drive S, and Military Road S. Turquoise boundary lines appear to delineate specific noise impact or study zones relevant to airport policy planning in the region. -
 2018-01-01
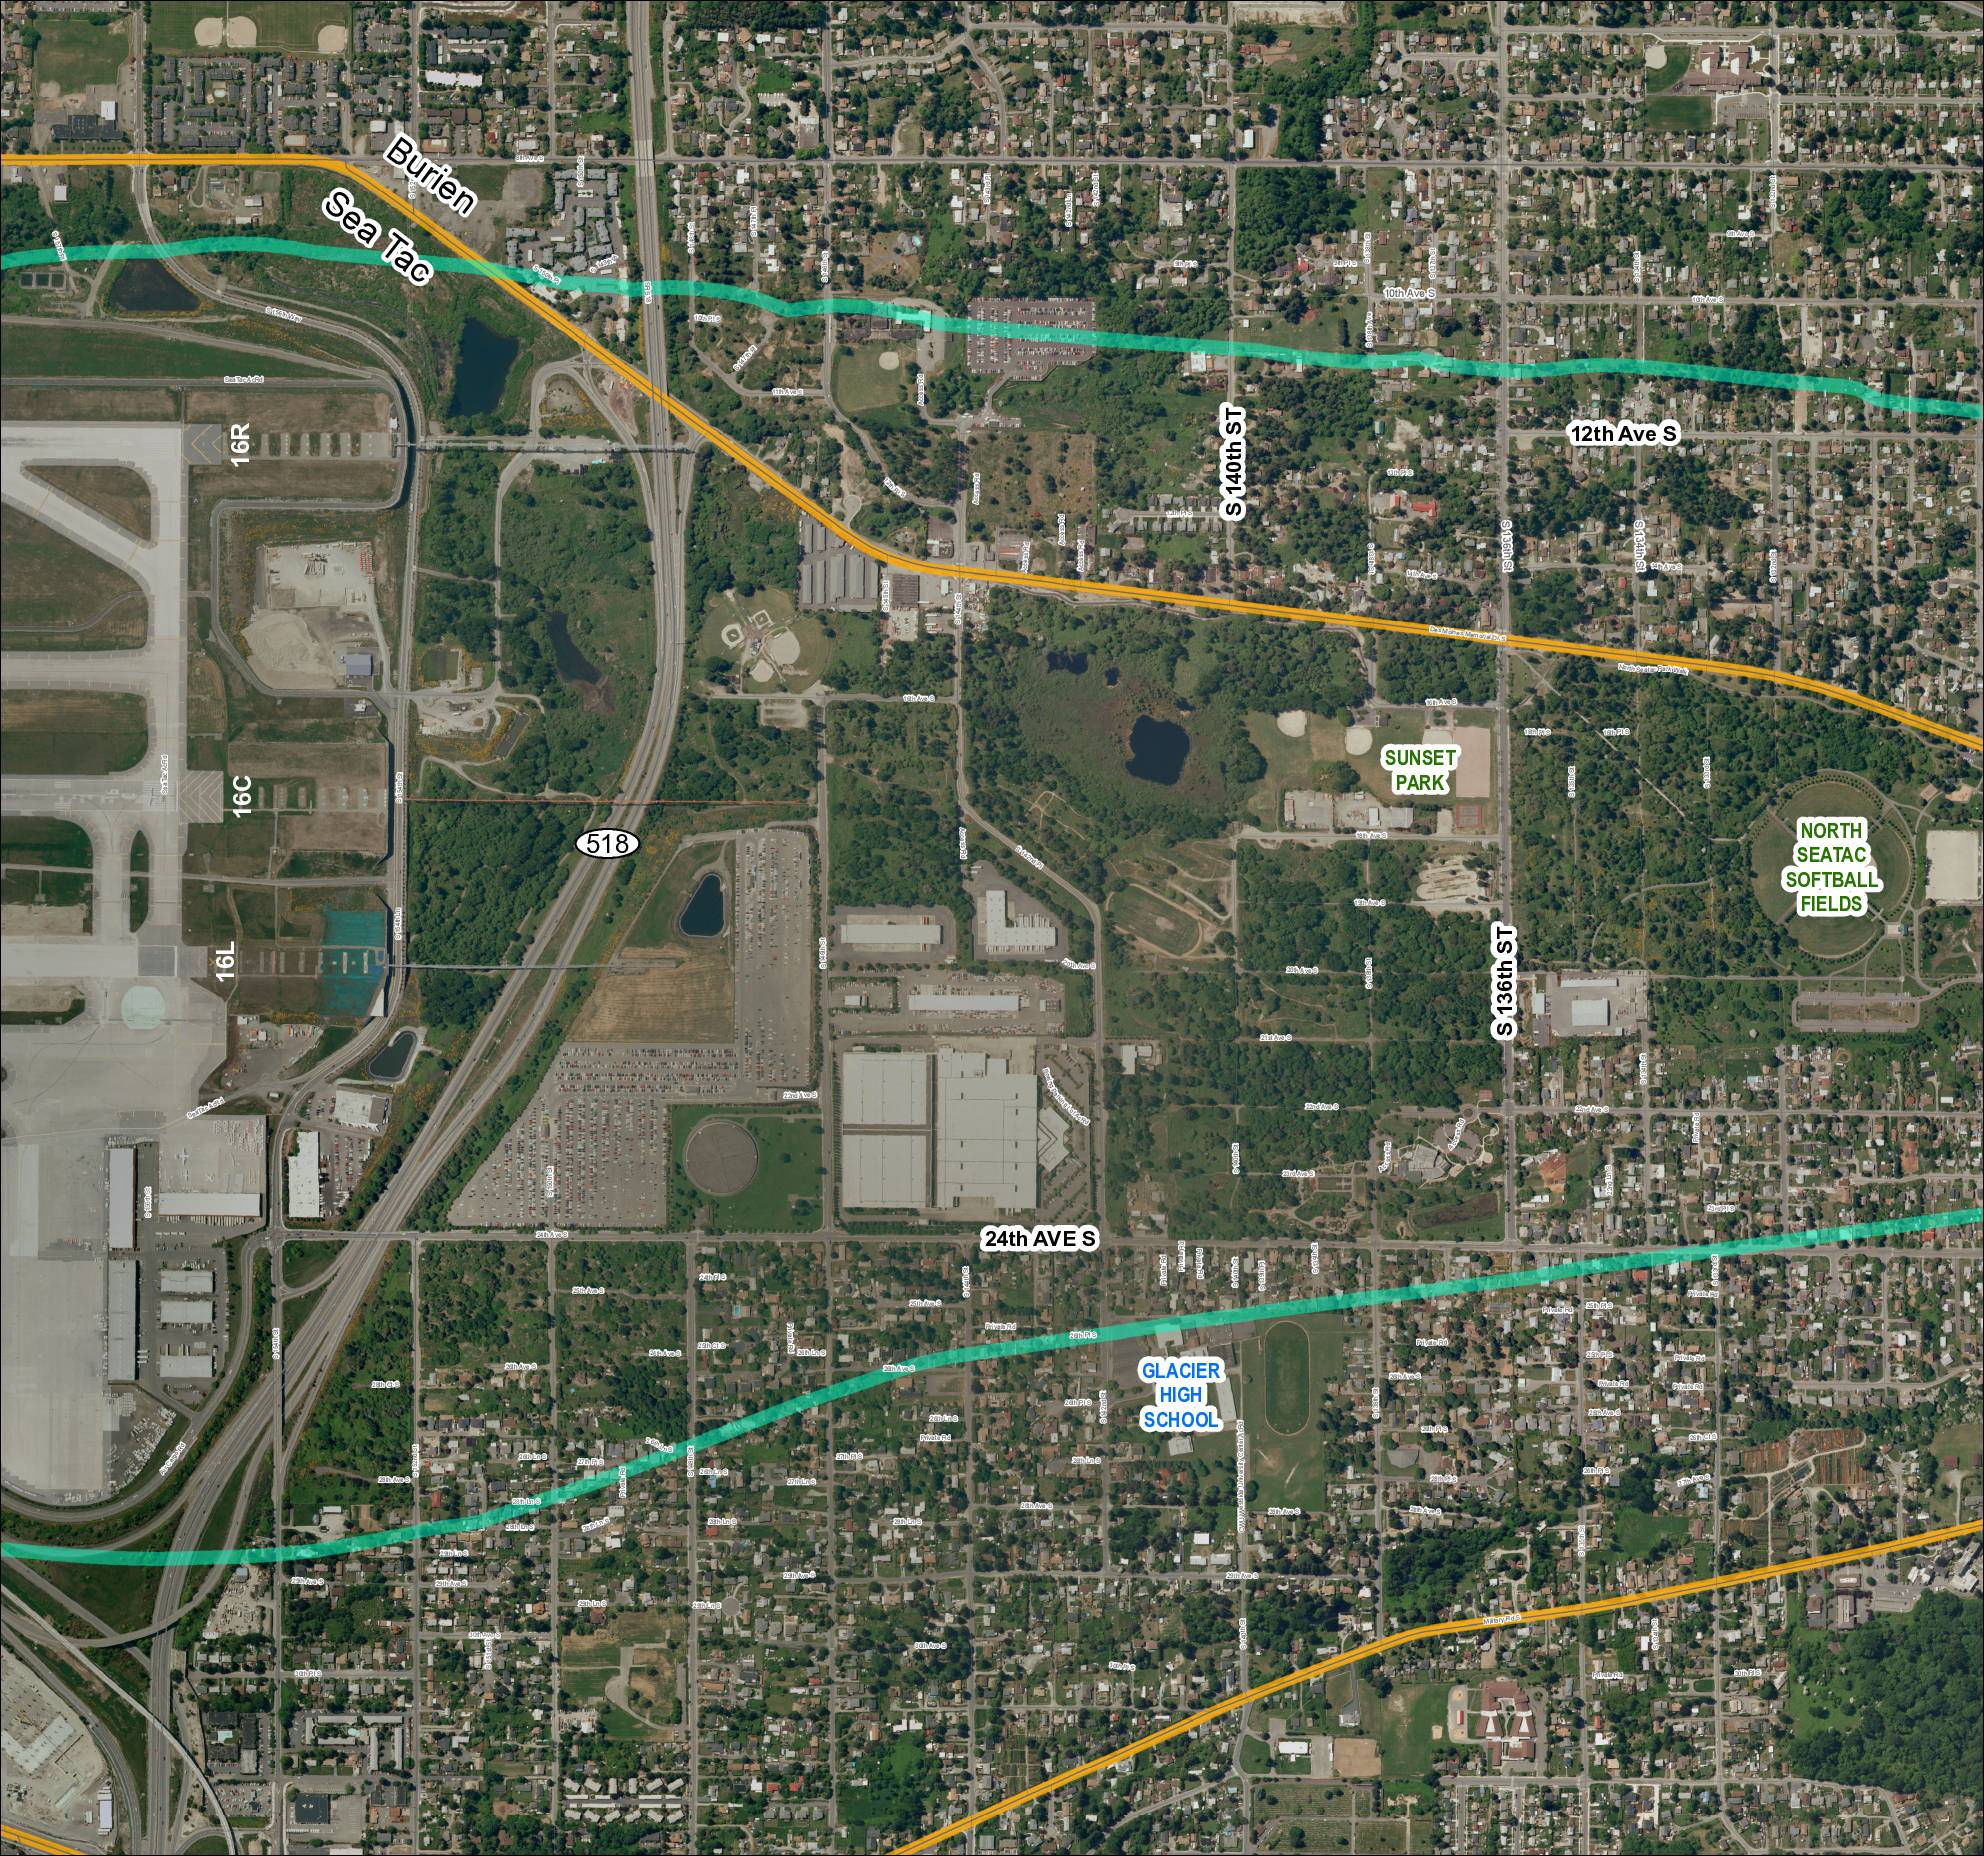
Grid 4 (2018): Aerial Map of Sea-Tac Area Including Glacier High School, Sunset Park, and North Sea-Tac Softball Fields
This map depicts the area surrounding Seattle-Tacoma International Airport, showing the airport's runway layout (including runways 16R, 16C, and 16L) alongside nearby neighborhoods in Burien and SeaTac. Two overlaid flight-path or noise-contour corridors (shown in teal/green and gold) arc across the surrounding residential and parkland areas, illustrating the geographic extent of aircraft noise impact. Notable landmarks within the affected area include Glacier High School, Sunset Park, and the North SeaTac Softball Fields, highlighting the communities exposed to airport-related noise. -
 2018-01-01
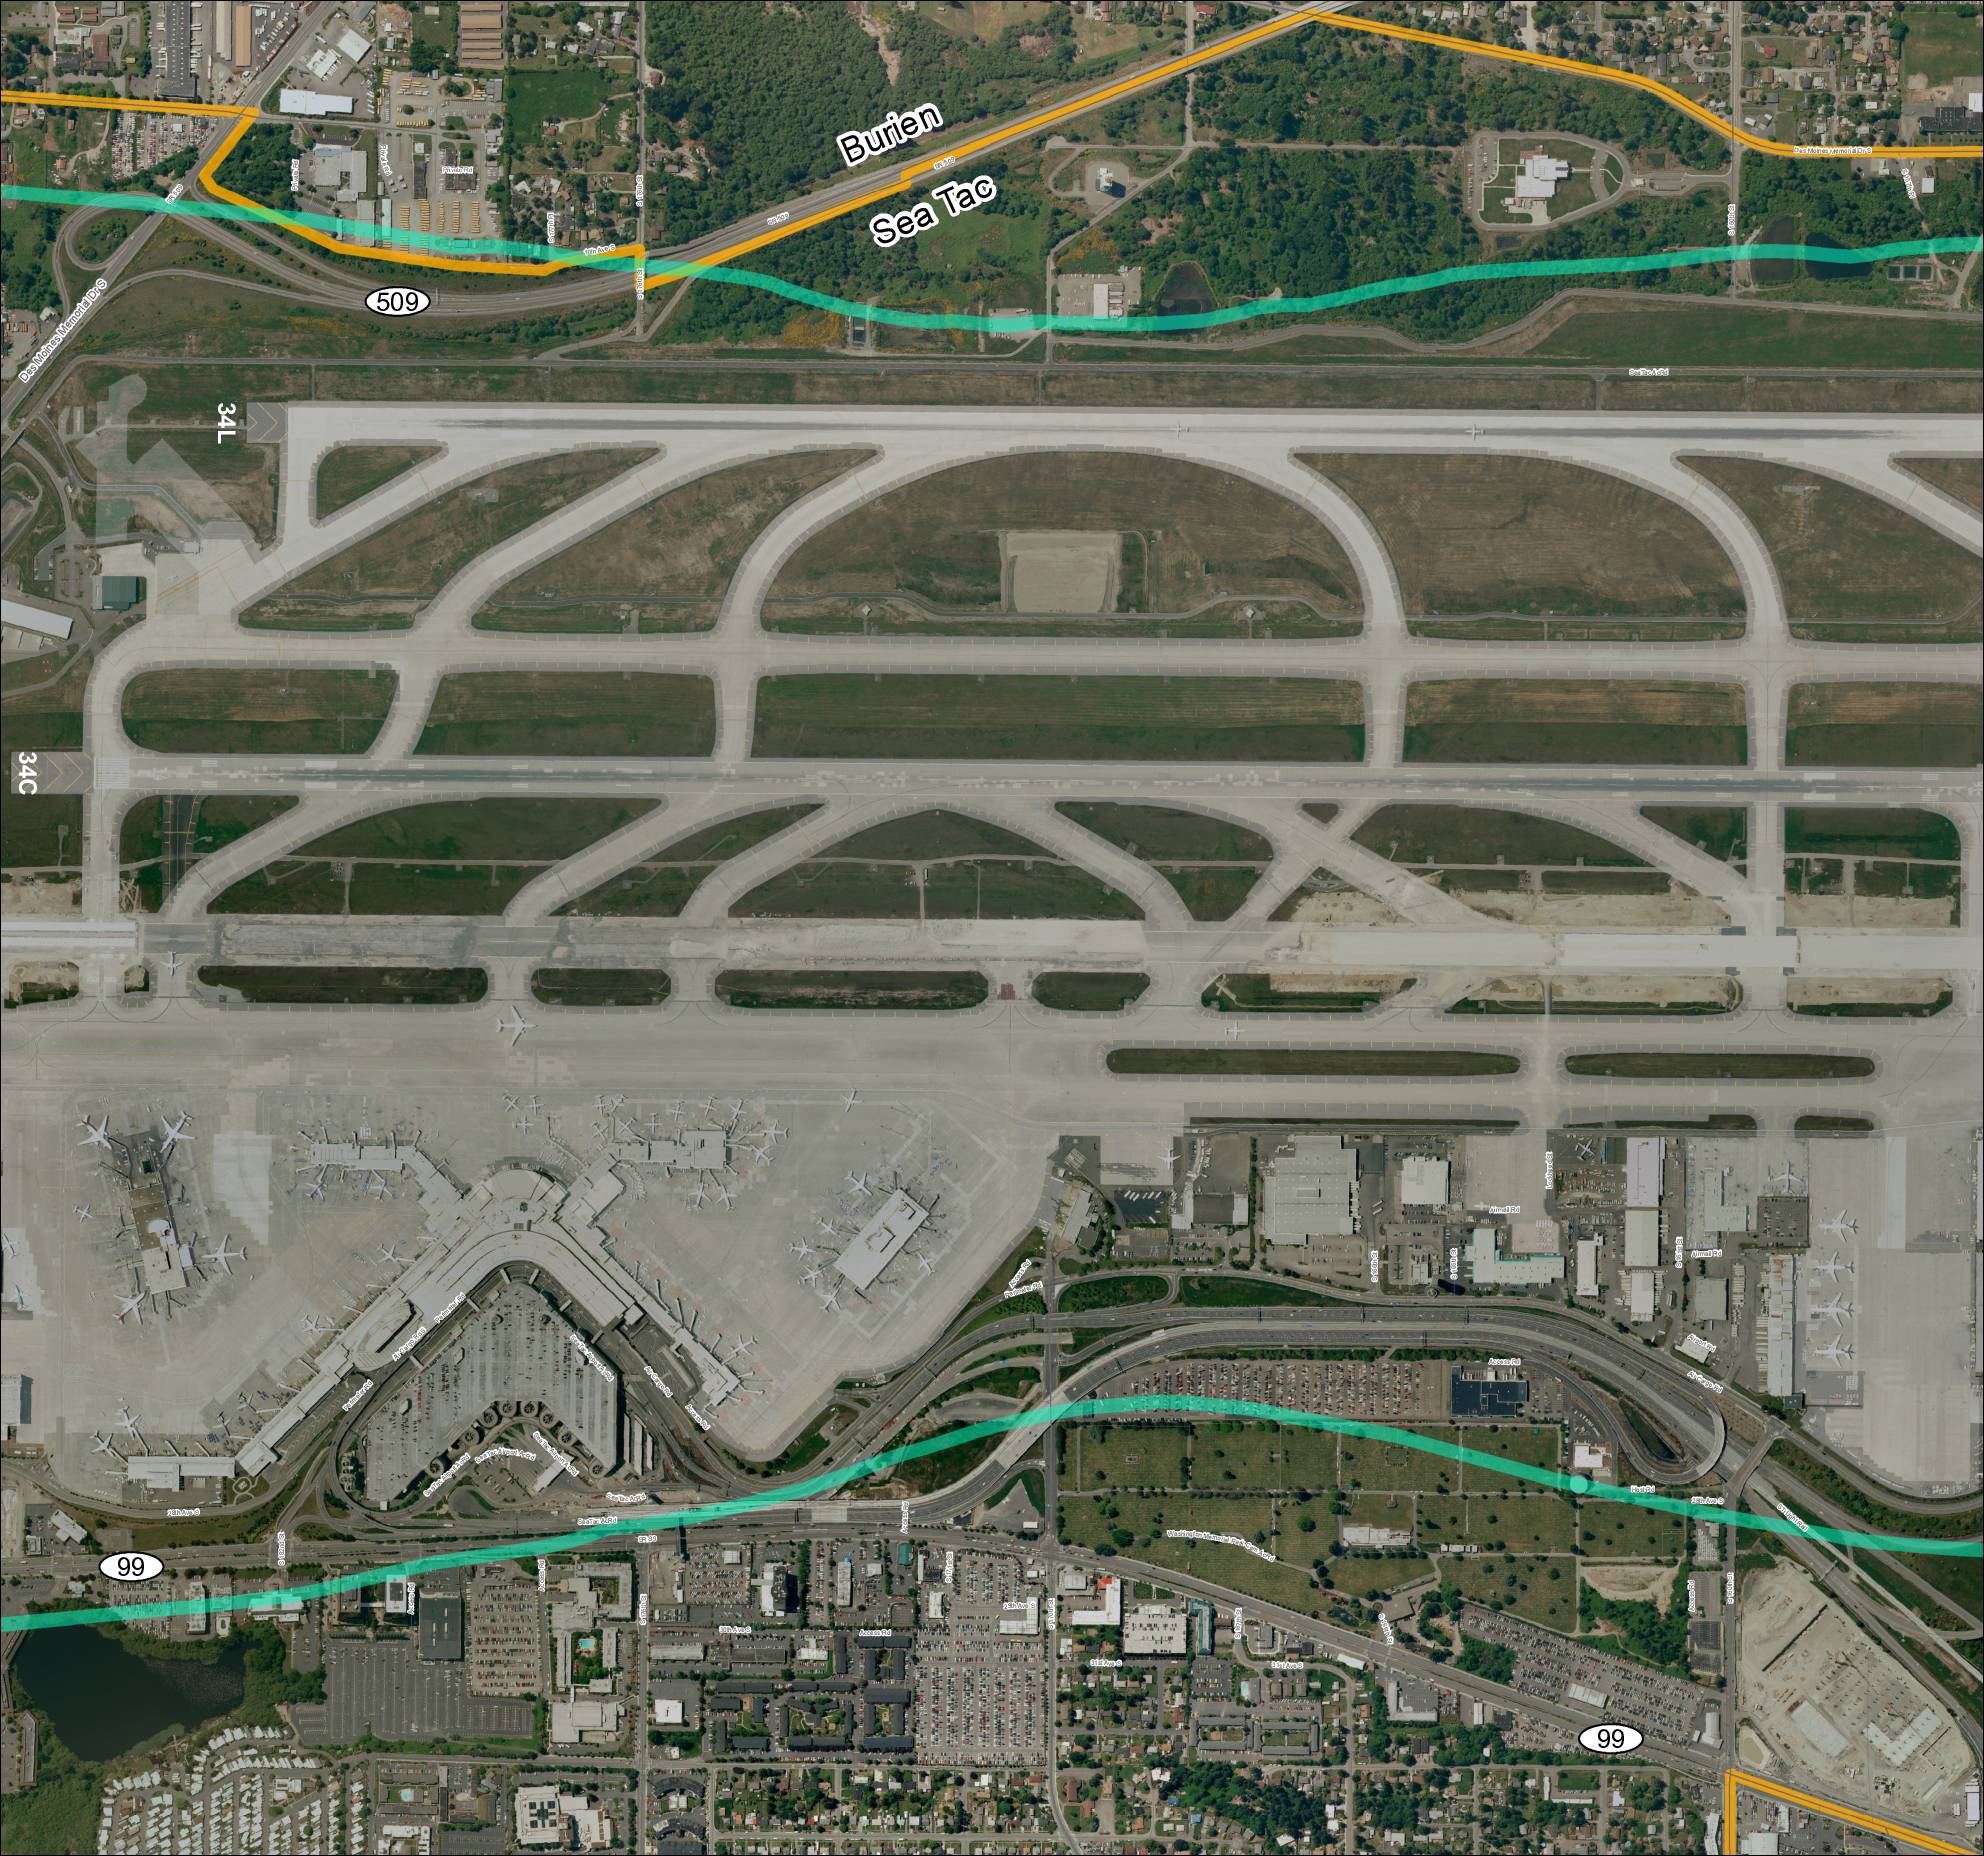
Grid 3: Sea-Tac Airport Aerial Map
This aerial map depicts Seattle-Tacoma International Airport (Sea-Tac) and its surrounding communities of Burien and SeaTac, showing the airport's runway layout including runways 34L and 34C, along with the local road network and key routes such as SR 99 and SR 509. The map highlights the ST Light Rail corridor and major access roads serving the airport, providing geographic context for understanding flight paths and noise exposure areas in the region. It serves as a reference for analyzing the relationship between airport operations and the residential and commercial areas situated beneath approach and departure corridors. -
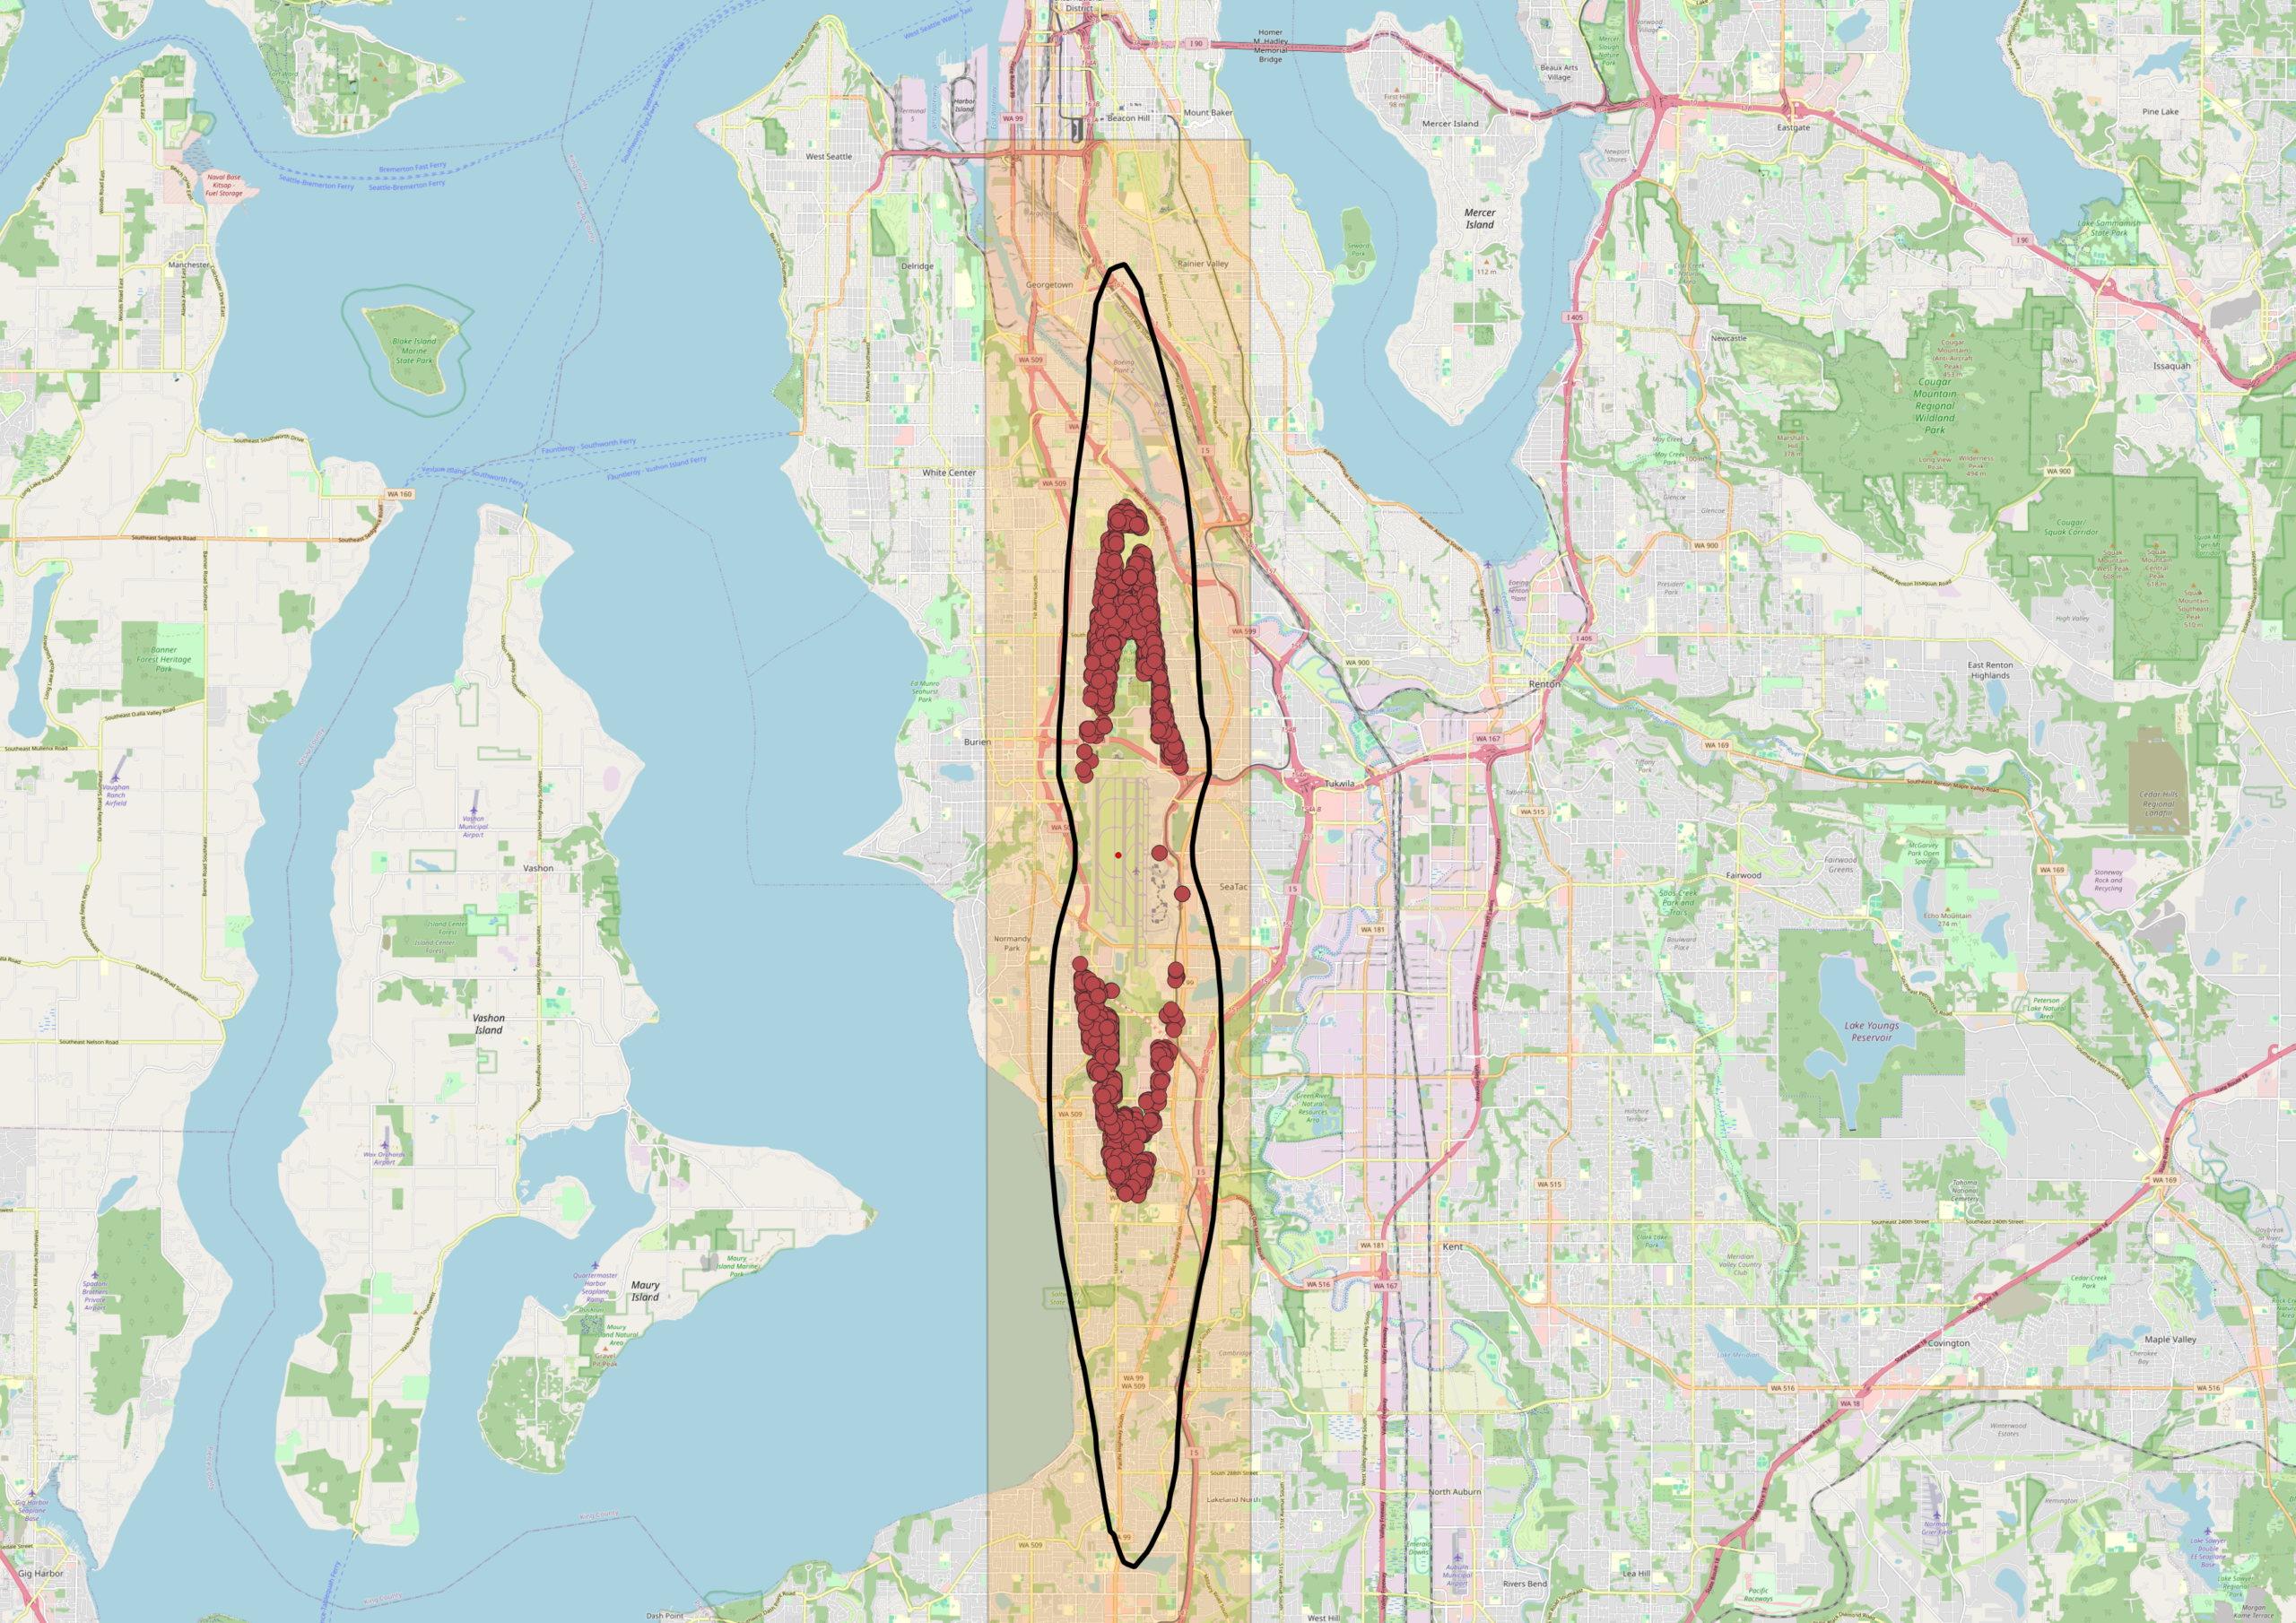 2018-01-01
Sea-Tac Airport DNL 65 Noise Contour Map with 2018 Noise Complaints — Burien, White Center, and Tukwila
An OpenStreetMap-based map of the Seattle–Tacoma area showing Sea-Tac Airport's flight corridor, marked with a highlighted orange corridor zone and a black oval outline indicating the primary noise impact area. Red dot clusters represent noise complaints or flight track incidents concentrated over the Burien, White Center, and Tukwila neighborhoods south of Seattle, with a secondary cluster further south near Federal Way. -
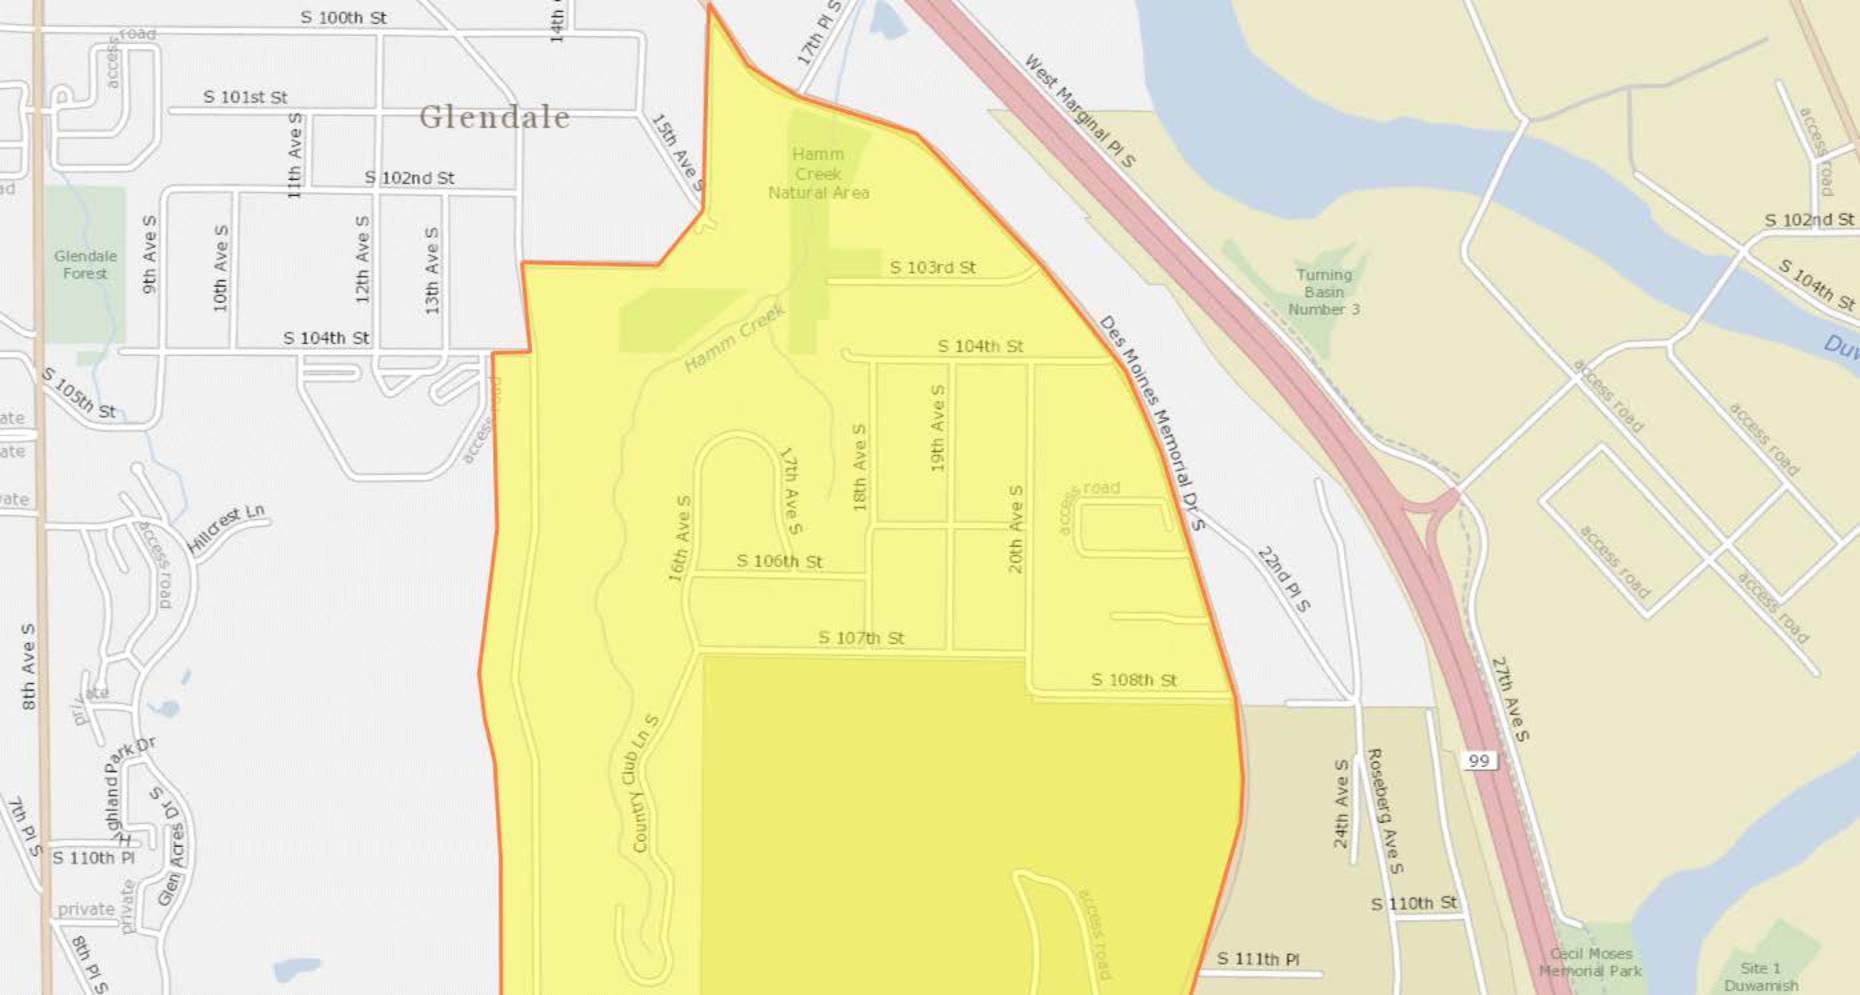 2018-01-01
DNL65 Boundary Map (2018)
This document contains a series of maps outlining a highlighted geographic zone spanning several Seattle-area neighborhoods, including Glendale, Southern Heights, Boulevard Park, and North SeaTac. The yellow-shaded areas, bordered in red, appear to delineate a specific study or policy boundary likely related to Sea-Tac Airport noise impact zones. Streets and landmarks such as Hamm Creek Natural Area, Des Moines Memorial Drive, and Southern Heights Park are visible within and around the designated boundary. -
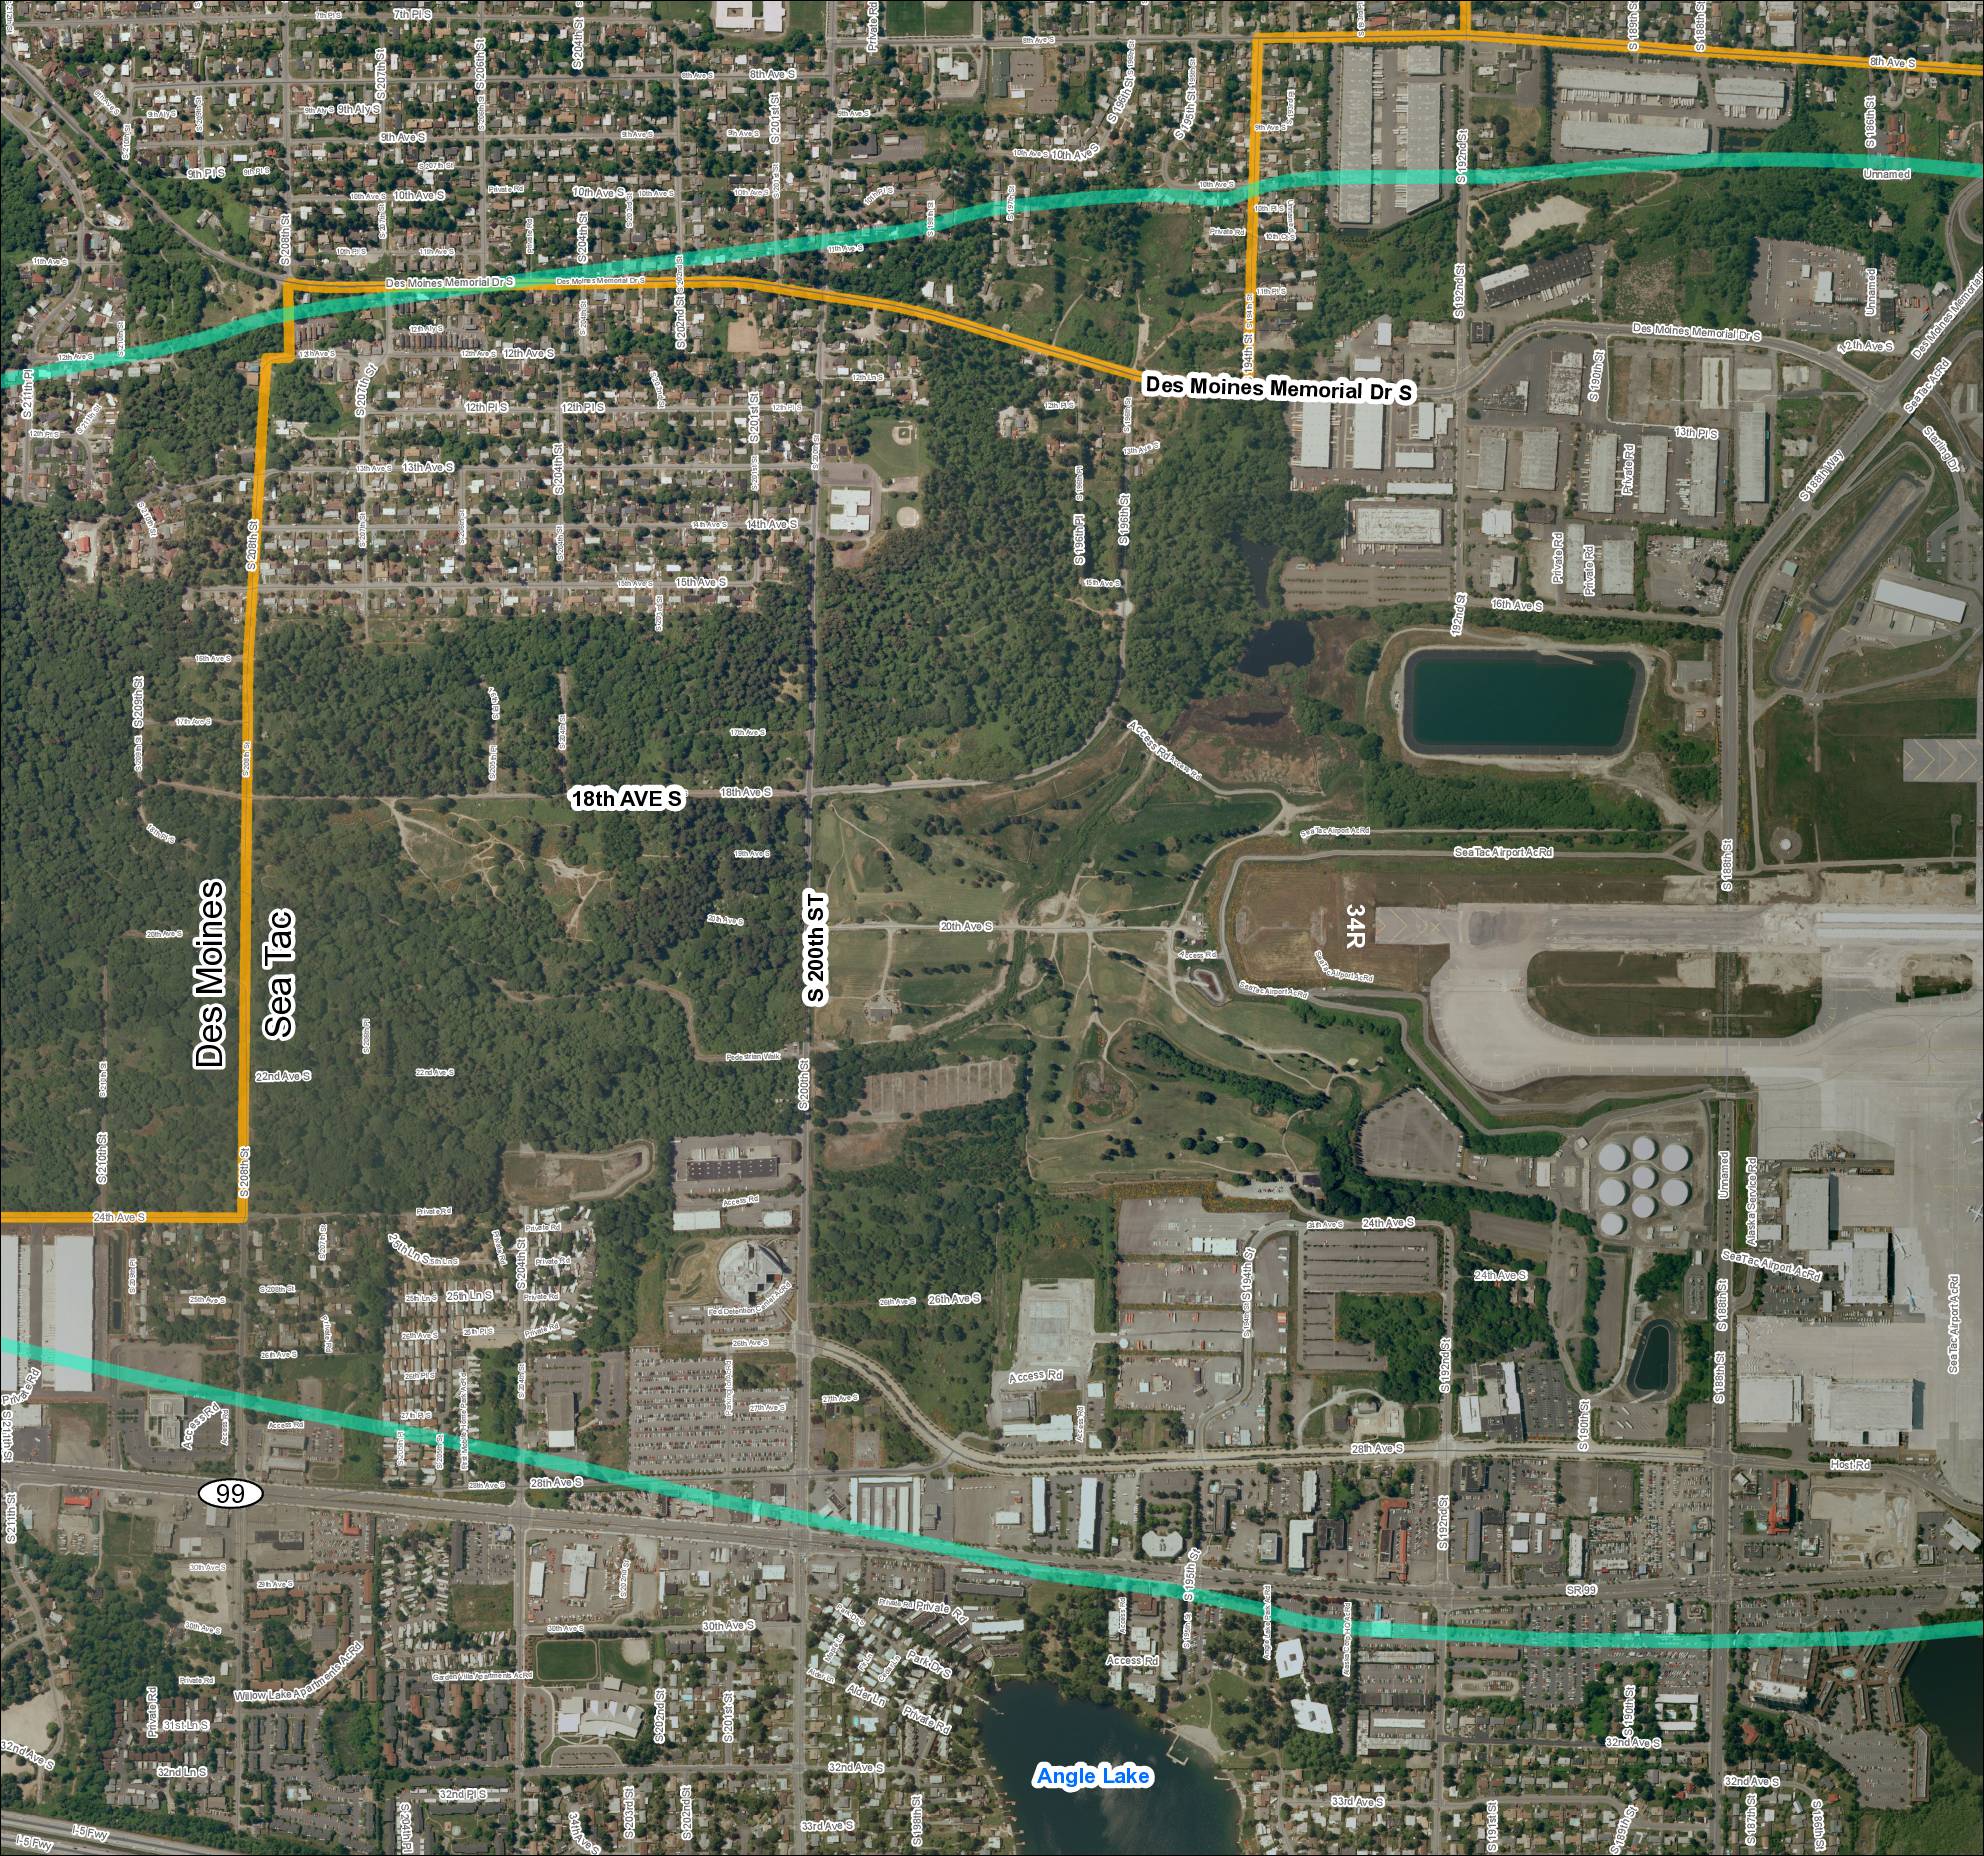 2018-01-01
Grid 2 (2018): Aerial Map of Des Moines / Sea-Tac Area
This document is an aerial map showing the area surrounding Seattle-Tacoma (Sea-Tac) Airport, covering the cities of Des Moines and SeaTac in Washington State. It highlights key roads and boundaries, including Des Moines Memorial Drive S, S 200th Street, 18th Avenue S, and SR 99, with colored overlays likely indicating noise-impact or study zones near the airport. Runway 34R and Angle Lake are visible landmarks, with the map appearing to delineate jurisdictional or noise-contour boundaries relevant to airport planning and policy. -
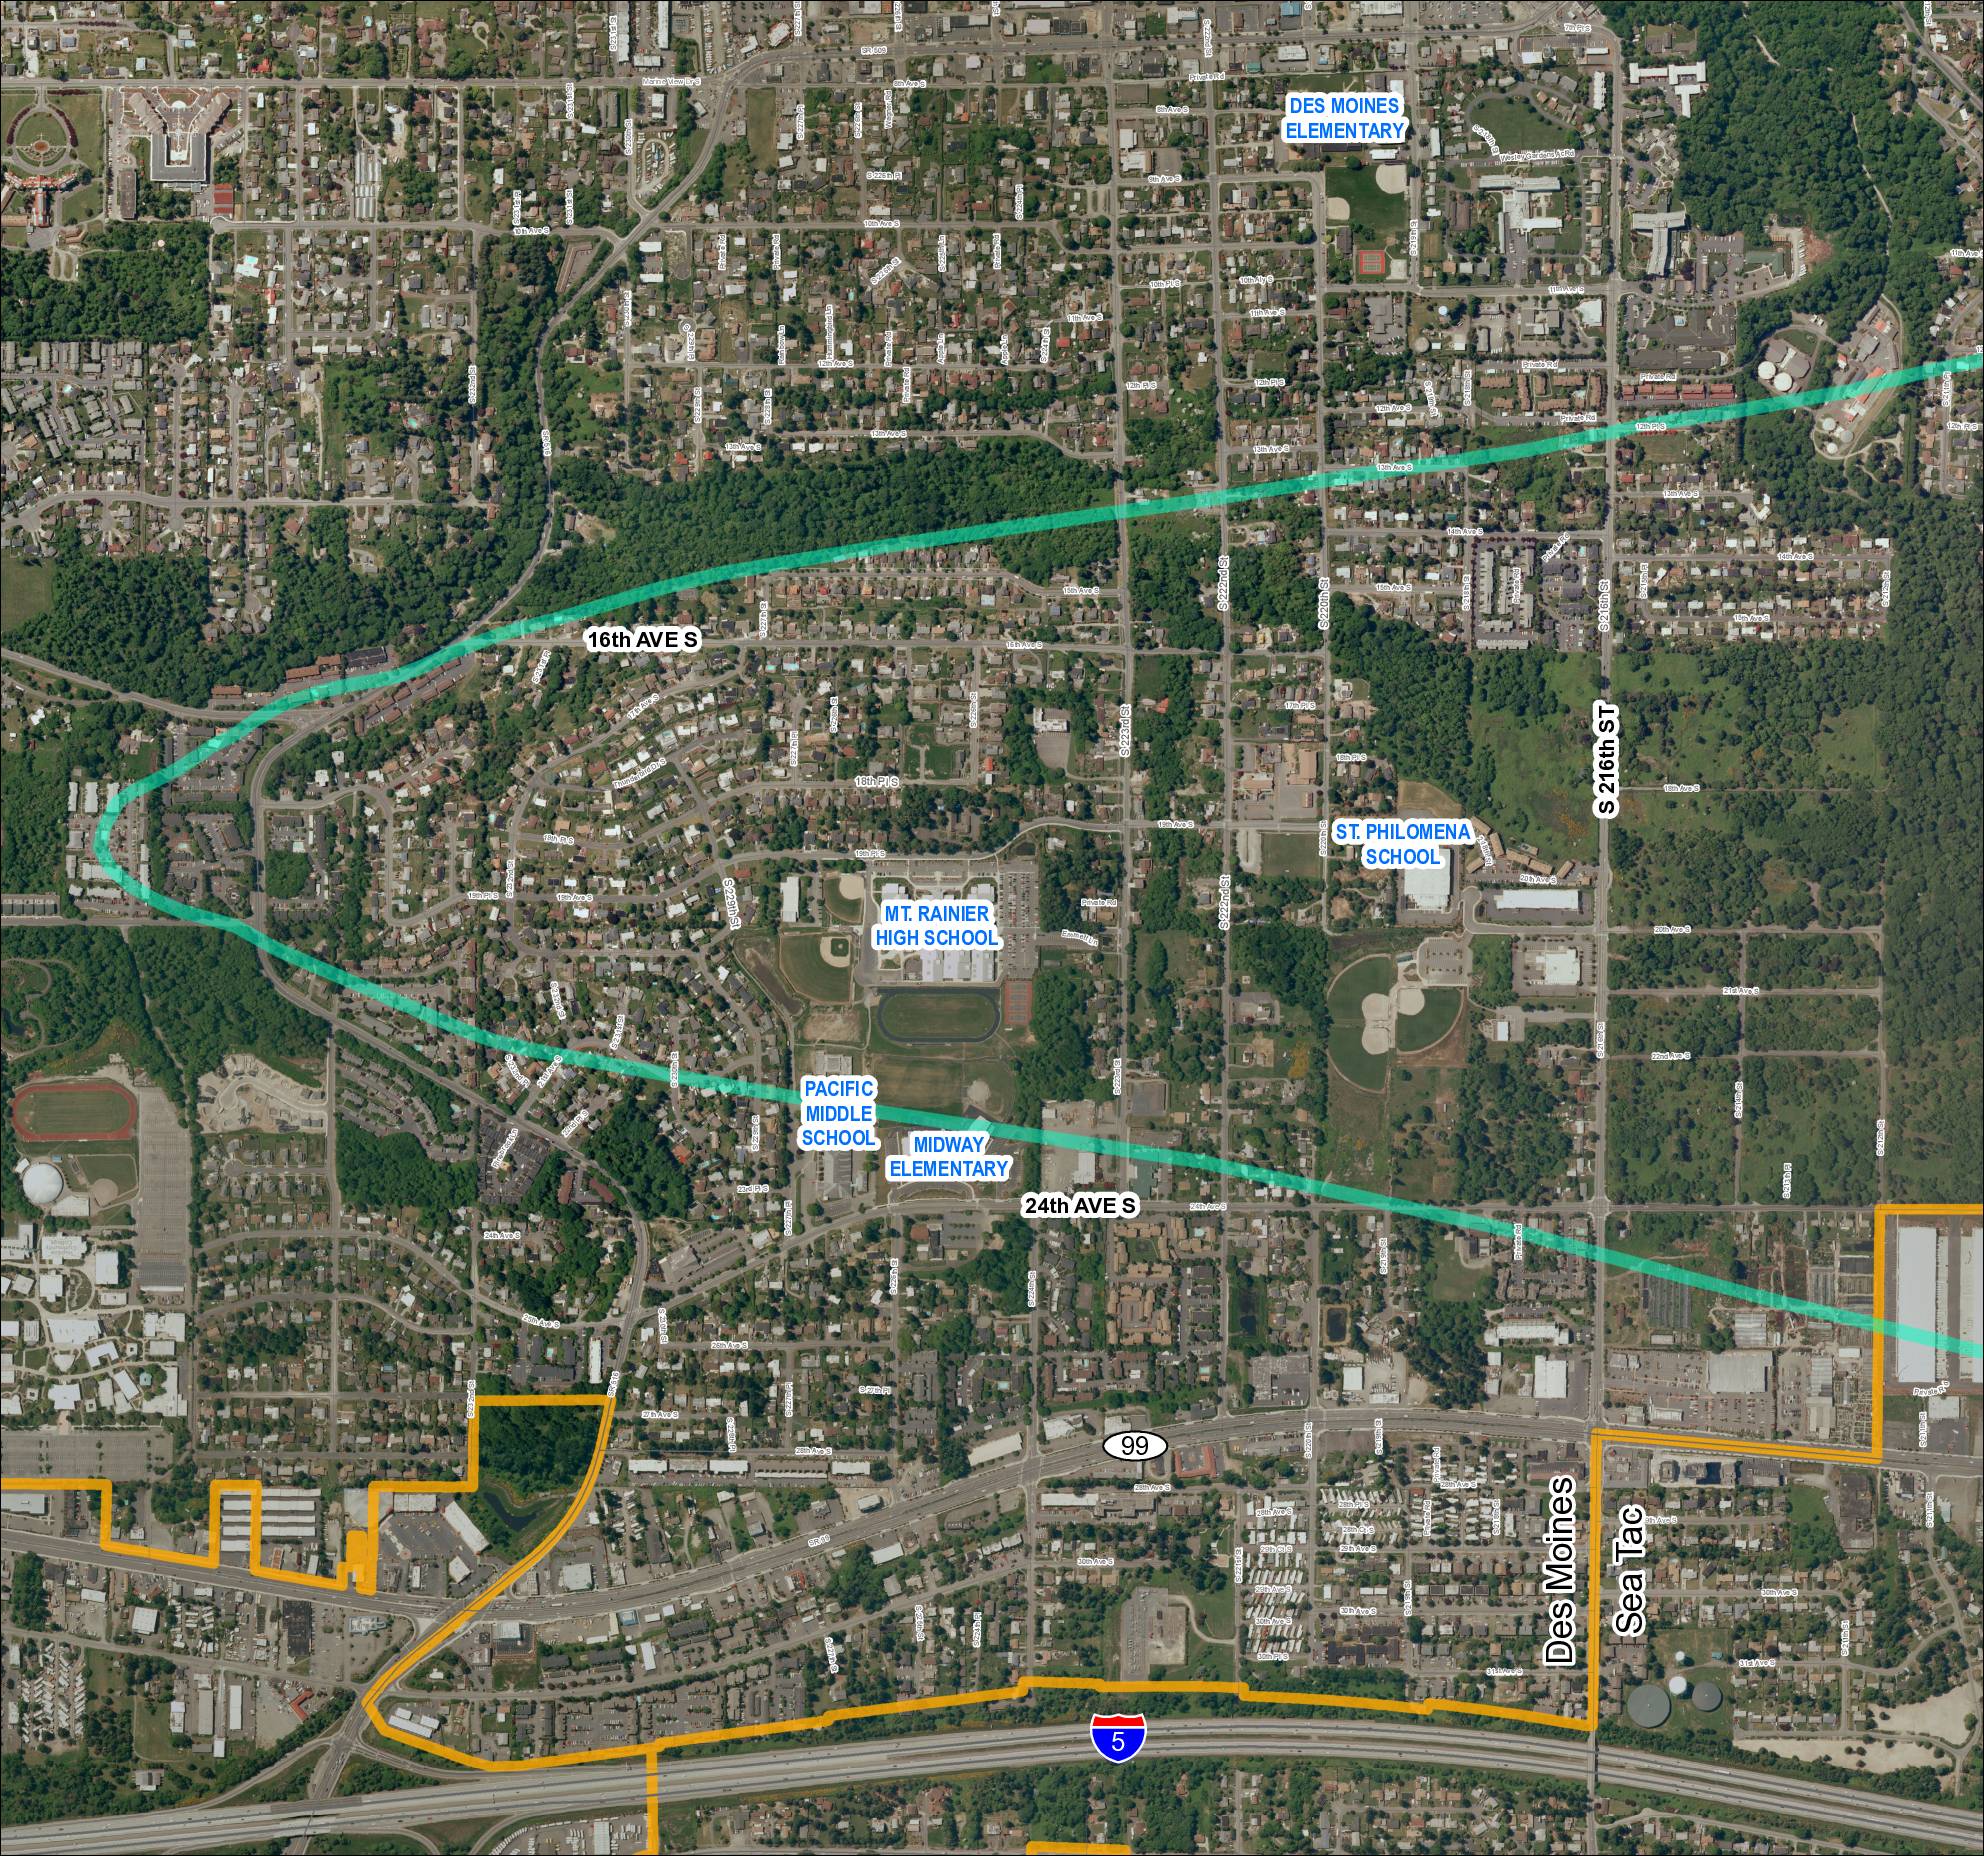 2018-01-01
Grid 1: Des Moines and Sea-Tac Area Schools and Flight Corridor Map (2018)
This map shows the Des Moines and SeaTac area of Washington State, highlighting a noise impact corridor (shown in teal) that sweeps across the region near Sea-Tac Airport. The corridor passes over several schools including Mt. Rainier High School, Pacific Middle School, Midway Elementary, St. Philomena School, and Des Moines Elementary, indicating these institutions fall within the airport's noise-affected zone. A separate boundary (shown in orange) outlines what appears to be an airport-related land use or acquisition area in the southern portion of the map near Interstate 5. -
 2017-10-18
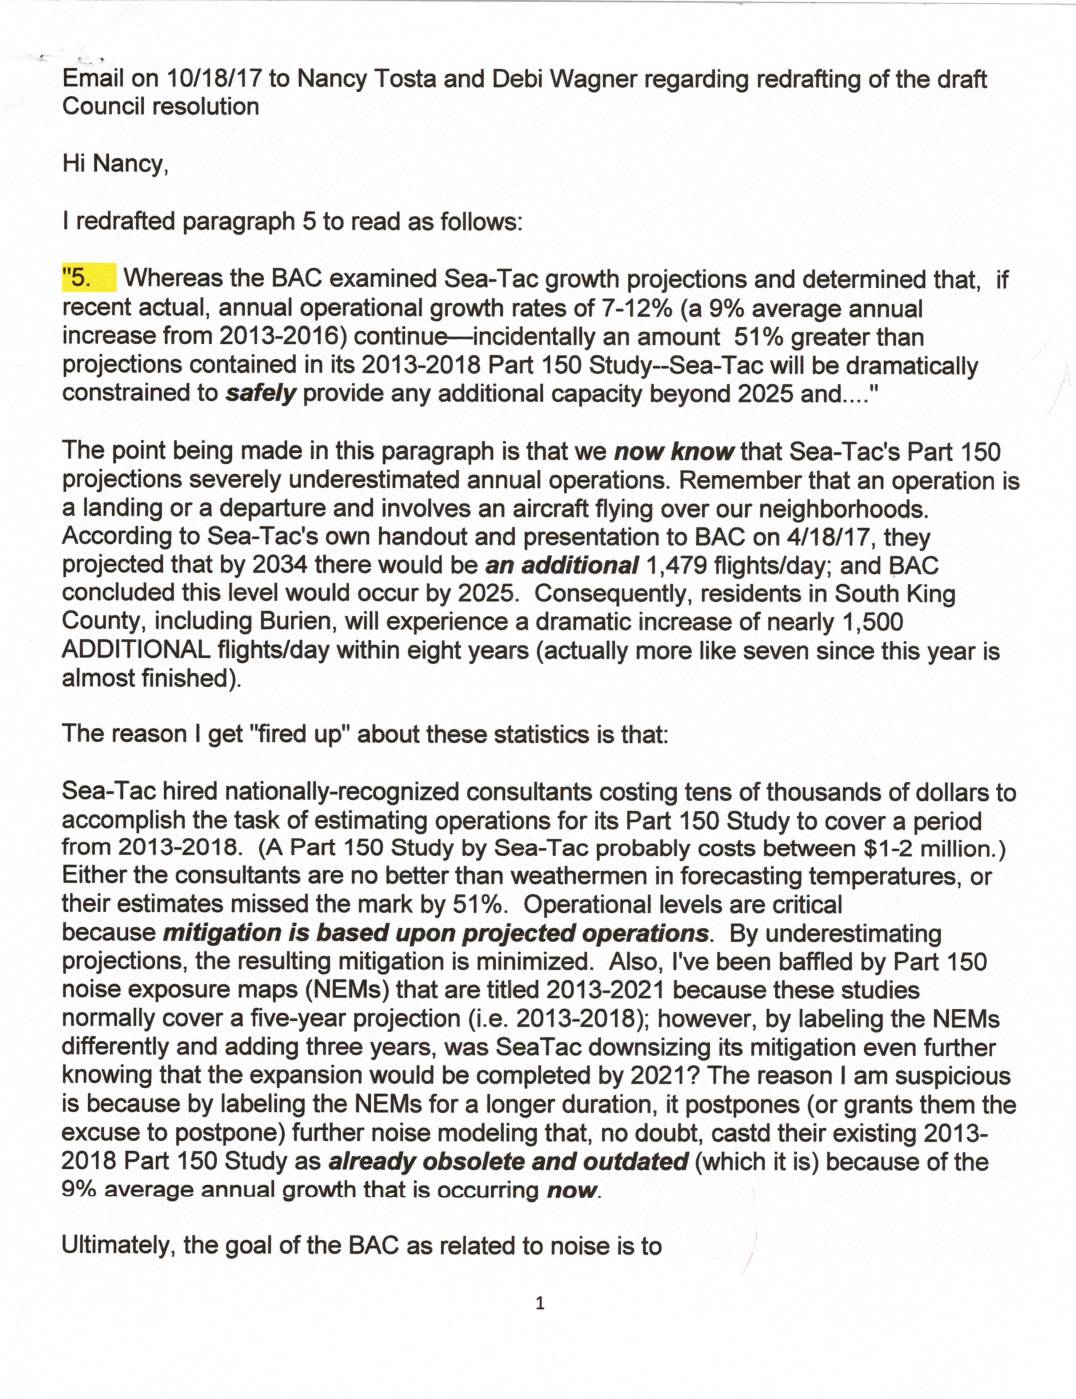
Email on 10/18/17 to Nancy Tosta and Debi Wagner regarding redrafting of the draft Council resolution
In an October 2017 email, Burien Advisory Committee member Sharyn writes to council members Nancy Tosta and Debi Wagner to propose revisions to a draft council resolution concerning Sea-Tac Airport noise and growth. She argues that Sea-Tac's 2013-2018 Part 150 Study severely underestimated actual flight operations by 51%, which has minimized noise mitigation efforts for South King County residents. She calls for updated noise modeling, a reduction in operational levels, and an end to flights over Seahurst, warning that without immediate action, residents could face nearly 1,500 additional flights per day by 2025 with no mitigation relief for another decade. -
 2017-10-18
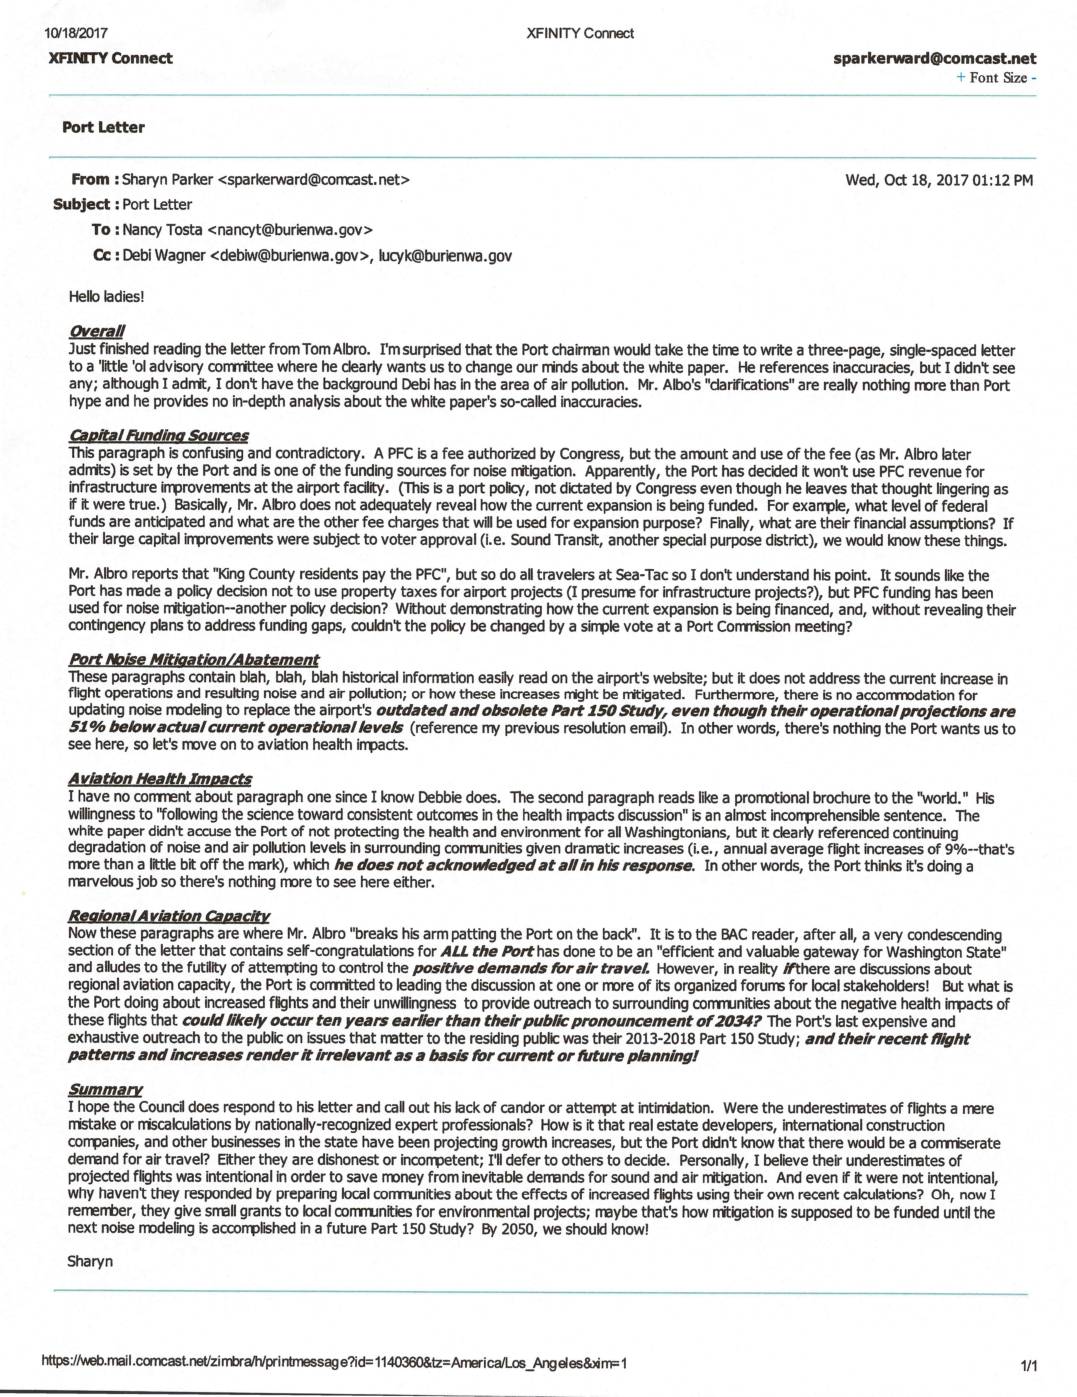
Port letter
In an October 2017 email to Burien City Council members, resident Sharyn Parker critiques a letter from Port of Seattle Chairman Tom Albro defending Sea-Tac Airport's expansion and noise mitigation efforts. She argues that Albro's response fails to address the real-world impacts of rapidly increasing flight operations—including a 9% annual average flight increase—on surrounding communities, and that the Port's noise modeling data is outdated and understates actual activity by 51%. Parker calls on the Council to challenge what she characterizes as the Port's lack of candor and possible intentional underestimation of flight projections to avoid costly noise and air quality mitigation requirements.