TagMap(375)
-
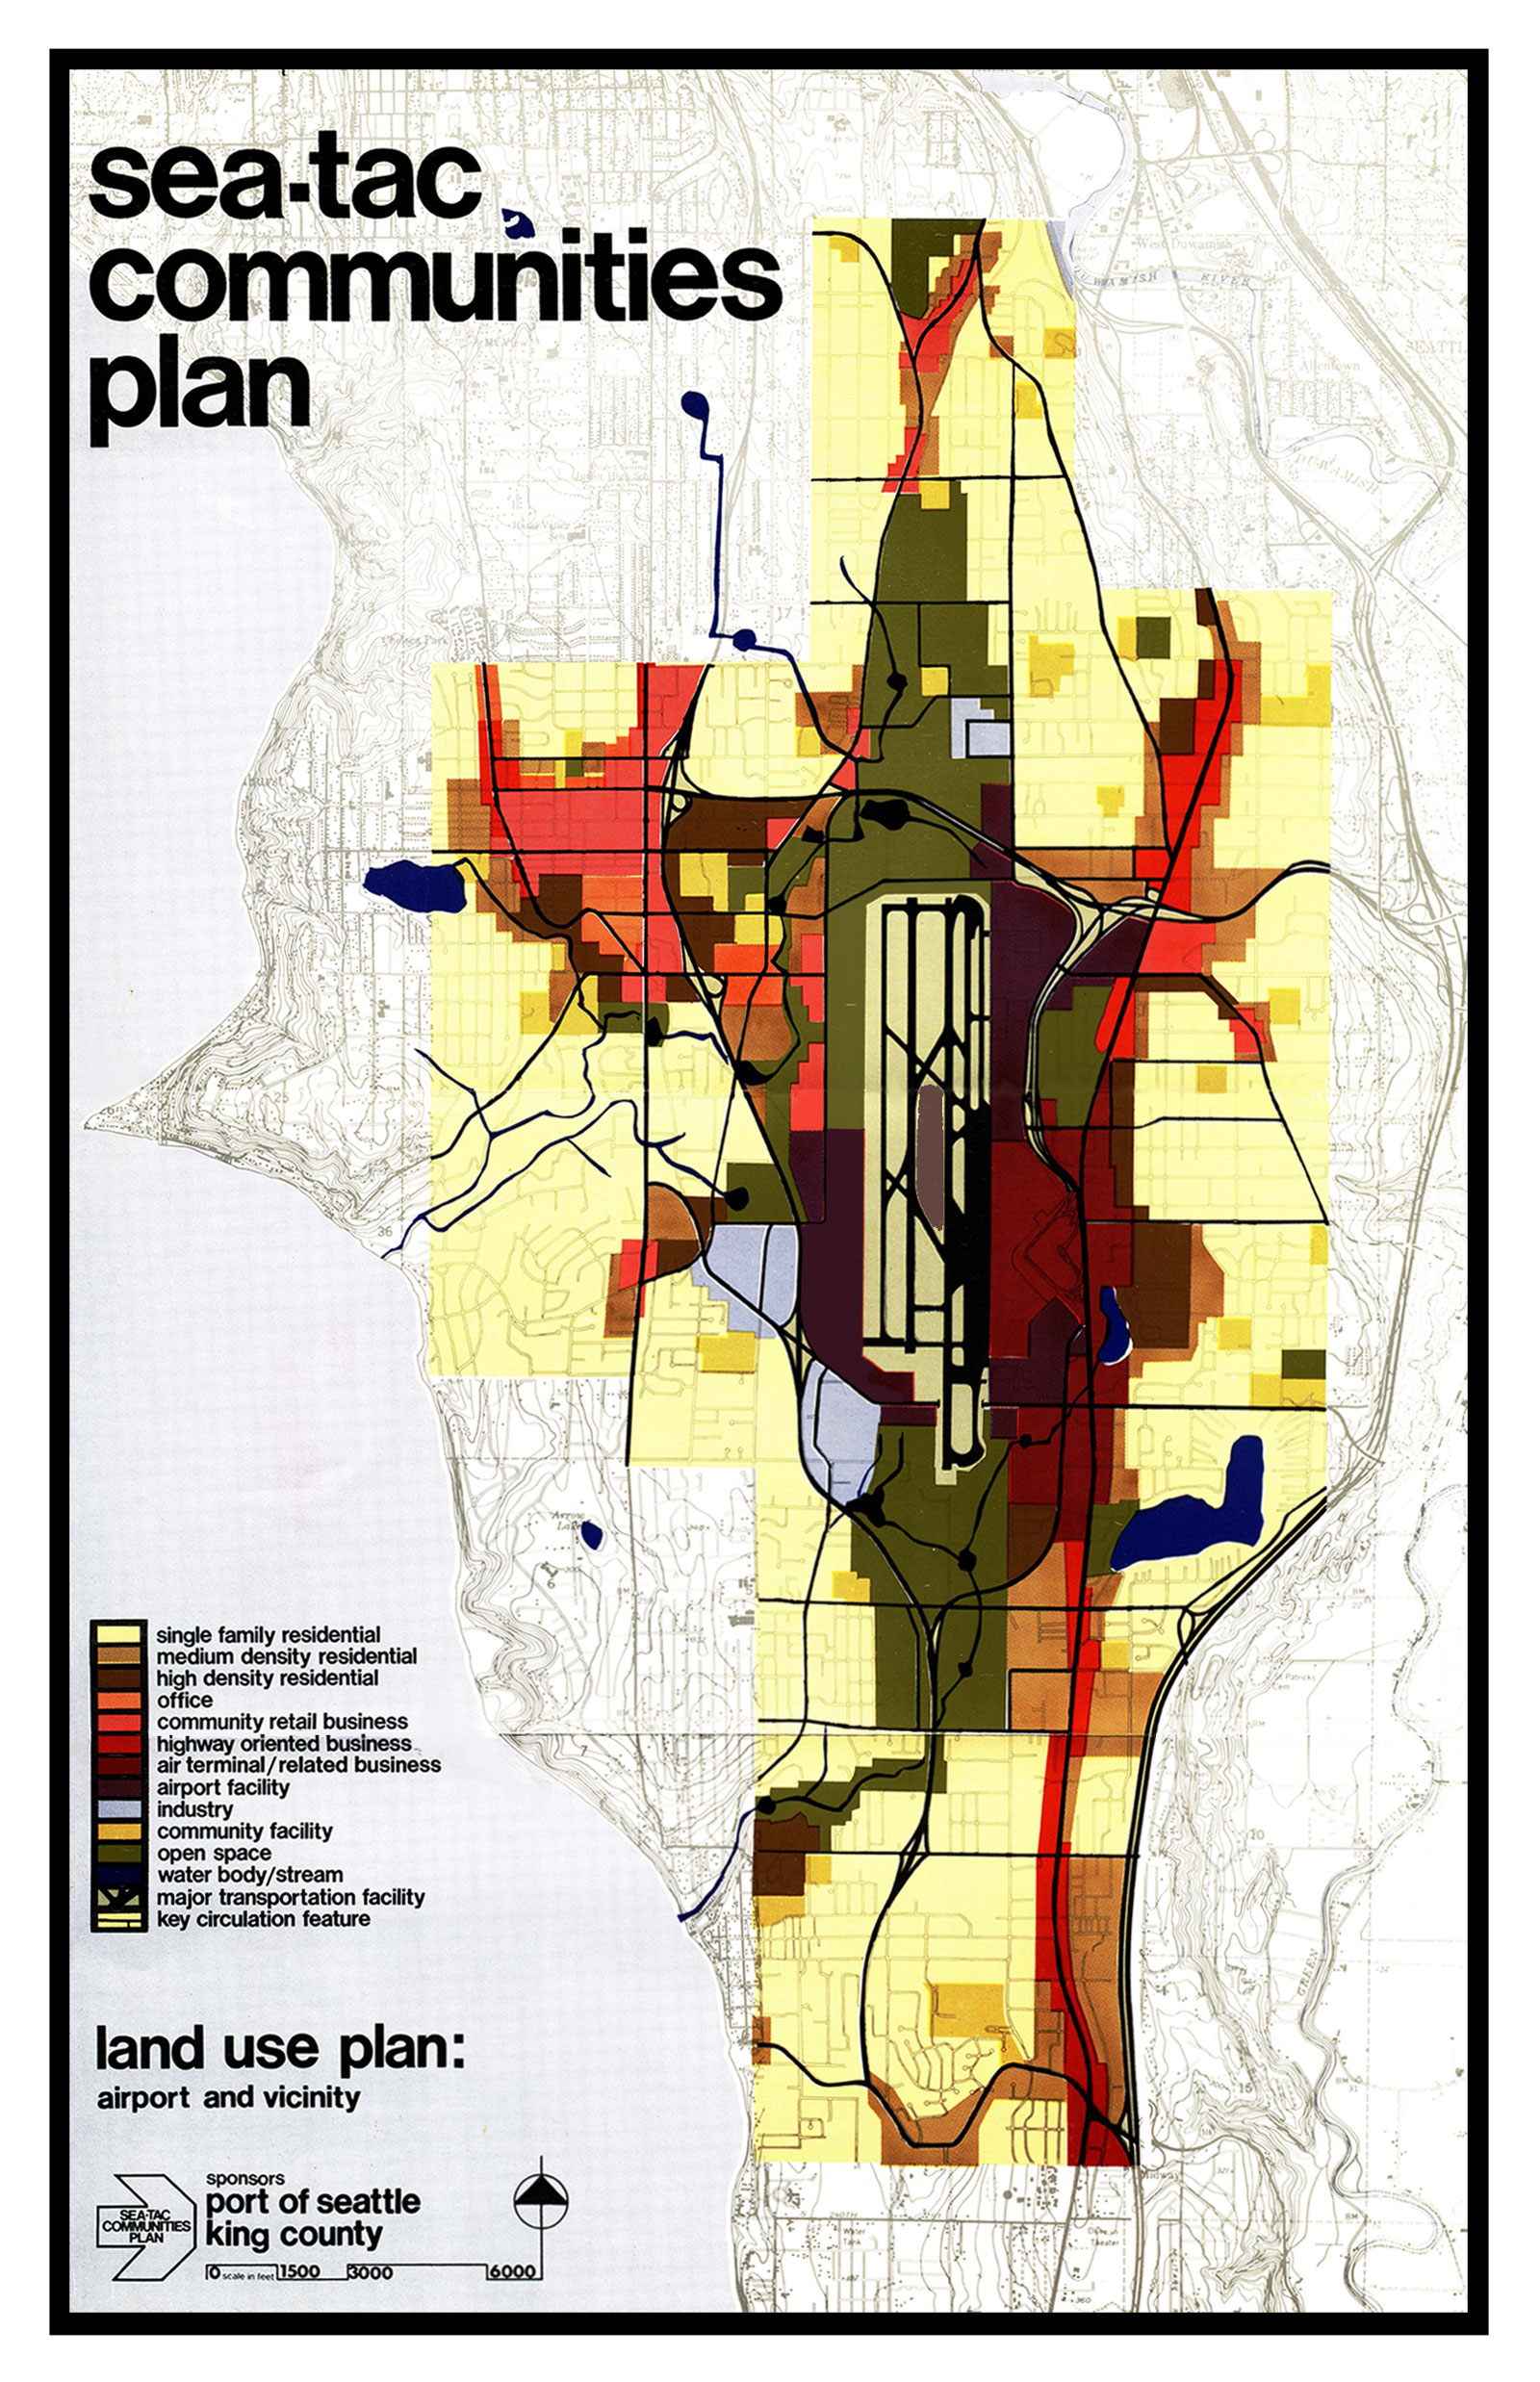
Sea Tac Communities Plan 1600
A land use planning map produced under the Sea-Tac Communities Plan, sponsored by the Port of Seattle and King County, showing zoning categories (residential, commercial, office, airport facility, open space, etc.) for the area surrounding Seattle-Tacoma International Airport. The legend identifies uses including air terminal/related business, highway-oriented business, community retail, industry, and key circulation features, with a scale bar indicating coverage at 1:500 to 6,000 feet. -
 2022-07-31
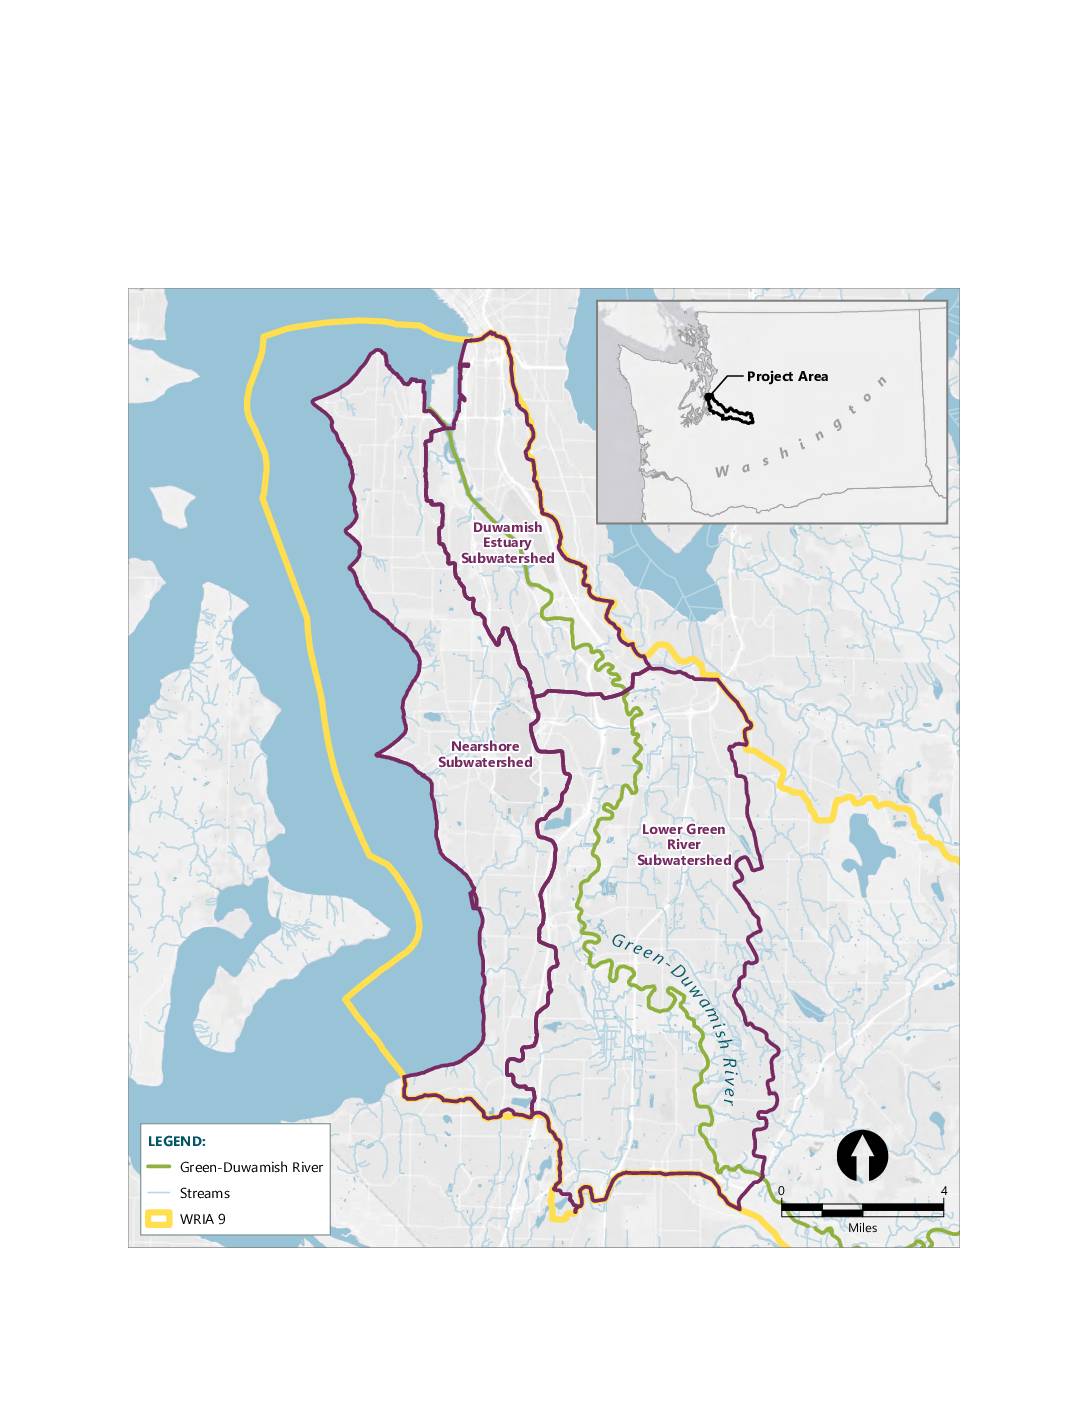
Port of Seattle proposed Mitigation bank service area map
A map showing the mitigation bank service area within WRIA 9 (Water Resource Inventory Area 9), encompassing three subwatersheds: the Lower Green River Subwatershed, the Duwamish Estuary Subwatershed, and the Nearshore Subwatershed. The map displays the Green-Duwamish River and its associated streams in the greater Seattle/King County area of Washington State. An inset map shows -
 2022-07-31
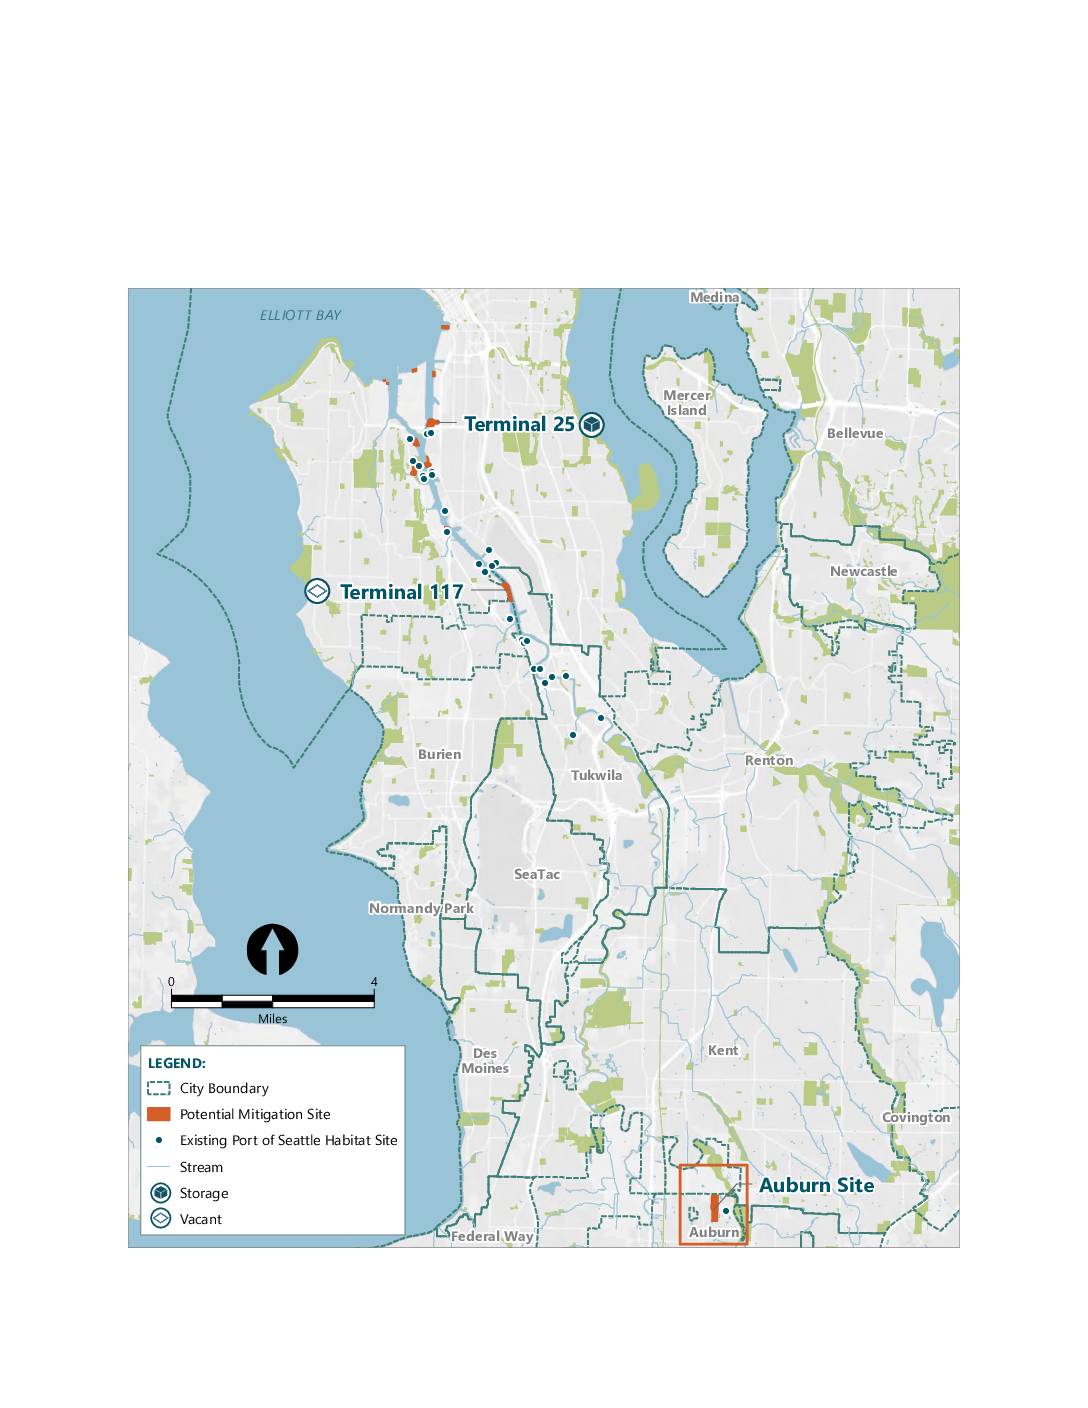
Mitigation bank project sites map
A map showing potential mitigation sites and existing Port of Seattle habitat sites in the greater Seattle area, including Terminal 25, Terminal 117, and the Auburn Site. The map covers cities including Seattle, Burien, Tukwila, SeaTac, Des Moines, Federal Way, Kent, Renton, and Auburn. Sites are categorized by land use type including storage, vacant, and -
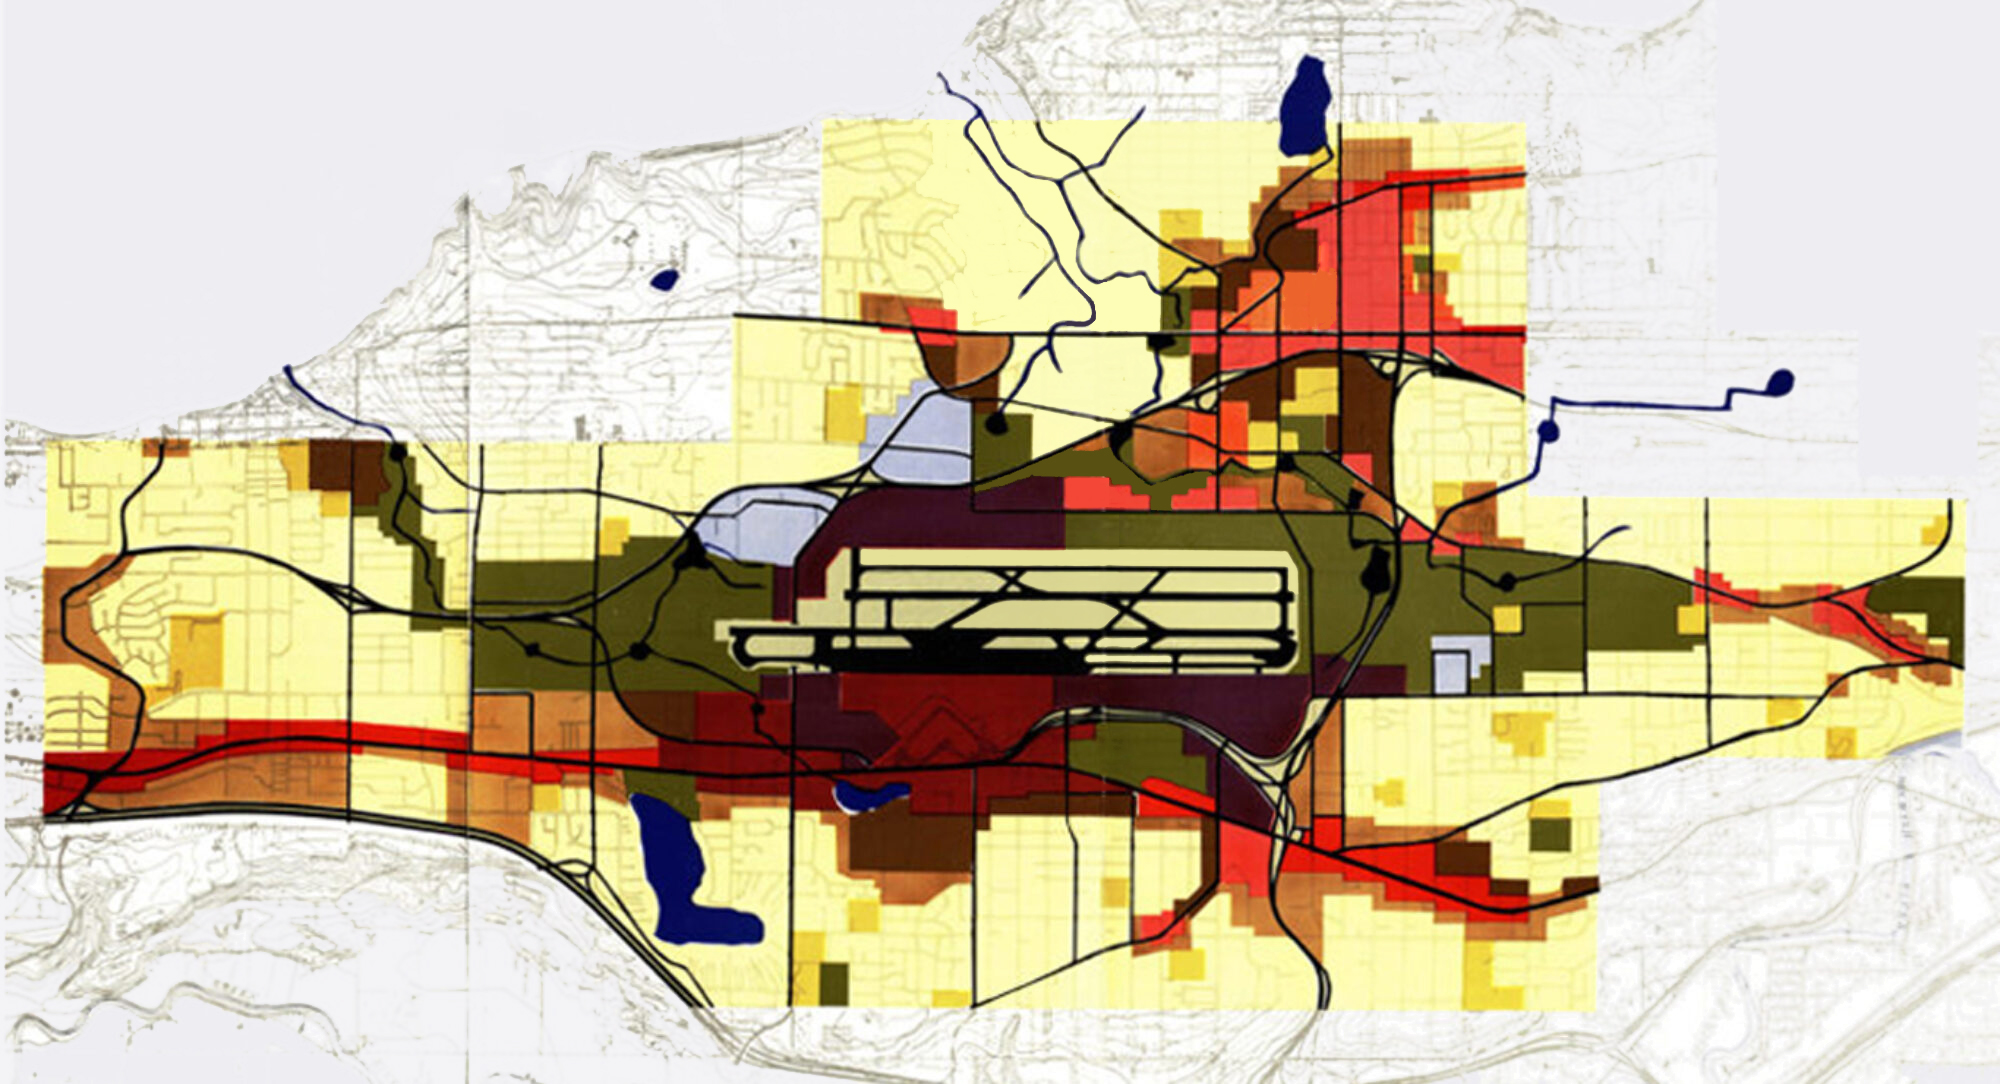
Sea-Tac Community Plan Land Use Sideways
A color-coded GIS-style map overlay showing noise contour zones or land-use impact areas surrounding what appears to be a major airport runway complex at center. Colors ranging from light yellow to deep red and dark olive likely represent varying levels of noise exposure or compatible/incompatible land uses, with road networks shown in black and red lines. -
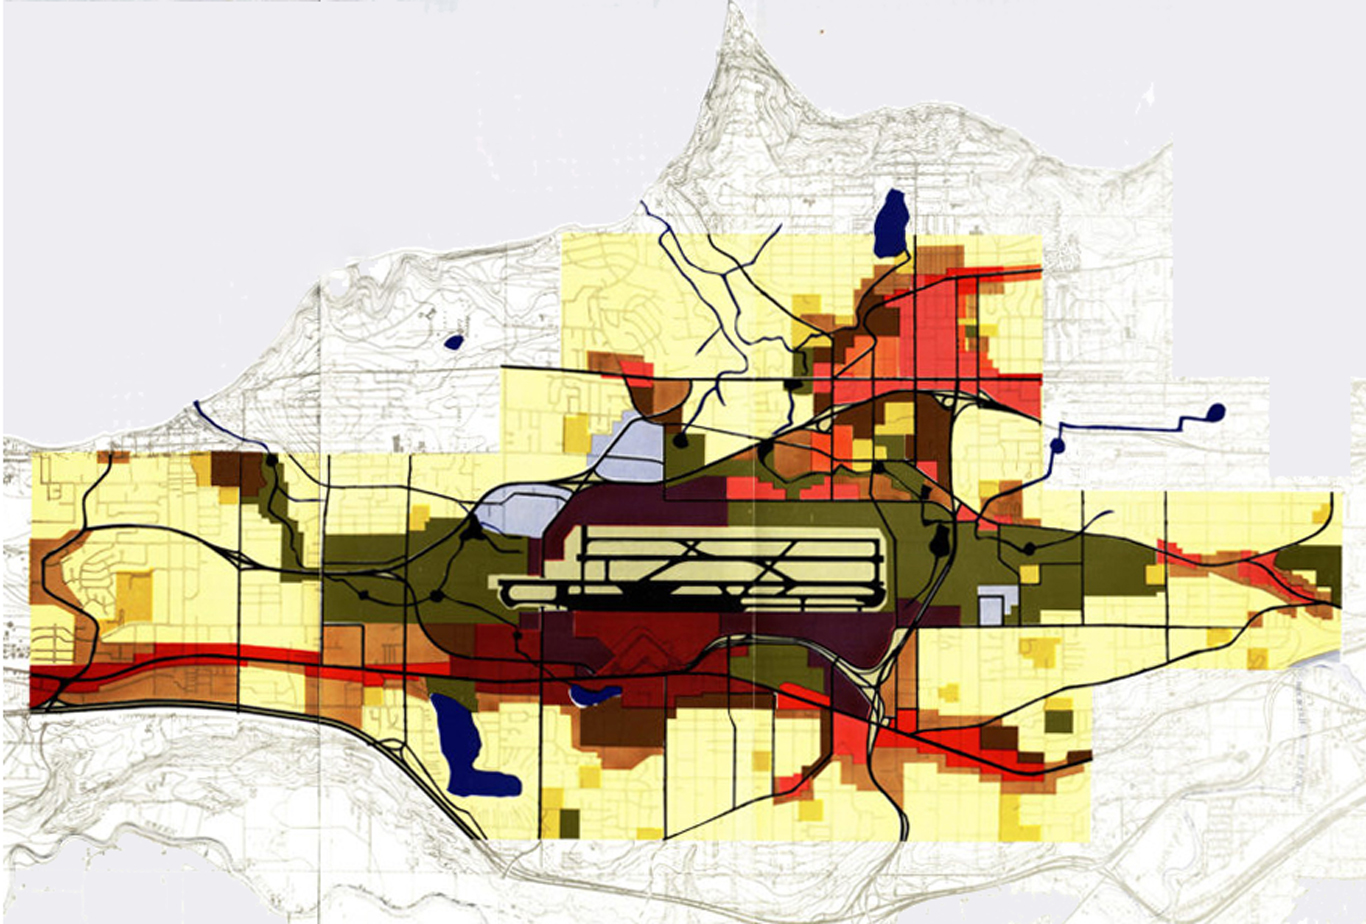
SCP_sideways
A color-coded planning map showing noise contour zones or land-use impact areas radiating from a central airport runway facility, depicted in shades of yellow, red, brown, and dark olive-green. Blue lines appear to represent waterways or transportation corridors, and bold black lines indicate road or grid infrastructure overlaid on a topographic base map. -
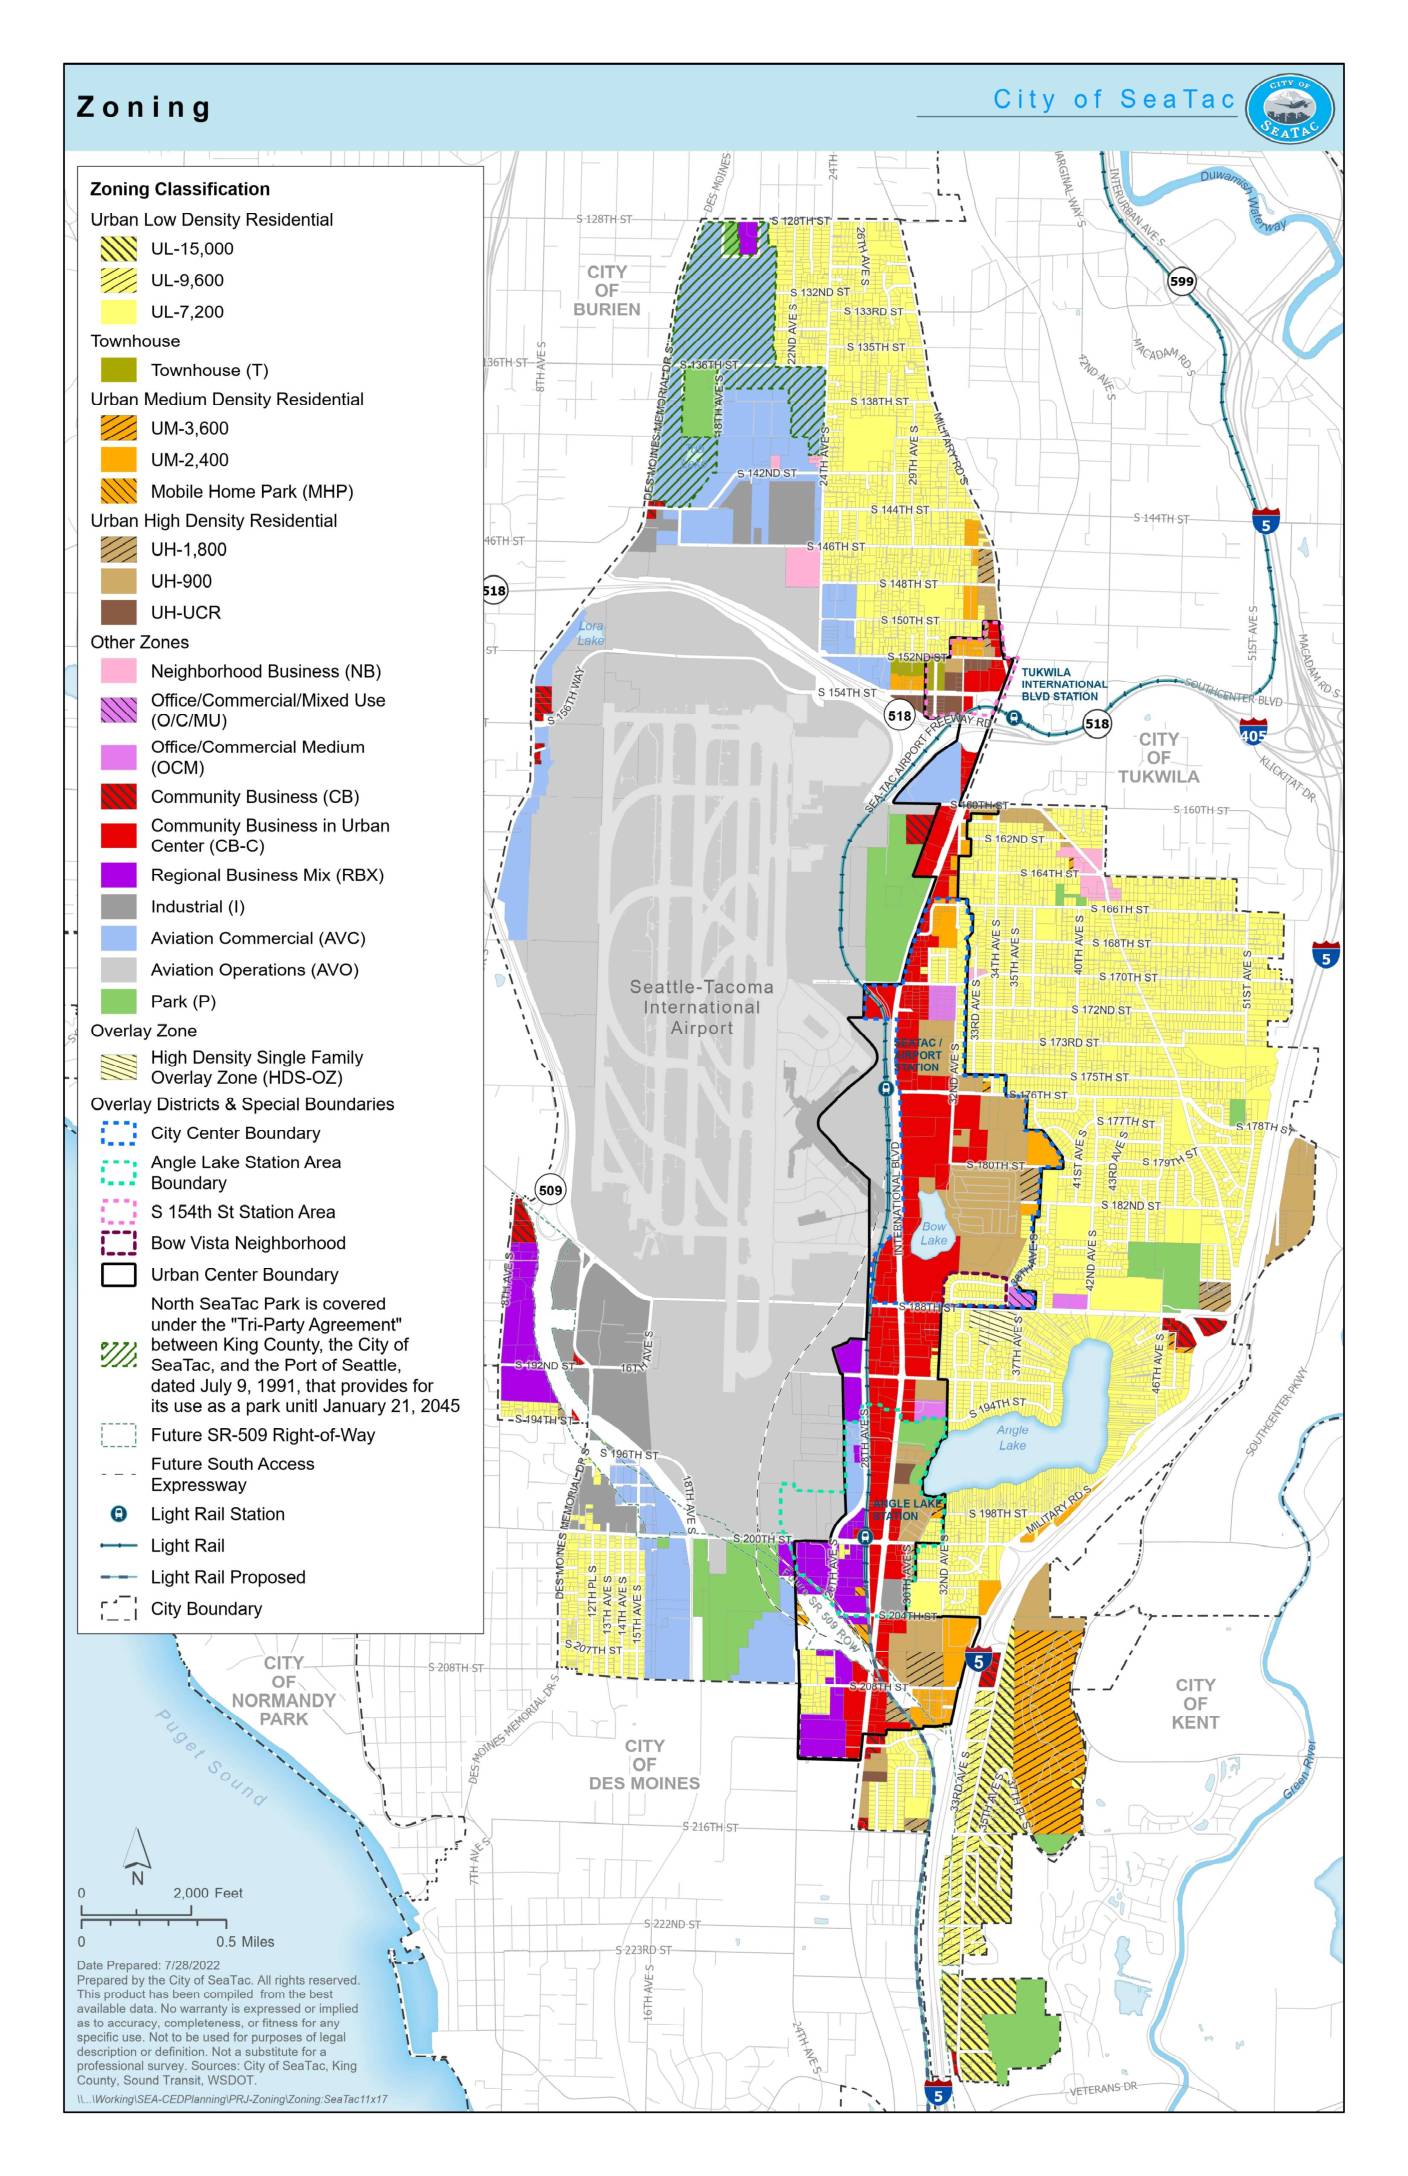 2022-07-28
Zoning: City of SeaTac
This zoning map from the City of SeaTac (prepared July 28, 2022) shows land-use classifications throughout the city, which borders Seattle-Tacoma International Airport. The map identifies a range of residential, commercial, industrial, and aviation-related zones — including Aviation Commercial (AVC) and Aviation Operations (AVO) designations — that reflect the airport's significant influence on surrounding land use and development policy. Special overlay districts, light rail corridors, and station area boundaries are also depicted, highlighting the city's efforts to manage growth and compatibility with airport noise and operations. -
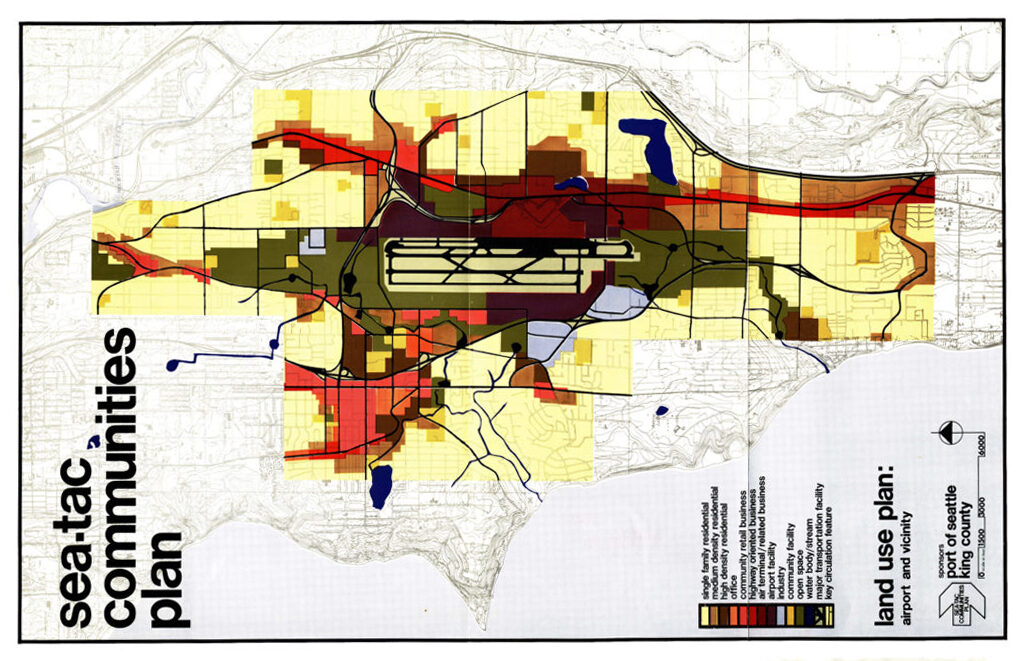
Sea Tac Communities Plan 6.7 Land Use Plan 1600 661×1024
A color-coded land use planning map produced by the Port of Seattle and King County as part of the Sea-Tac Communities Plan, showing zoning categories (residential, commercial, office, airport facility, open space, and circulation features) in the airport vicinity. The legend identifies uses including single-family residential, high-density residential, highway-oriented retail, air terminal/related business, community facility, open body/stream, major transportation facility, and key circulation features. -
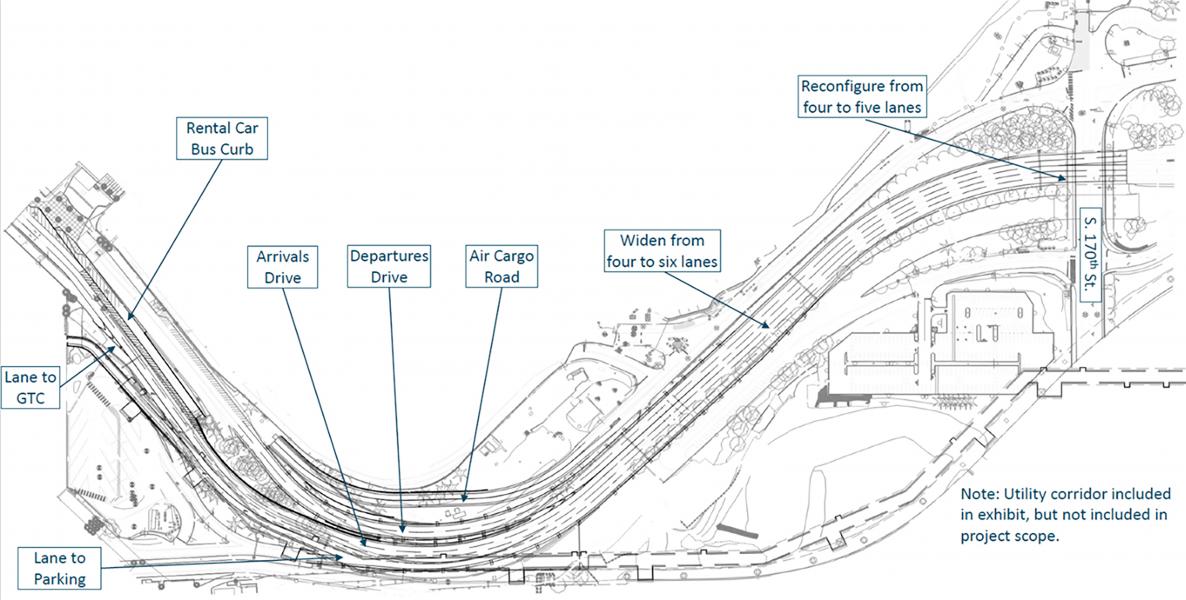
Sea-Tac Airport Landside Roadway Widening – Site Plan
Architectural/engineering plan view of Sea-Tac Airport's landside roadway system showing proposed improvements including widening a segment from four to six lanes, reconfiguring another segment from four to five lanes near S. 170th St., and labeled features including Arrivals Drive, Departures Drive, Air Cargo Road, Rental Car Bus Curb, Lane to GTC, and Lane to Parking. A note states the utility corridor is shown in the exhibit but is not included in project scope. -
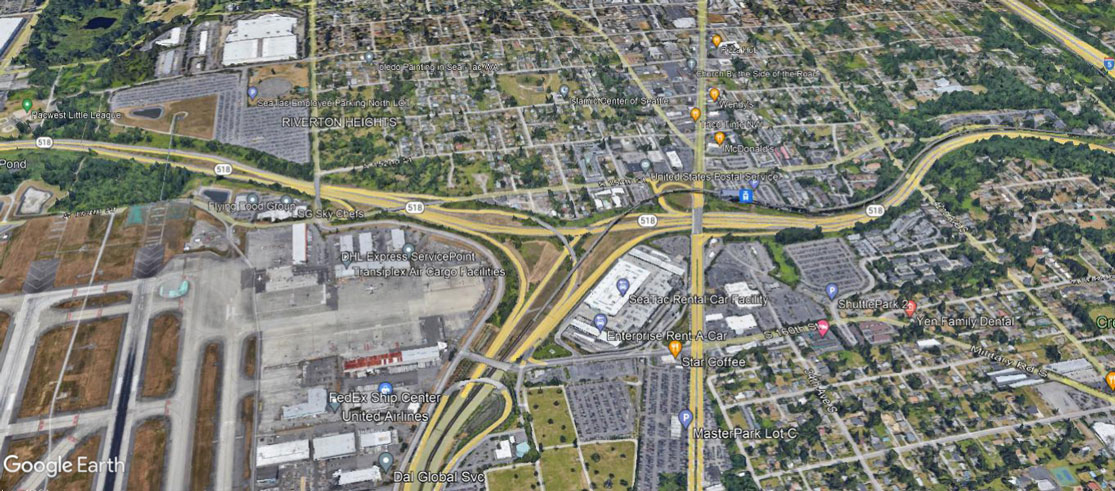
Sea-Tac Airport Northern Access
Google Earth satellite image showing the SR-518 freeway interchange adjacent to Seattle-Tacoma International Airport, with visible labels identifying Riverton Heights neighborhood, DHL Express ServicePoint, FedEx Ship Center, Enterprise Rent-A-Car, SeaTac Rental Car Facility, MasterPark Lot C, and airport cargo facilities. The image captures the noise-sensitive residential and commercial areas immediately east of the airport's runway complex. -
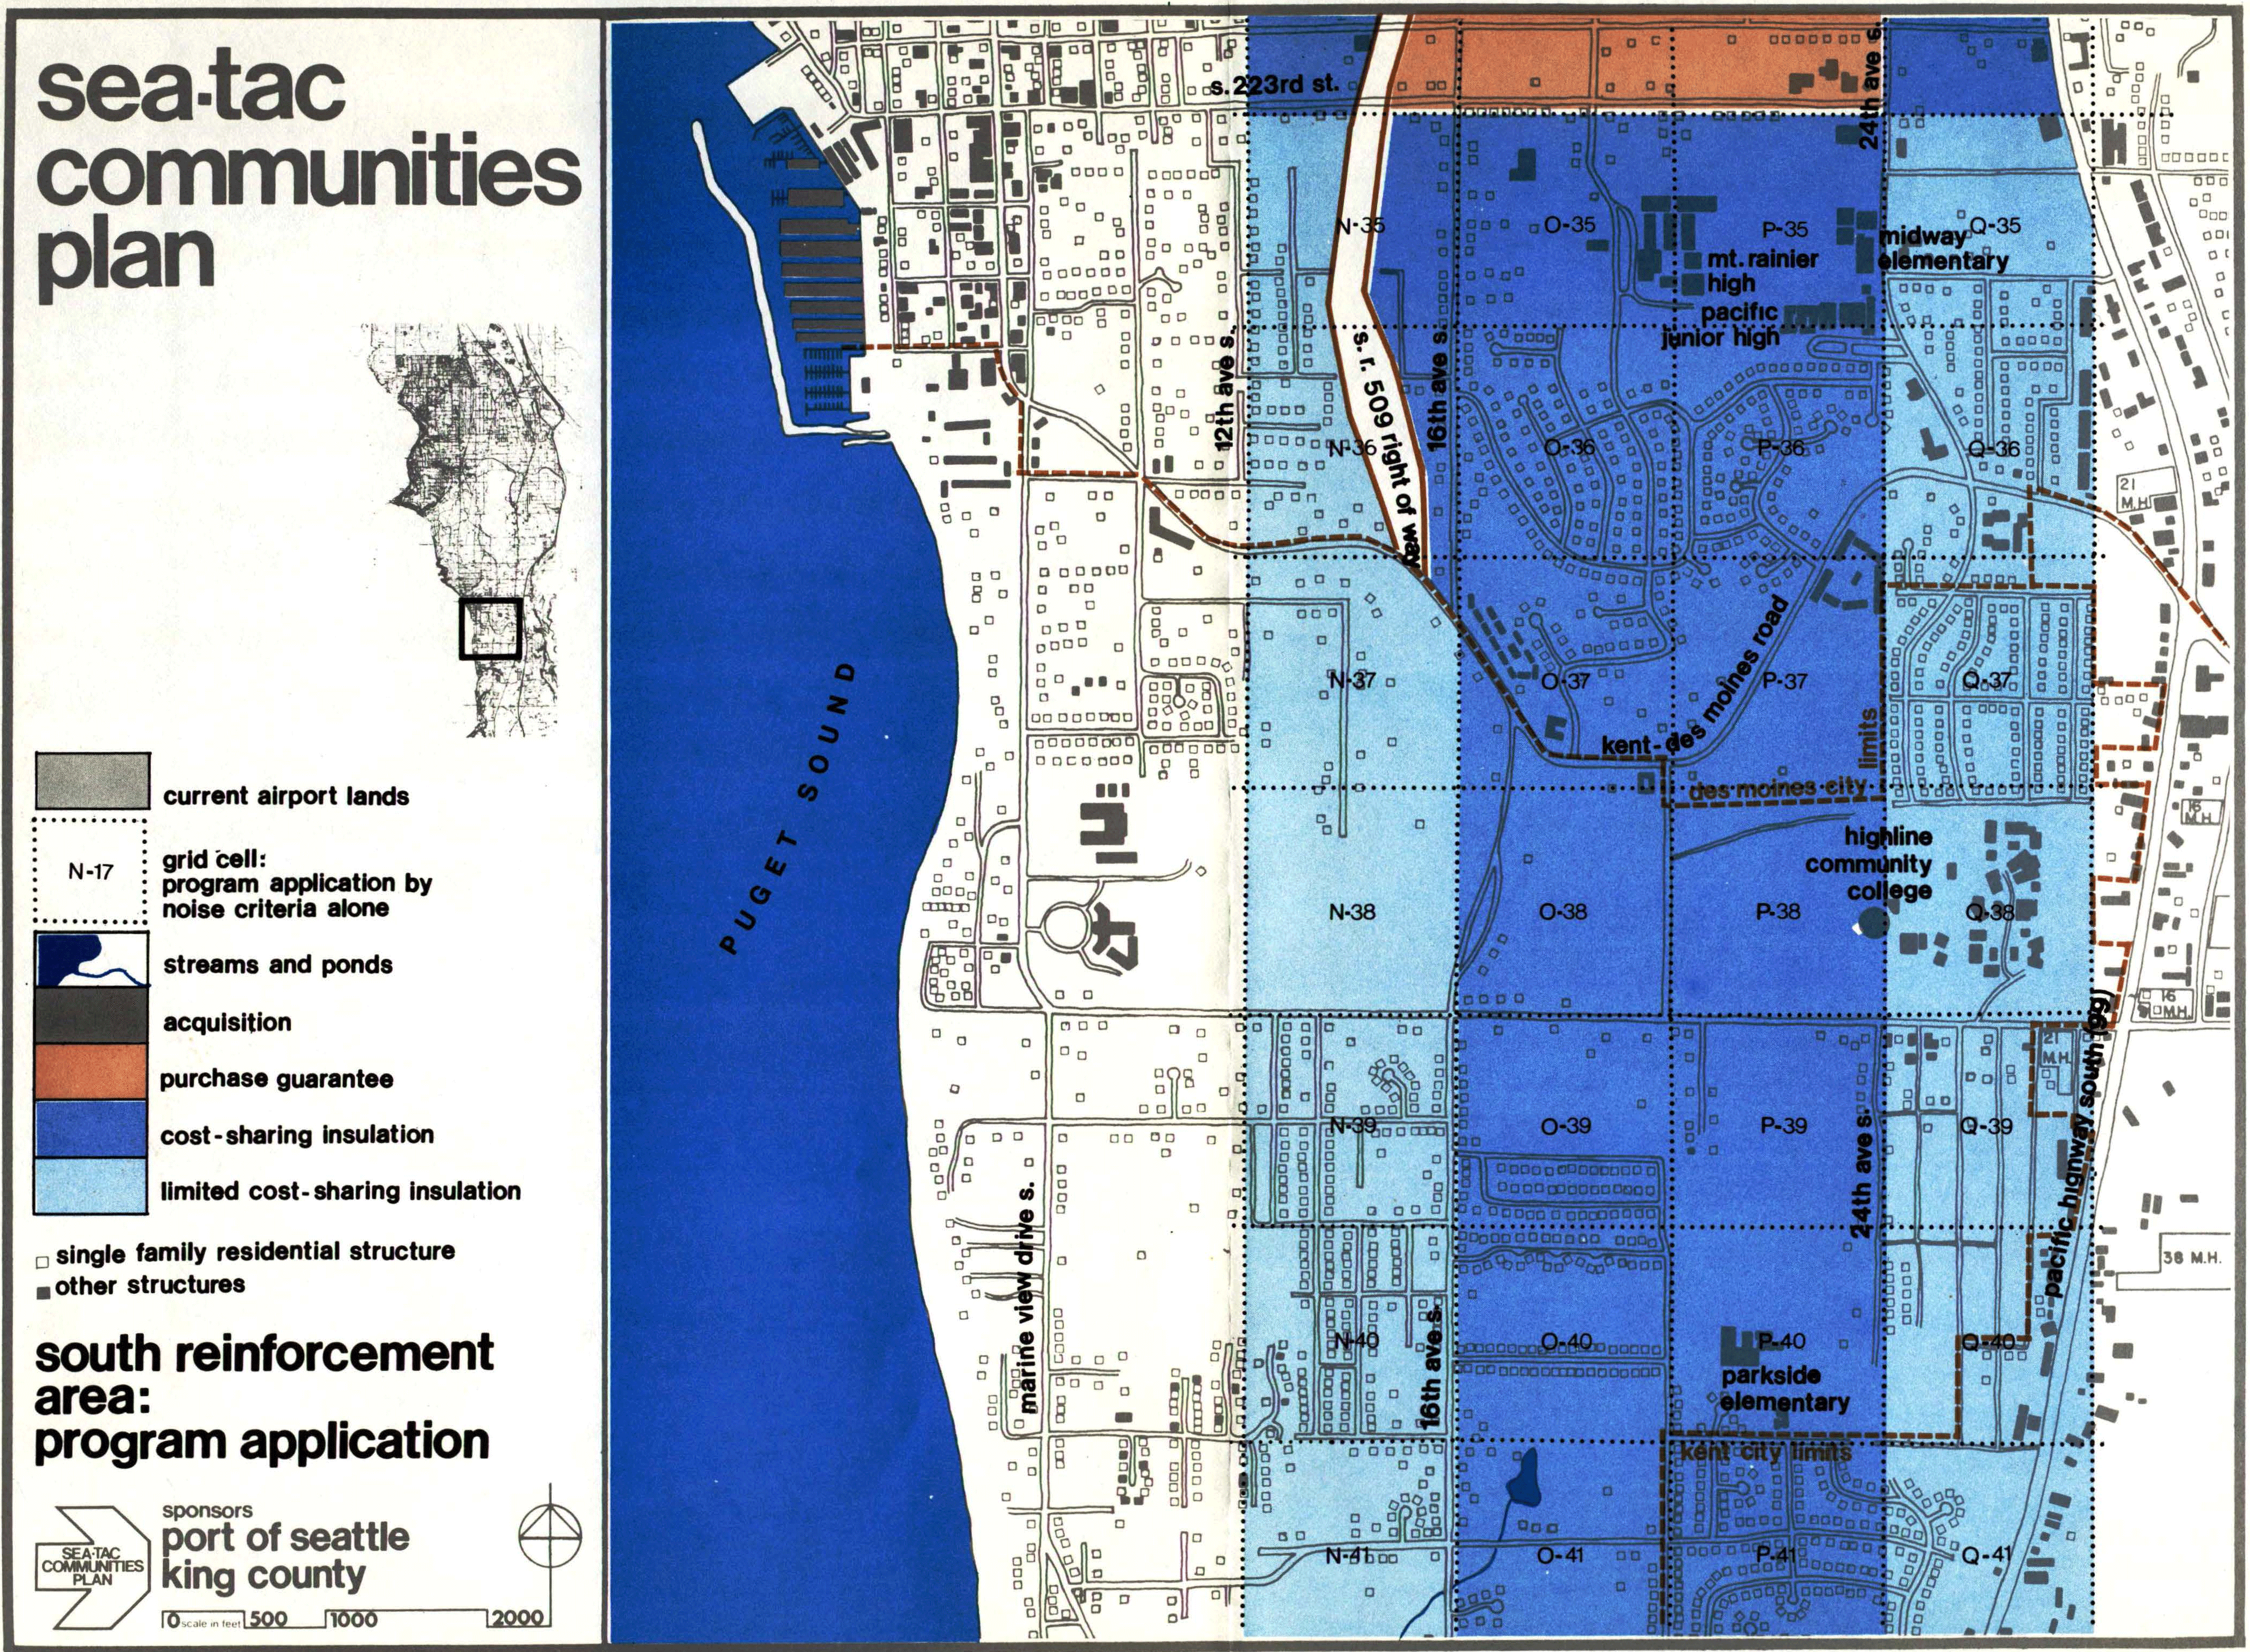
STCP-6.6.5-27-south
A planning map from the Sea-Tac Communities Plan, sponsored by the Port of Seattle and King County, showing the South Reinforcement Area program application with color-coded zones indicating acquisition, purchase guarantee, cost-sharing insulation, and limited cost-sharing insulation relative to airport noise contours. The map covers the area around S. 223rd Street south to Kent city limits, bounded by Puget Sound to the west and Pacific Highway South (SR-99) to the east, with landmarks including Mt. Rainier High School, Highline Community College, and Parkside Elementary labeled.