TagSea-Tac Airport(1835)
-
 2020-12-21
Airfield Simulation Modeling History and Summary: Sustainable Airport Master Plan, Seattle-Tacoma International Airport
LeighFisher memorandum summarizing airfield simulation modeling conducted for the Port Of Seattle Sustainable Airport Master Plan (SAMP) and follow-on NEPA review at Sea-Tac Airport. Covers TAAM (Total Airport and Airspace Modeller) model development from 2015 through mid-2017, including initial calibration to 2014 activity, FAA-requested recalibration to 2016 activity, maximum sustainable throughput experiments, and revised future-year -
 2020-11-18
Puget Sound Gateway Program SR 509 Completion Project: Highline Forum Presentation
The Washington State Department of Transportation (WSDOT) presented the Puget Sound Gateway Program to the Highline Forum in November 2020, outlining plans to complete SR 509 in King County and SR 167 in Pierce County. The SR 509 project includes creating a new south access point to Sea-Tac Airport, improving freight connections to the ports of Seattle and Tacoma, and reducing congestion on local roads. The program also proposes tolling as a tool for sustainable congestion management. -
 2020-10-27
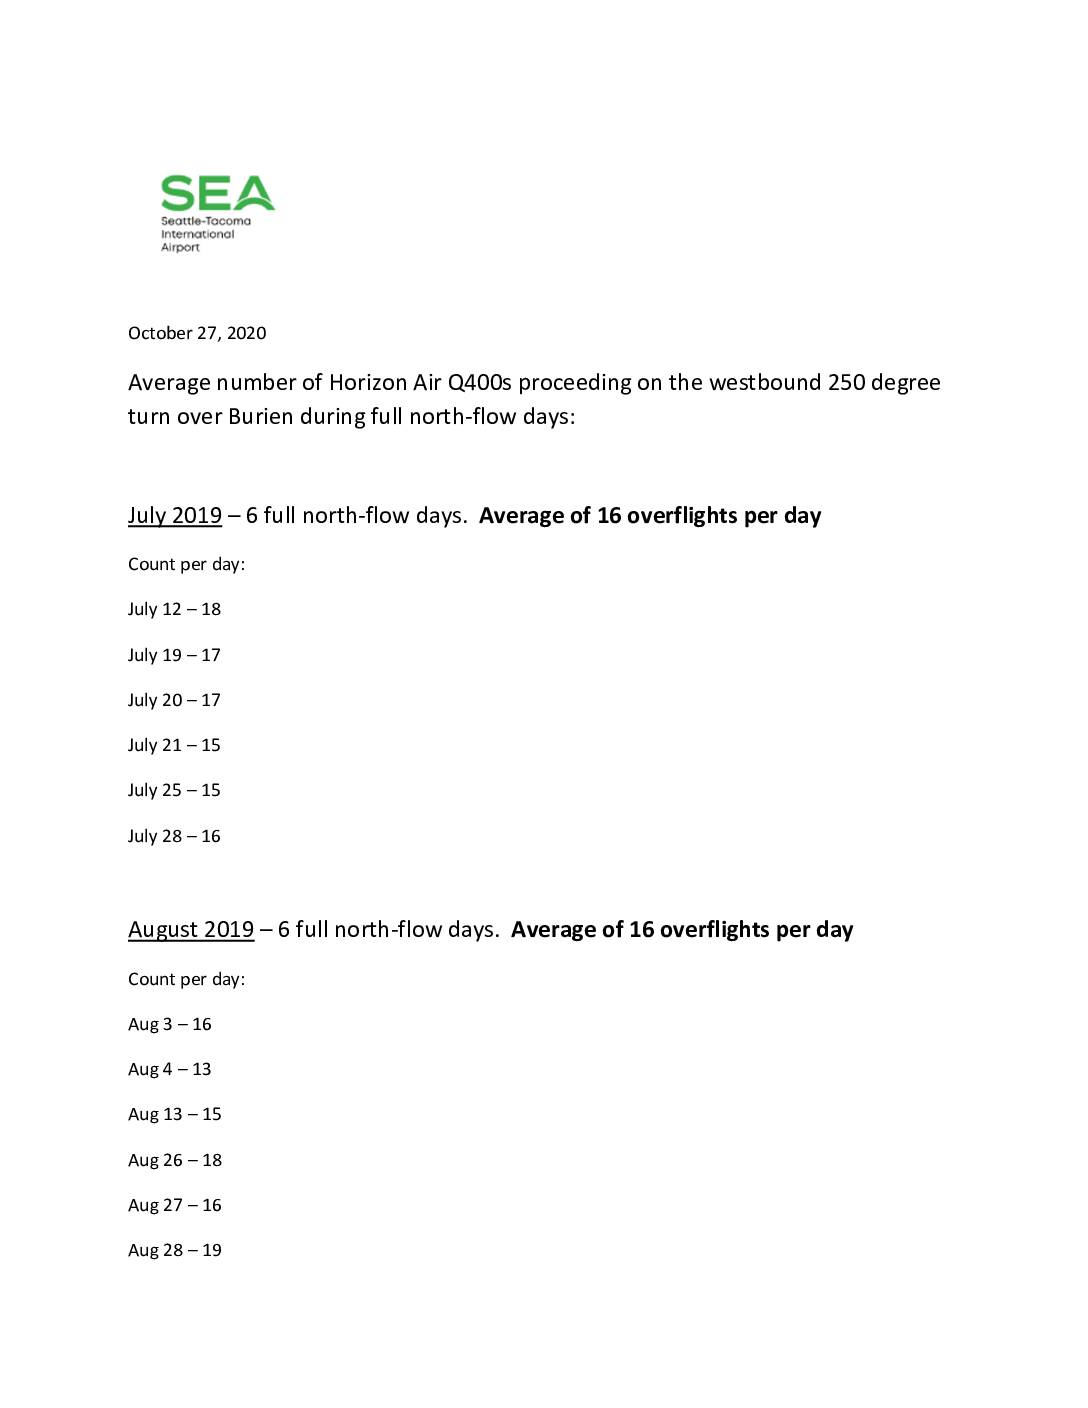
Average number of Horizon Air Q400s proceeding on the westbound 250 degree turn over Burien during full north-flow days
This October 2020 Seattle-Tacoma International Airport report tracks the average daily number of Horizon Air Q400 turboprop flights making a westbound 250-degree turn over Burien during full north-flow operating days. Data covering July and August of both 2019 and 2020 shows a modest upward trend, with monthly averages ranging from 16 flights per day in summer 2019 to 19 flights per day in August 2020. The document was likely produced in response to community noise concerns about aircraft overflights in the Burien area. -
 2020-10-27
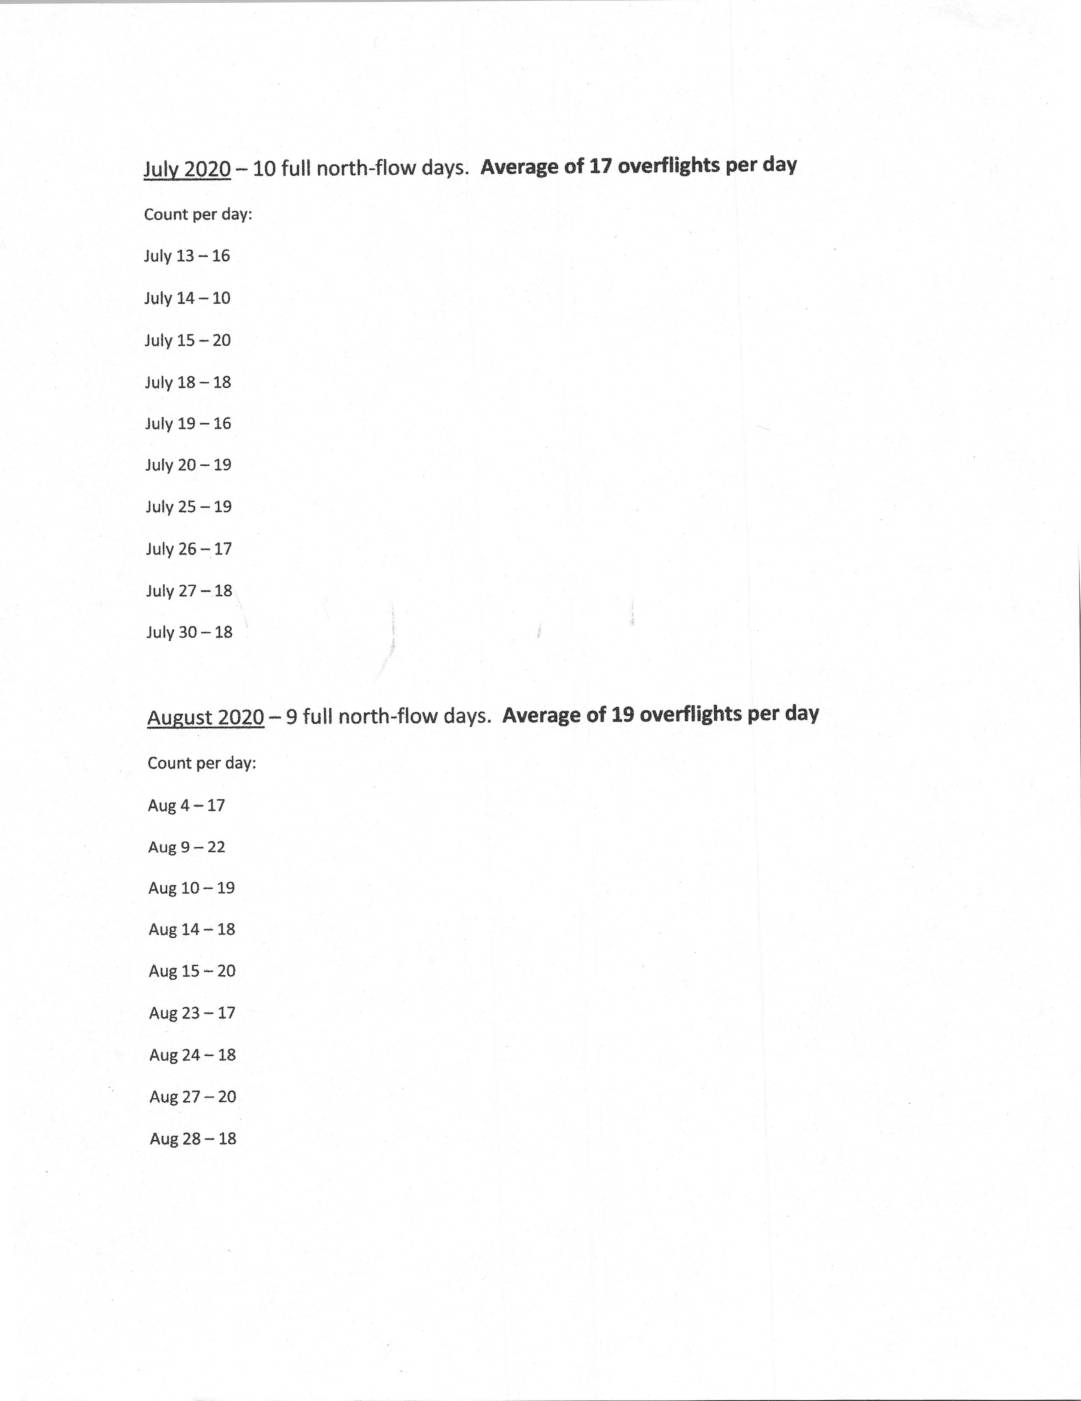
Average number of Horizon Air Q400s proceeding on the westbound 250 degree turn over Burien during full north-flow days
This October 27, 2020 document from Seattle-Tacoma International Airport tracks the average daily number of Horizon Air Q400 turboprop aircraft making a westbound 250-degree turn over the city of Burien during full north-flow operating days. Data from July and August of both 2019 and 2020 show daily overflight counts ranging from 10 to 22 aircraft, with monthly averages rising from 16 overflights per day in summer 2019 to 17–19 overflights per day in summer 2020. The records appear intended to document trends in aircraft noise exposure for residents living under that flight path. -
-

-
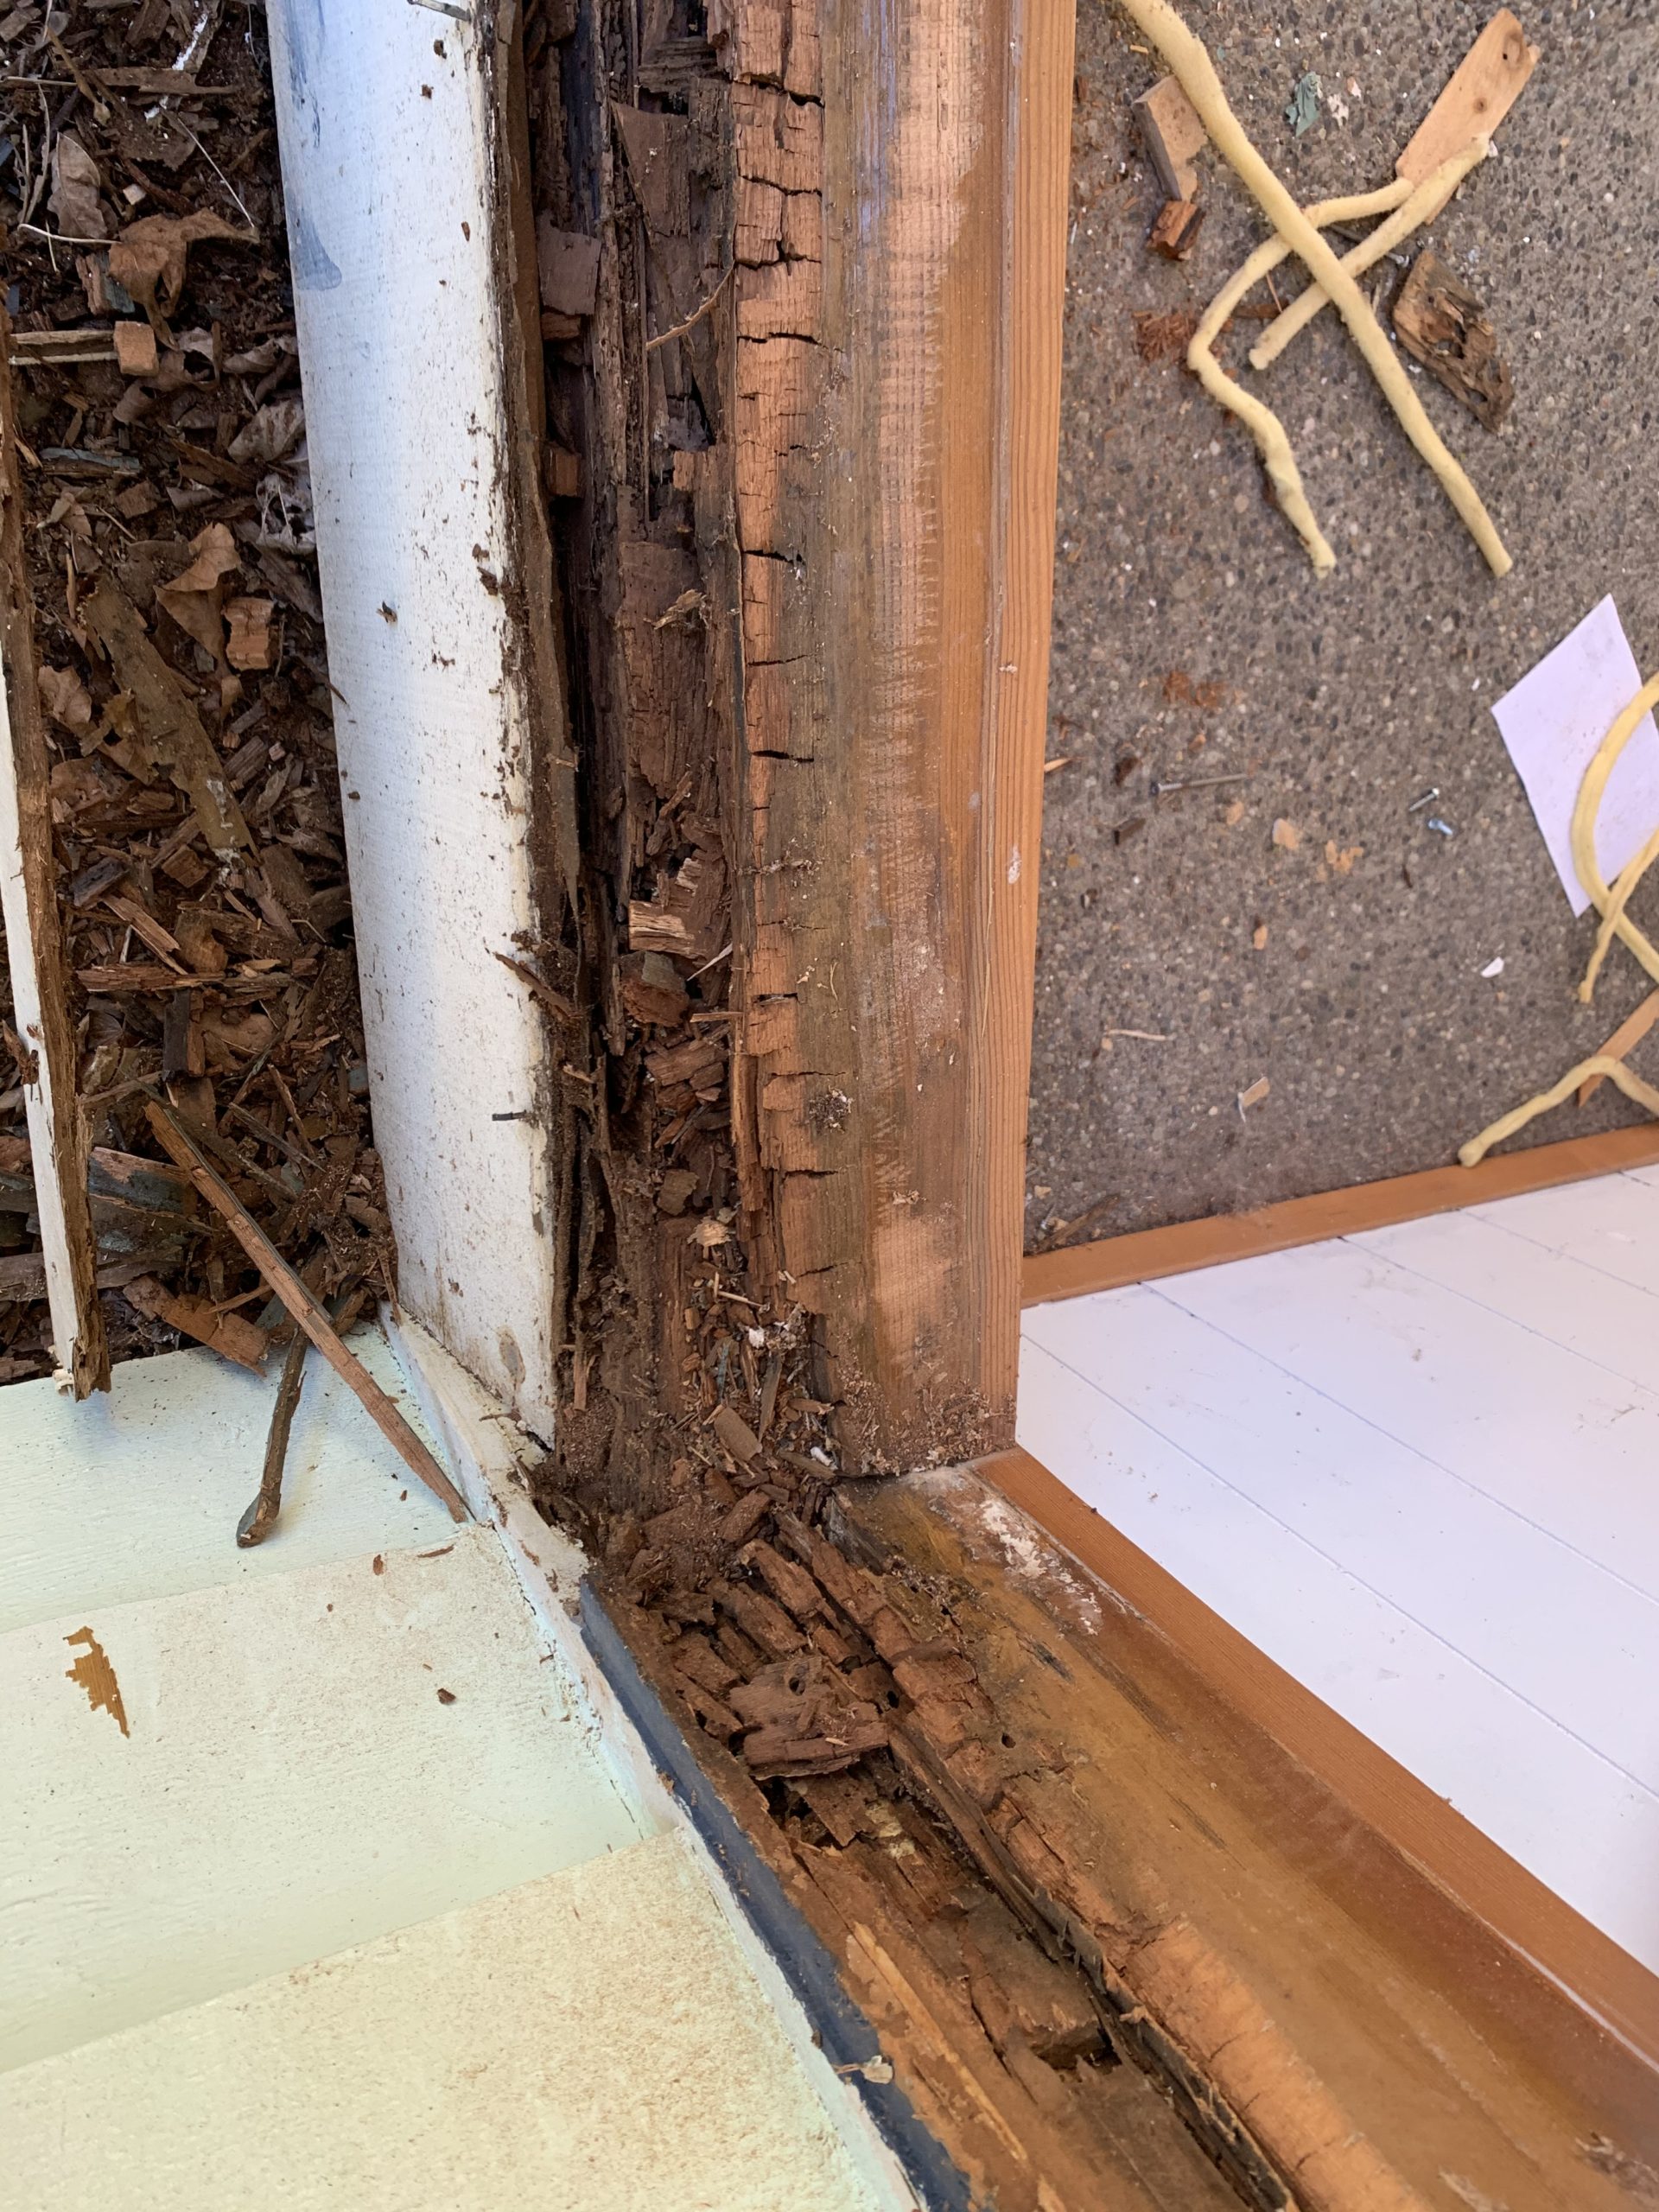
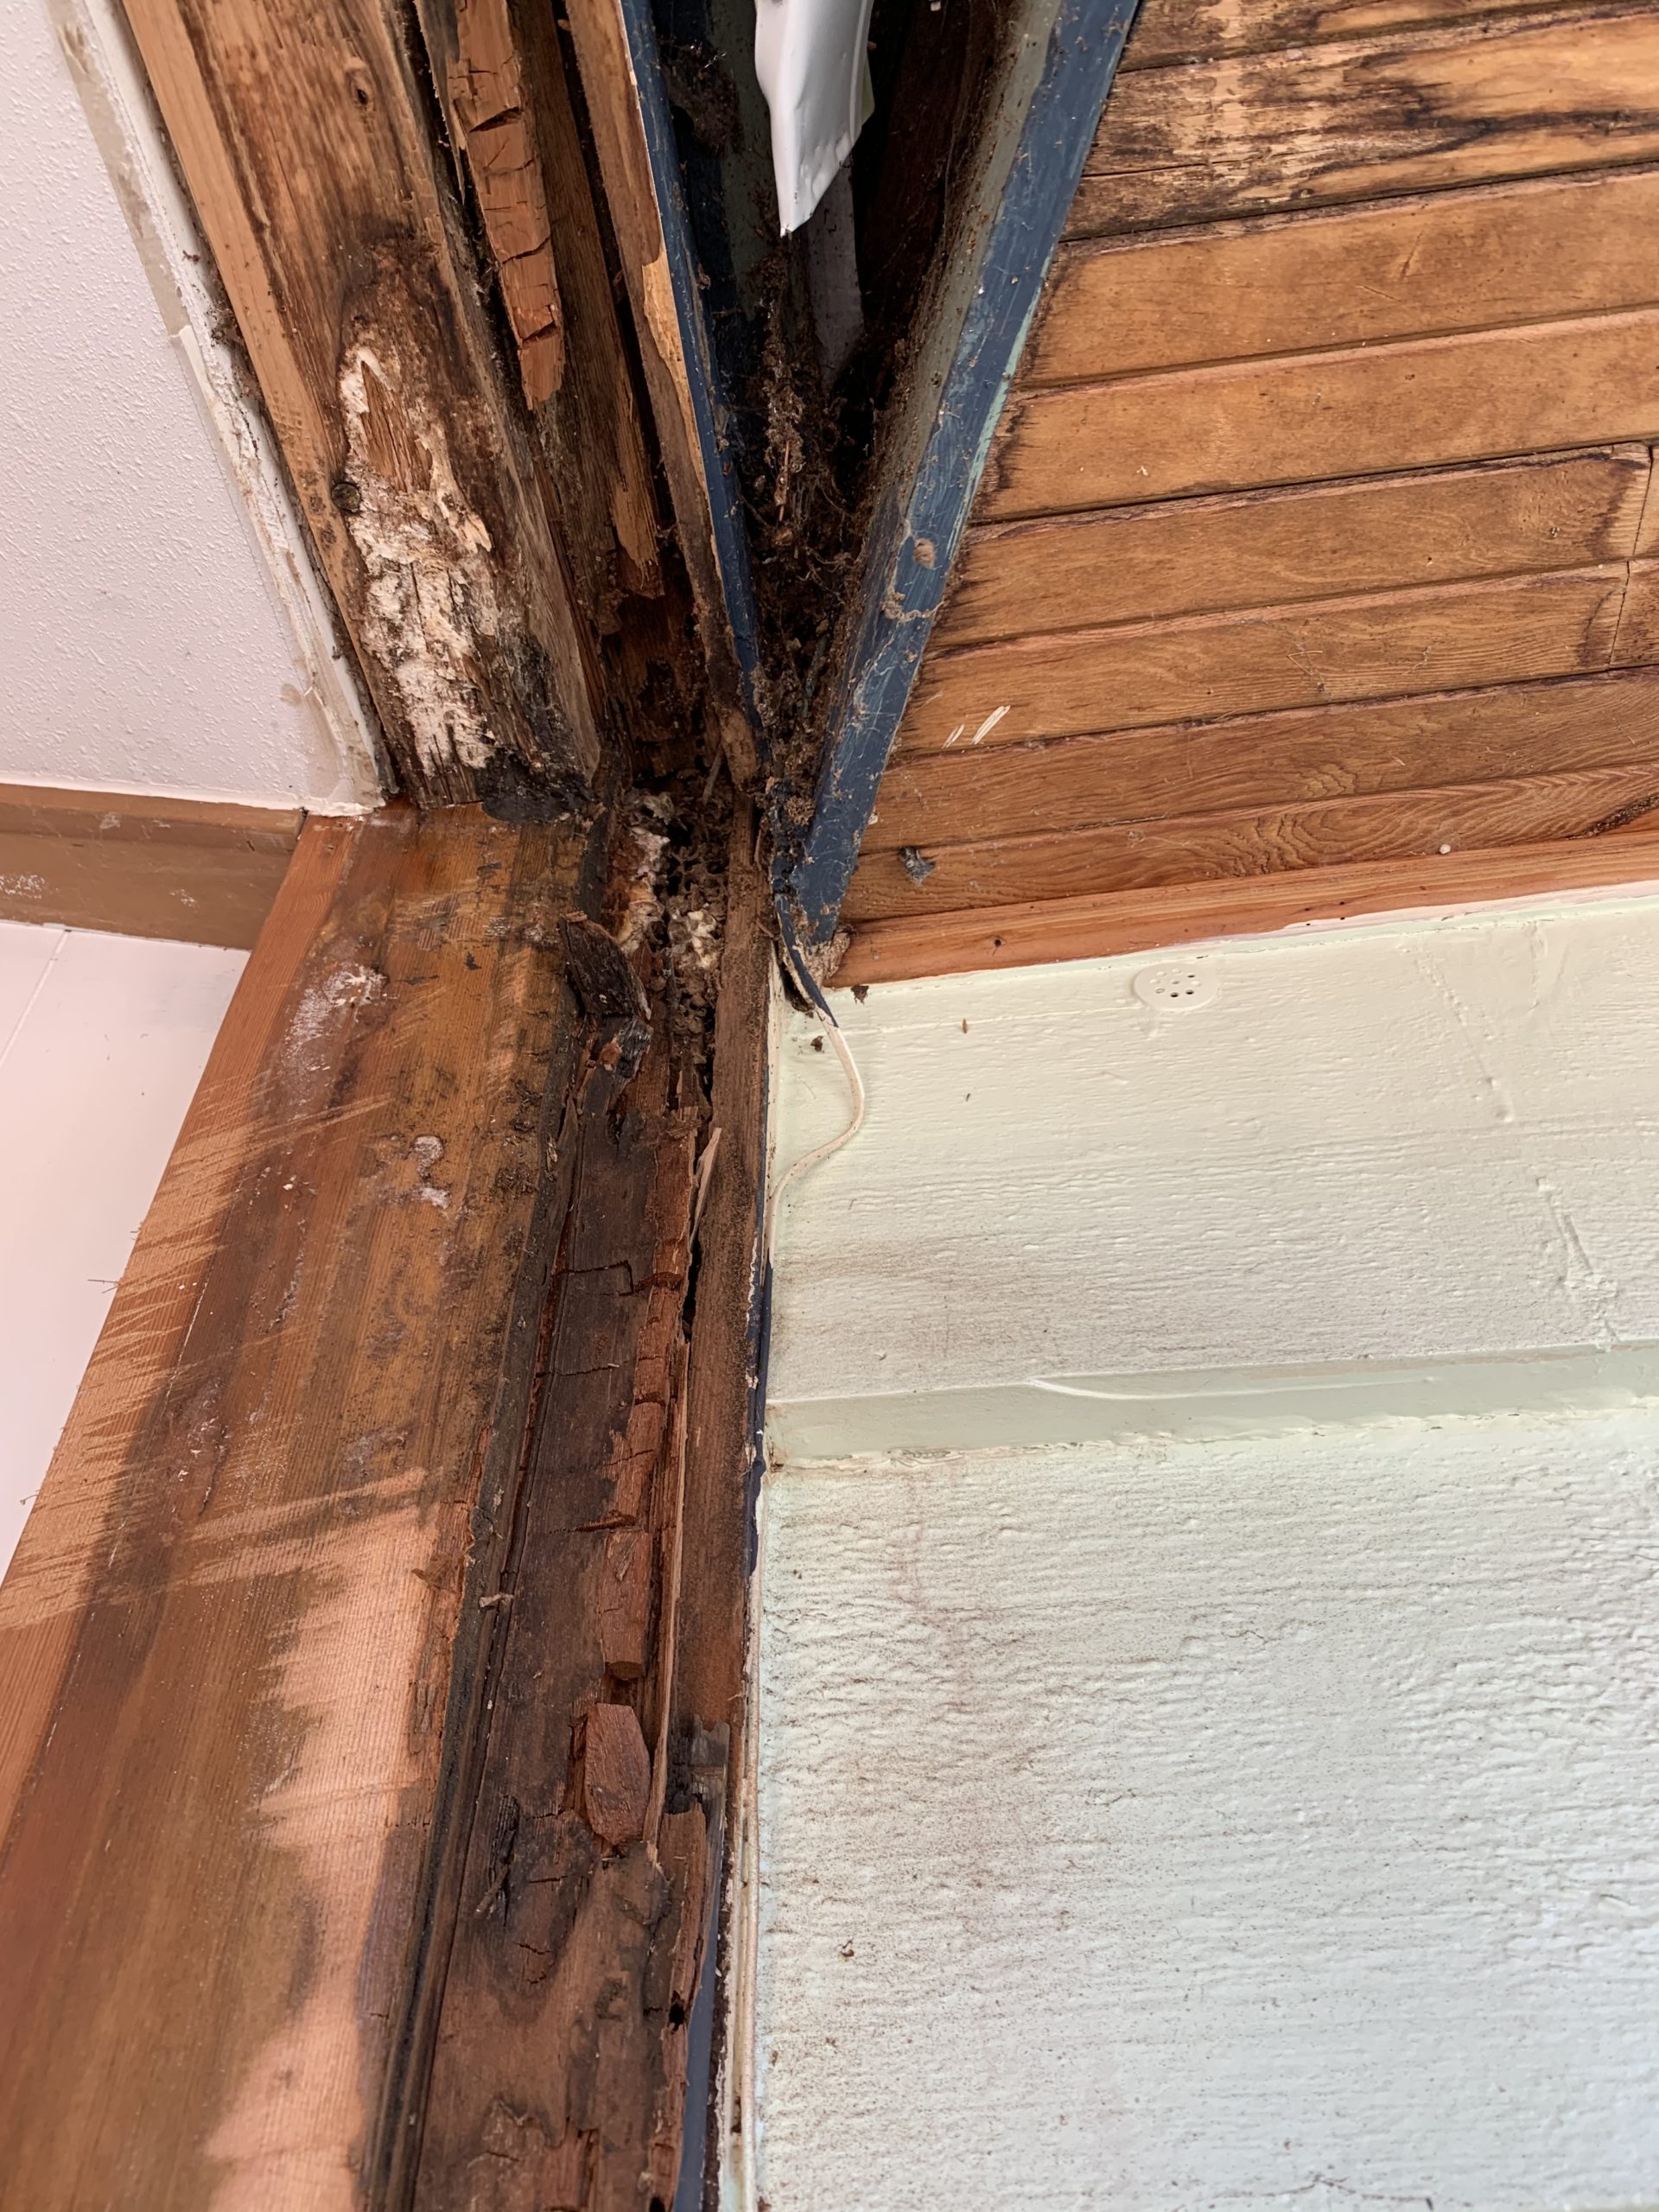
Port Package Documentation – Rotted Window Sill
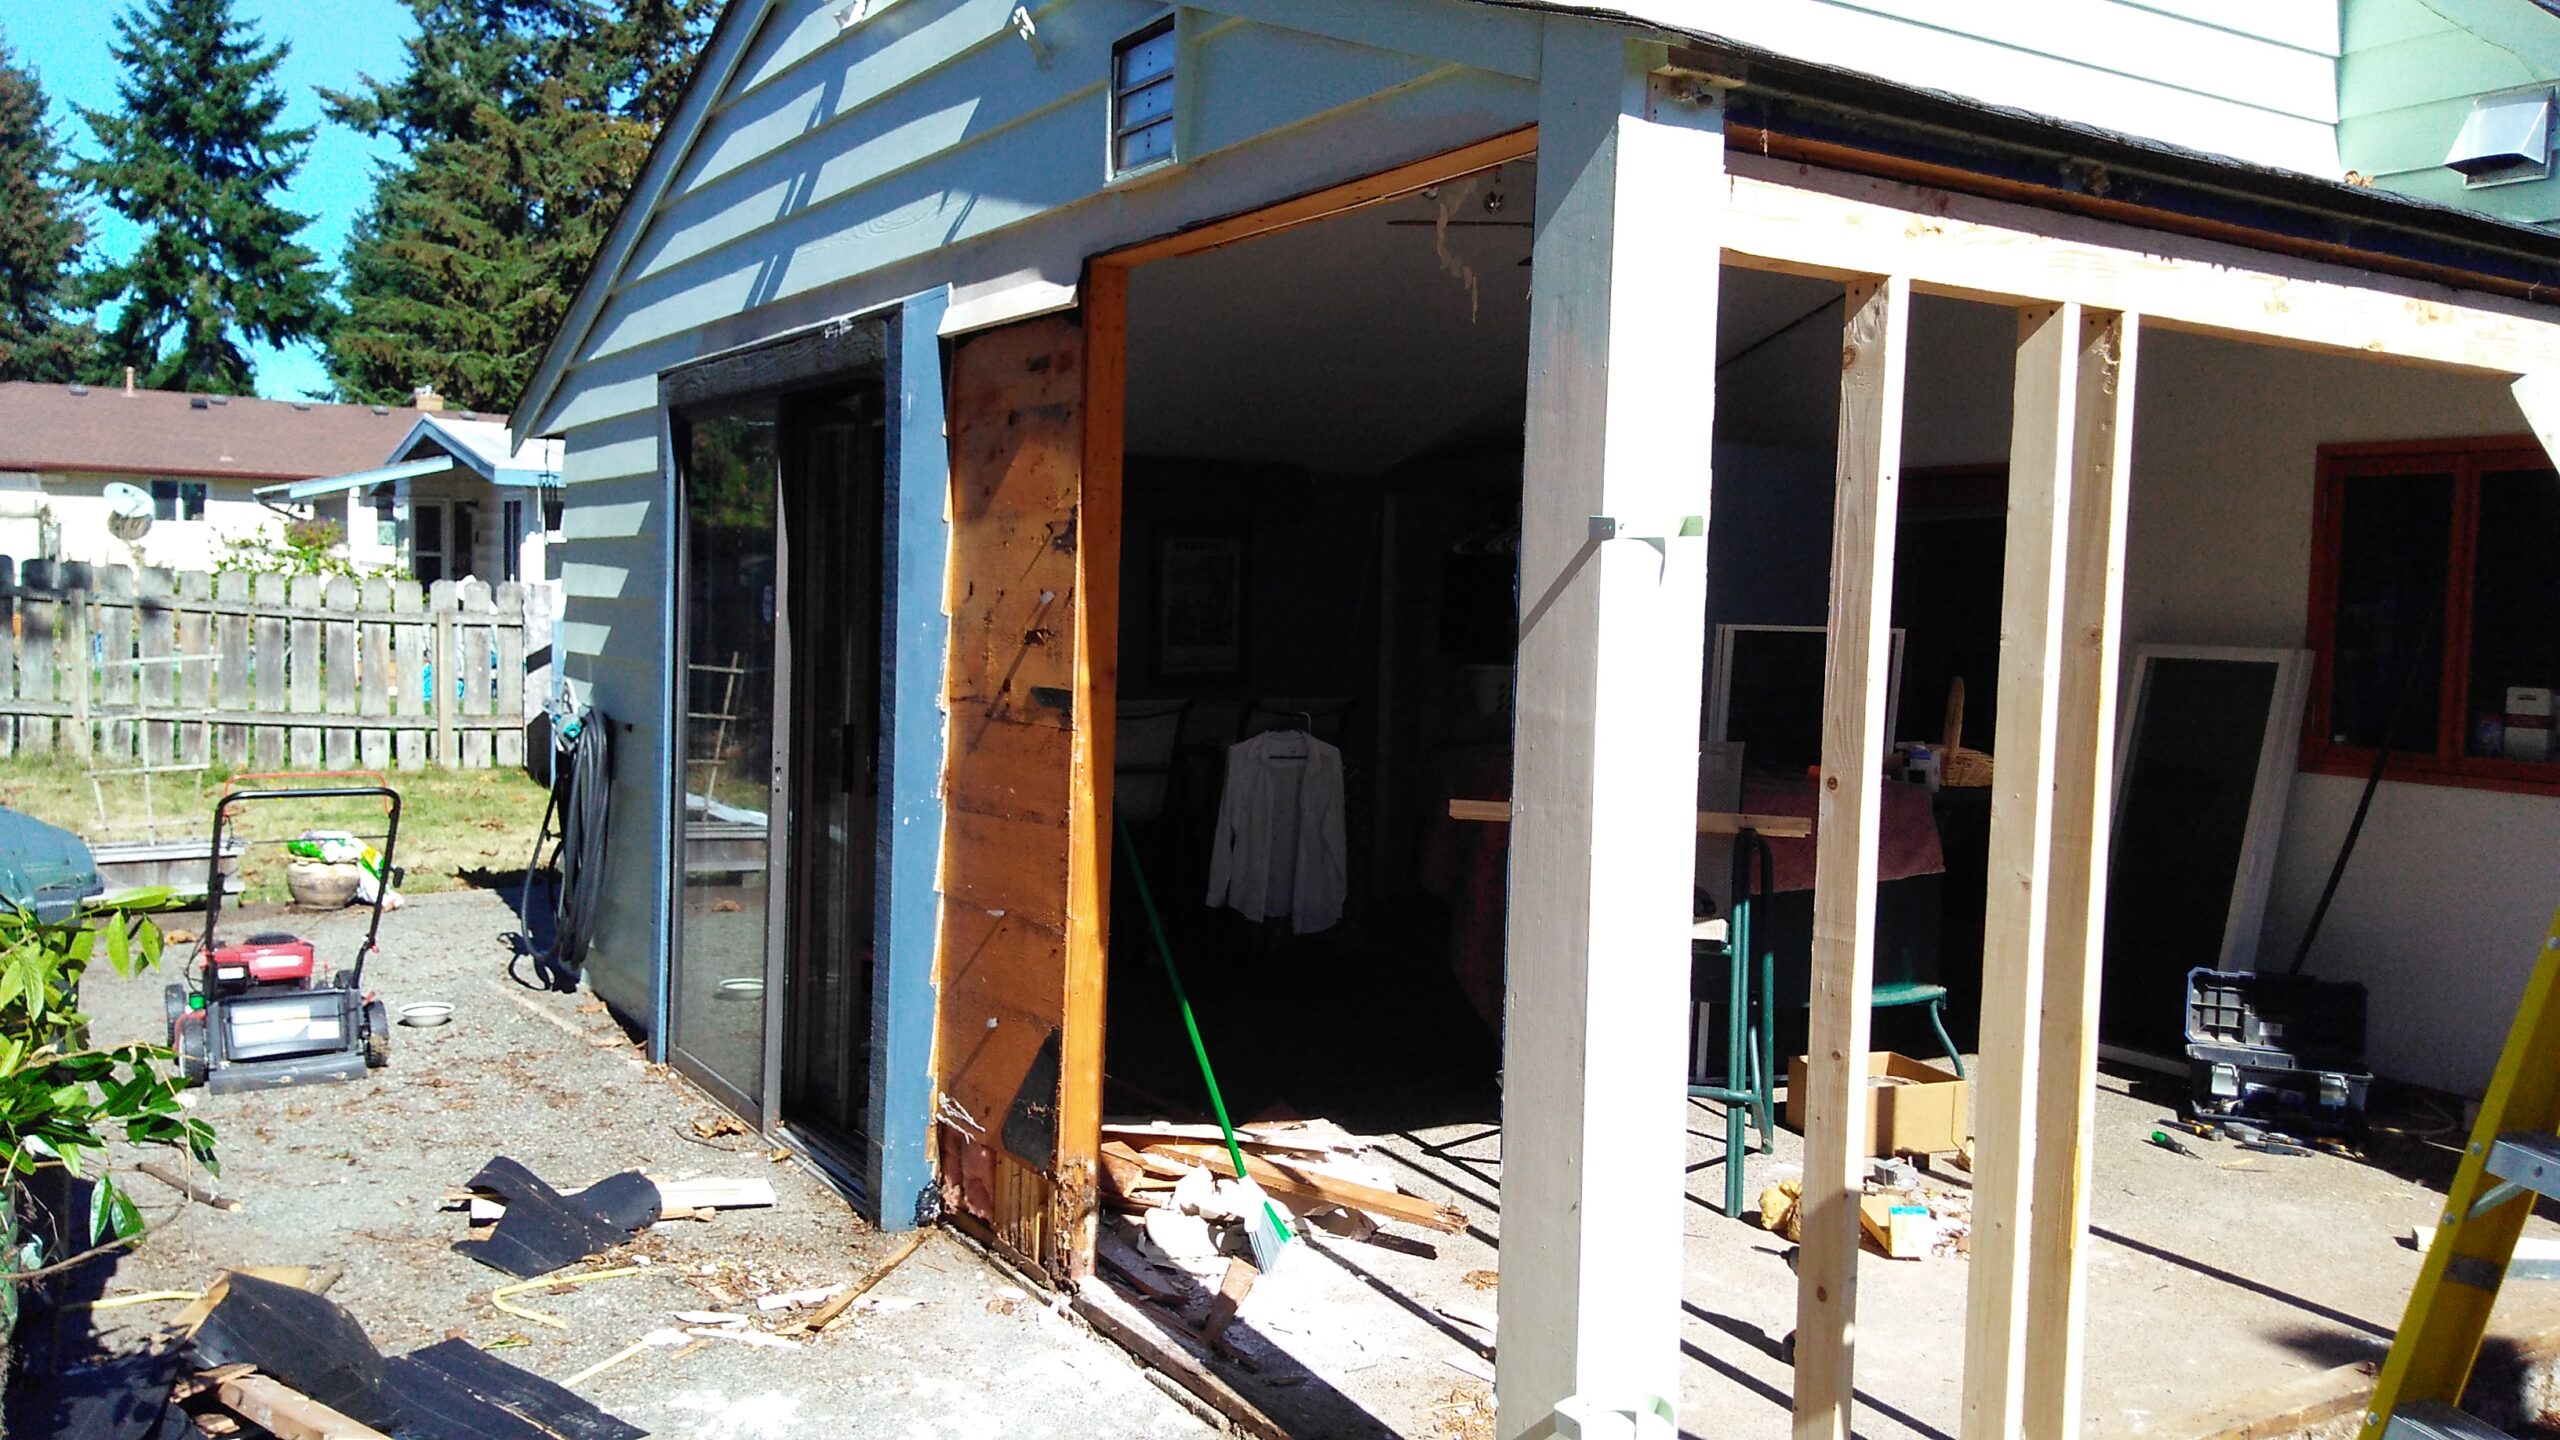
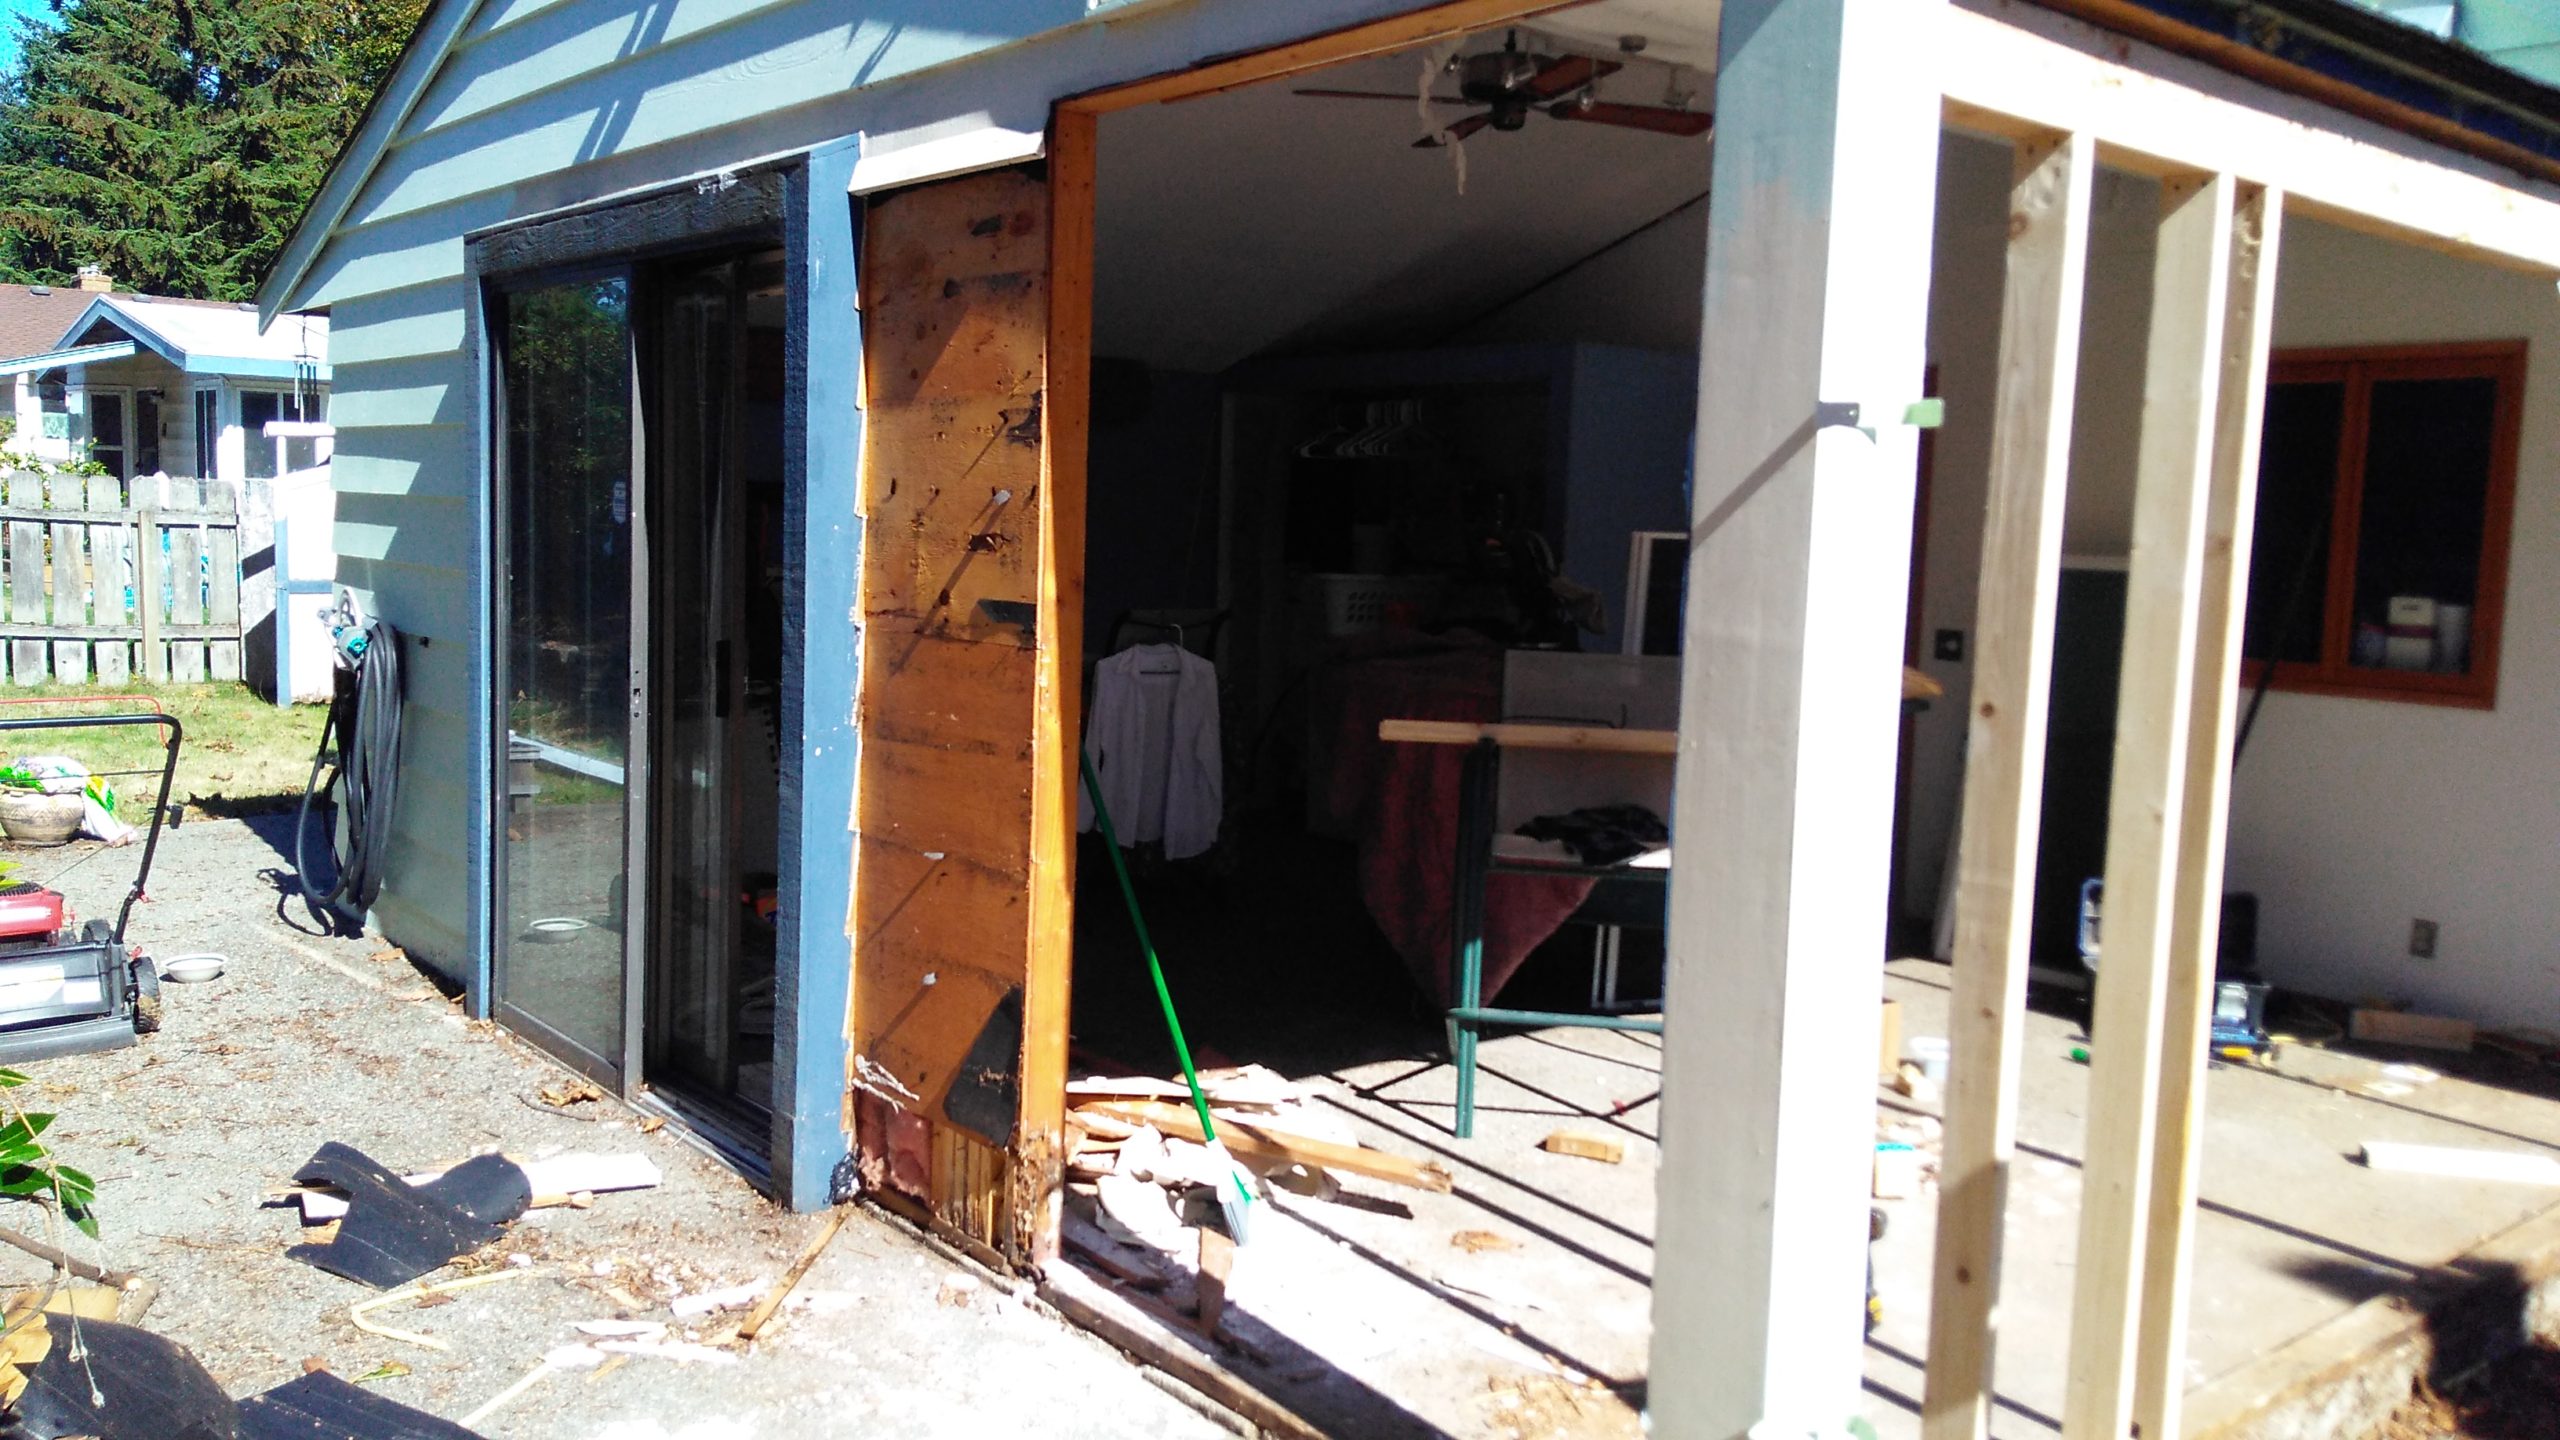
Karen Hynes, Des Moines, outer wall replacement Port Package 09-29-2020 -
 2020-09-29
Port Package Program Photo
-
-
 2020-09-29
Port Package Program Photo