TagSea-Tac Airport(1835)
-
 2020-09-25
Port Of Seattle Noise Remedy Program: Business Card, Jim Cornwell, Insulation Contract Expeditor
This is a business card for Jim Cornwell, an Insulation Contract Expeditor working in the Noise Remedy Program at Seattle-Tacoma International Airport. He was based at the Neighborhood Field Office located at 19639-A 28th Avenue S., SeaTac, WA, and could be reached by phone, pager, fax, or email through the Port of Seattle. The Noise Remedy Program focused on providing insulation solutions to help reduce airport noise impacts on surrounding residential communities. -
 2020-09-23
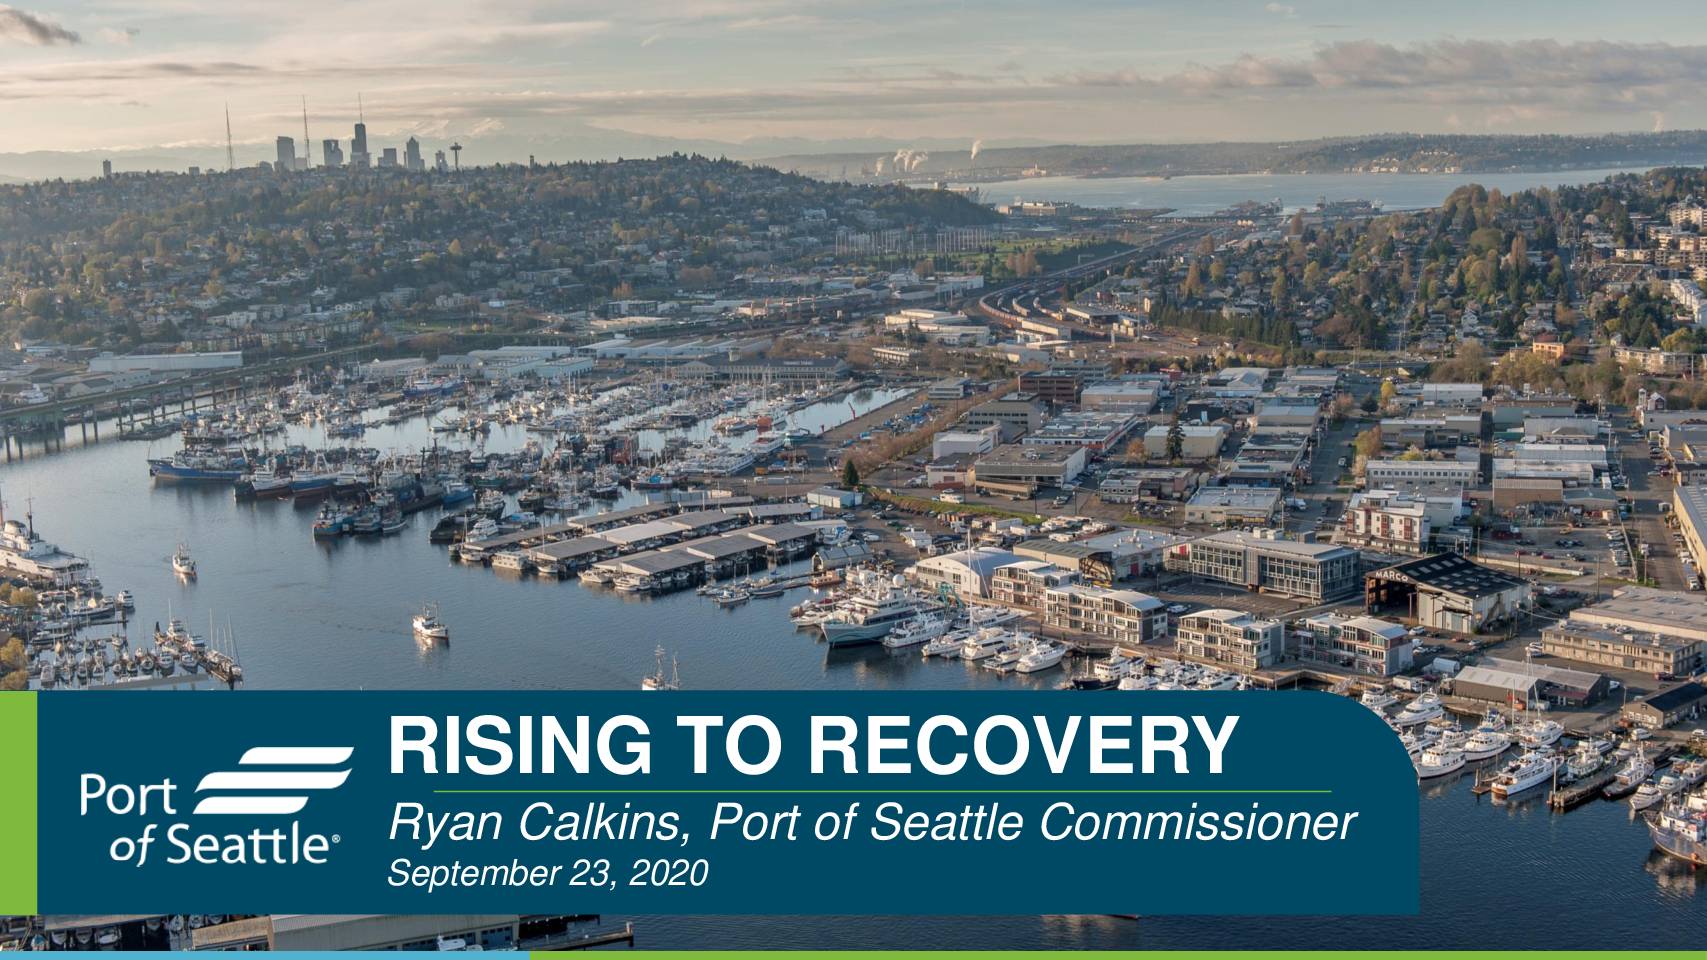
Rising to recovery
A September 2020 presentation by Port of Seattle Commissioner Ryan Calkins outlines the severe financial impact of the COVID-19 pandemic on the Port's operations, including a 75% drop in airport passengers, a 17% decline in seaport cargo activity, and a complete 100% halt in cruise traffic compared to July 2019. The Seattle-Tacoma International Airport (SEA) was projected to handle only around 20 million passengers in 2020, down sharply from a record 51.8 million in 2019. The presentation also provides historical context by comparing the 2020 downturn to previous industry shocks such as the 9/11 attacks and the Great Recession, both of which the airport ultimately recovered from. -
 2020-09-22
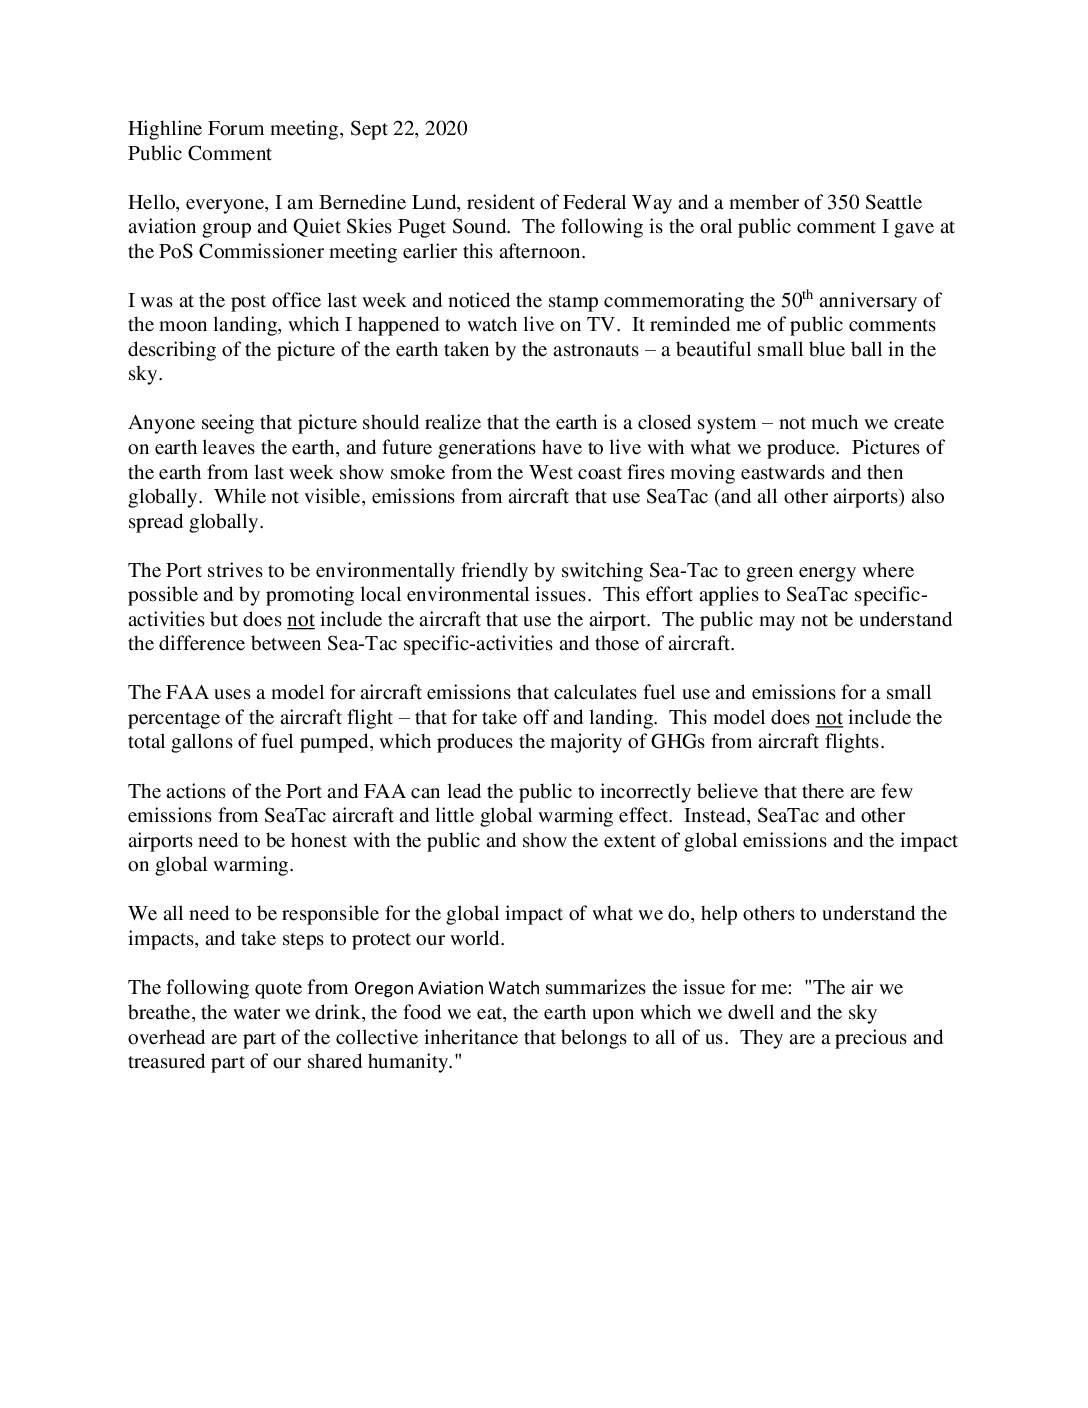
Highline Forum Public Comment by Bernedine Lund on Aircraft Emissions and Sea-Tac Airport
At a September 2020 Highline Forum meeting, Federal Way resident Bernedine Lund argued that Sea-Tac Airport and the FAA are misleading the public about aircraft emissions by only measuring fuel use during takeoff and landing, while ignoring the far larger greenhouse gas output of full flights. She called on the Port and FAA to be transparent about the total global climate impact of aircraft using Sea-Tac. Her comments emphasized that environmental responsibility must extend beyond airport-specific operations to include the aircraft themselves. -
 2020-09-20
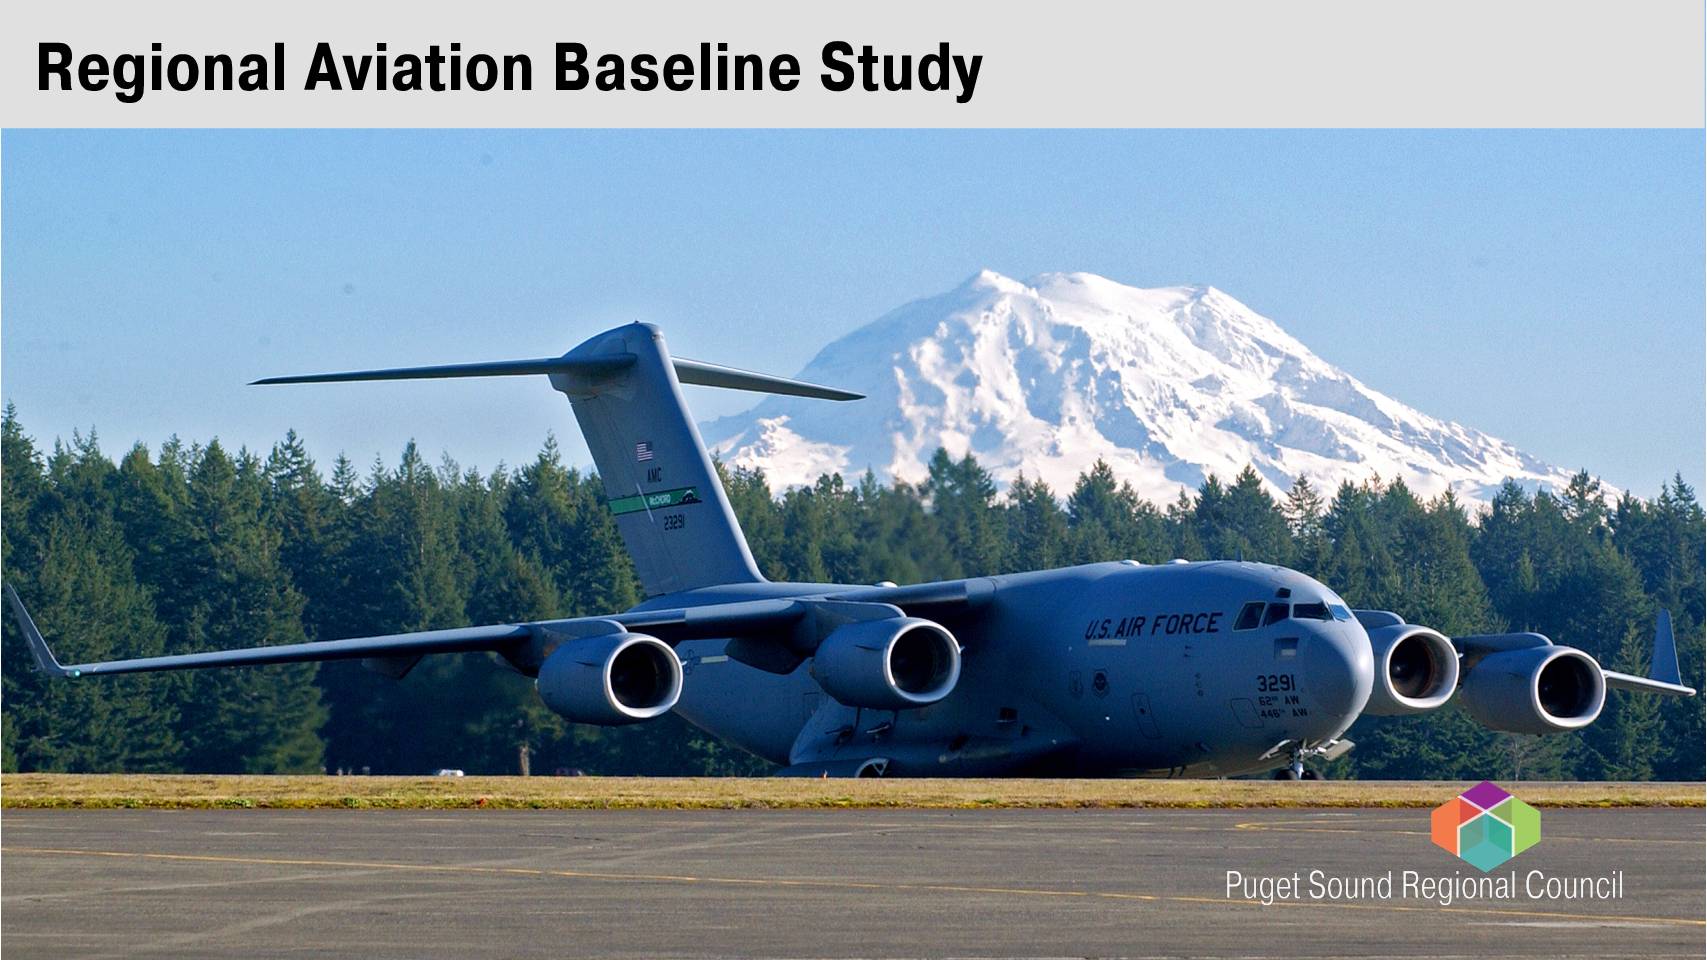
Regional Aviation Baseline Study
The Regional Aviation Baseline Study, produced by the Puget Sound Regional Council, examines the current state and future challenges of aviation in the Puget Sound region, covering scenario development, airport analysis, and public engagement. The study highlights near-term disruptions to air travel, noting that passenger volume at Seattle-Tacoma International Airport dropped to just 27% of normal levels during the COVID-19 pandemic, with daily travelers falling to 17,200 and aircraft operations declining from 1,160 to 840 takeoffs and landings per day. The findings provide a foundation for regional planning decisions related to airport capacity, operations, and policy. -
 2020-07-09
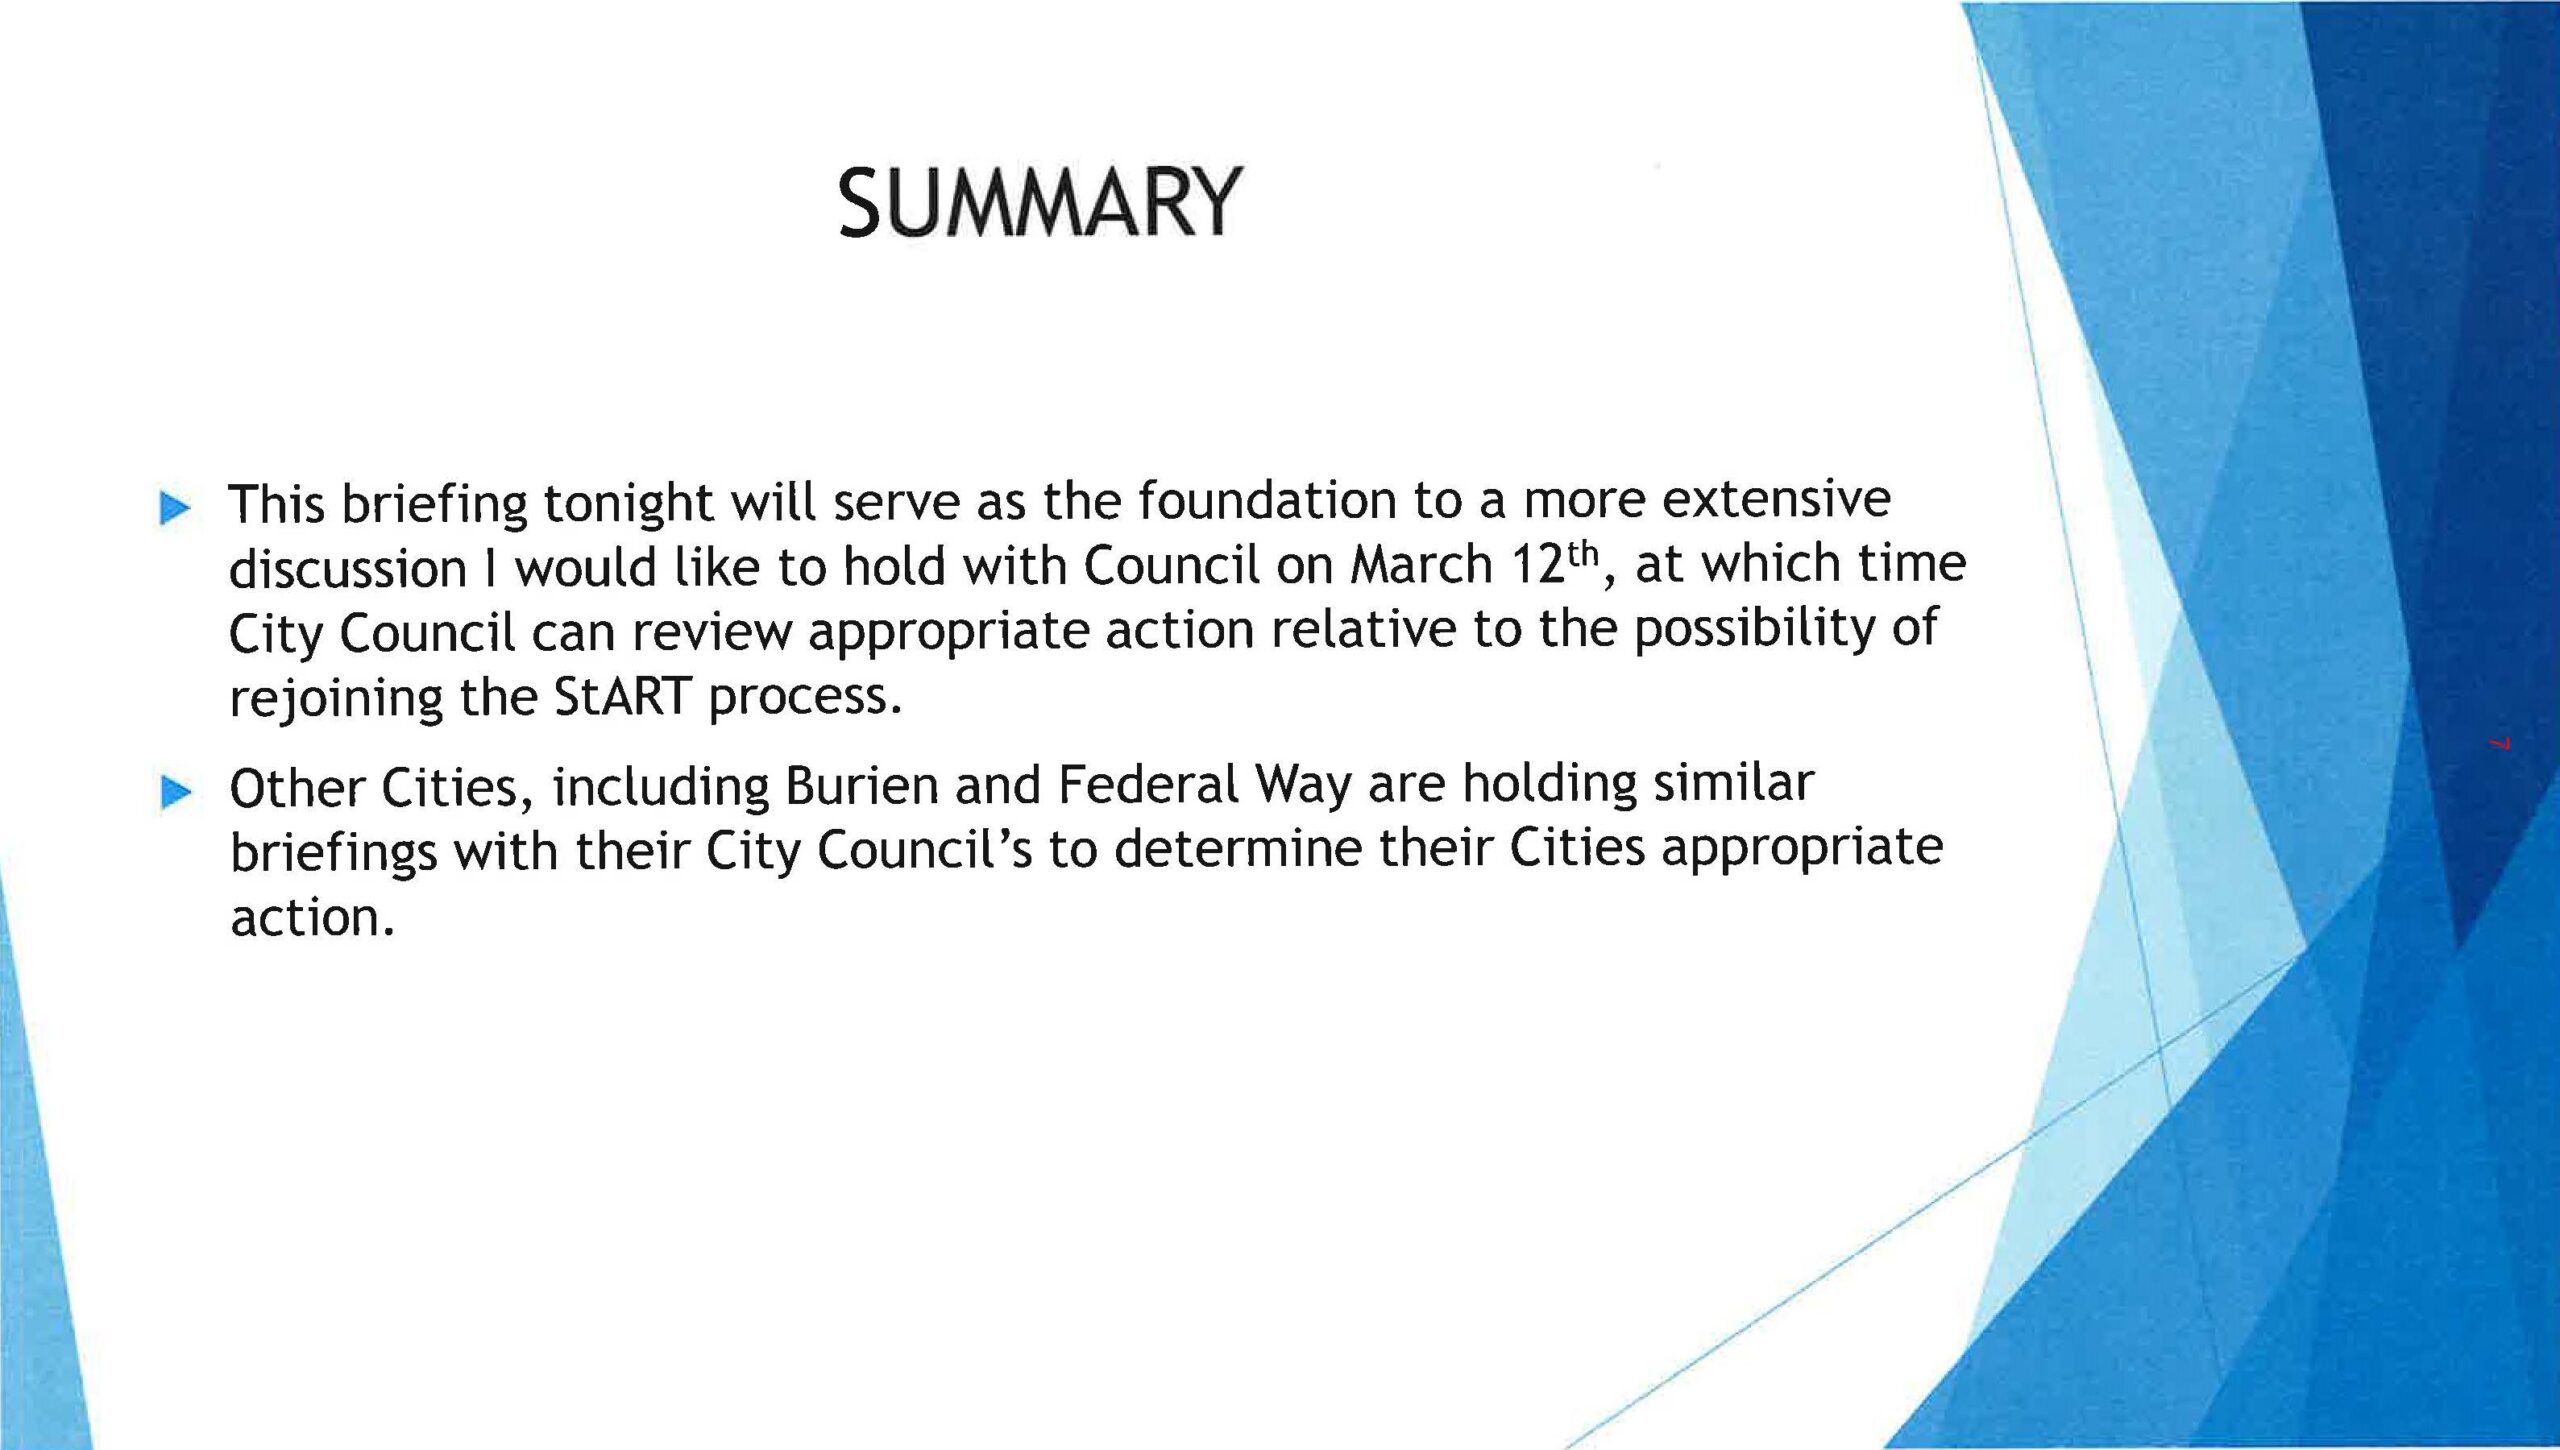
Des Moines City Council Briefing Slide on Rejoining StART Process
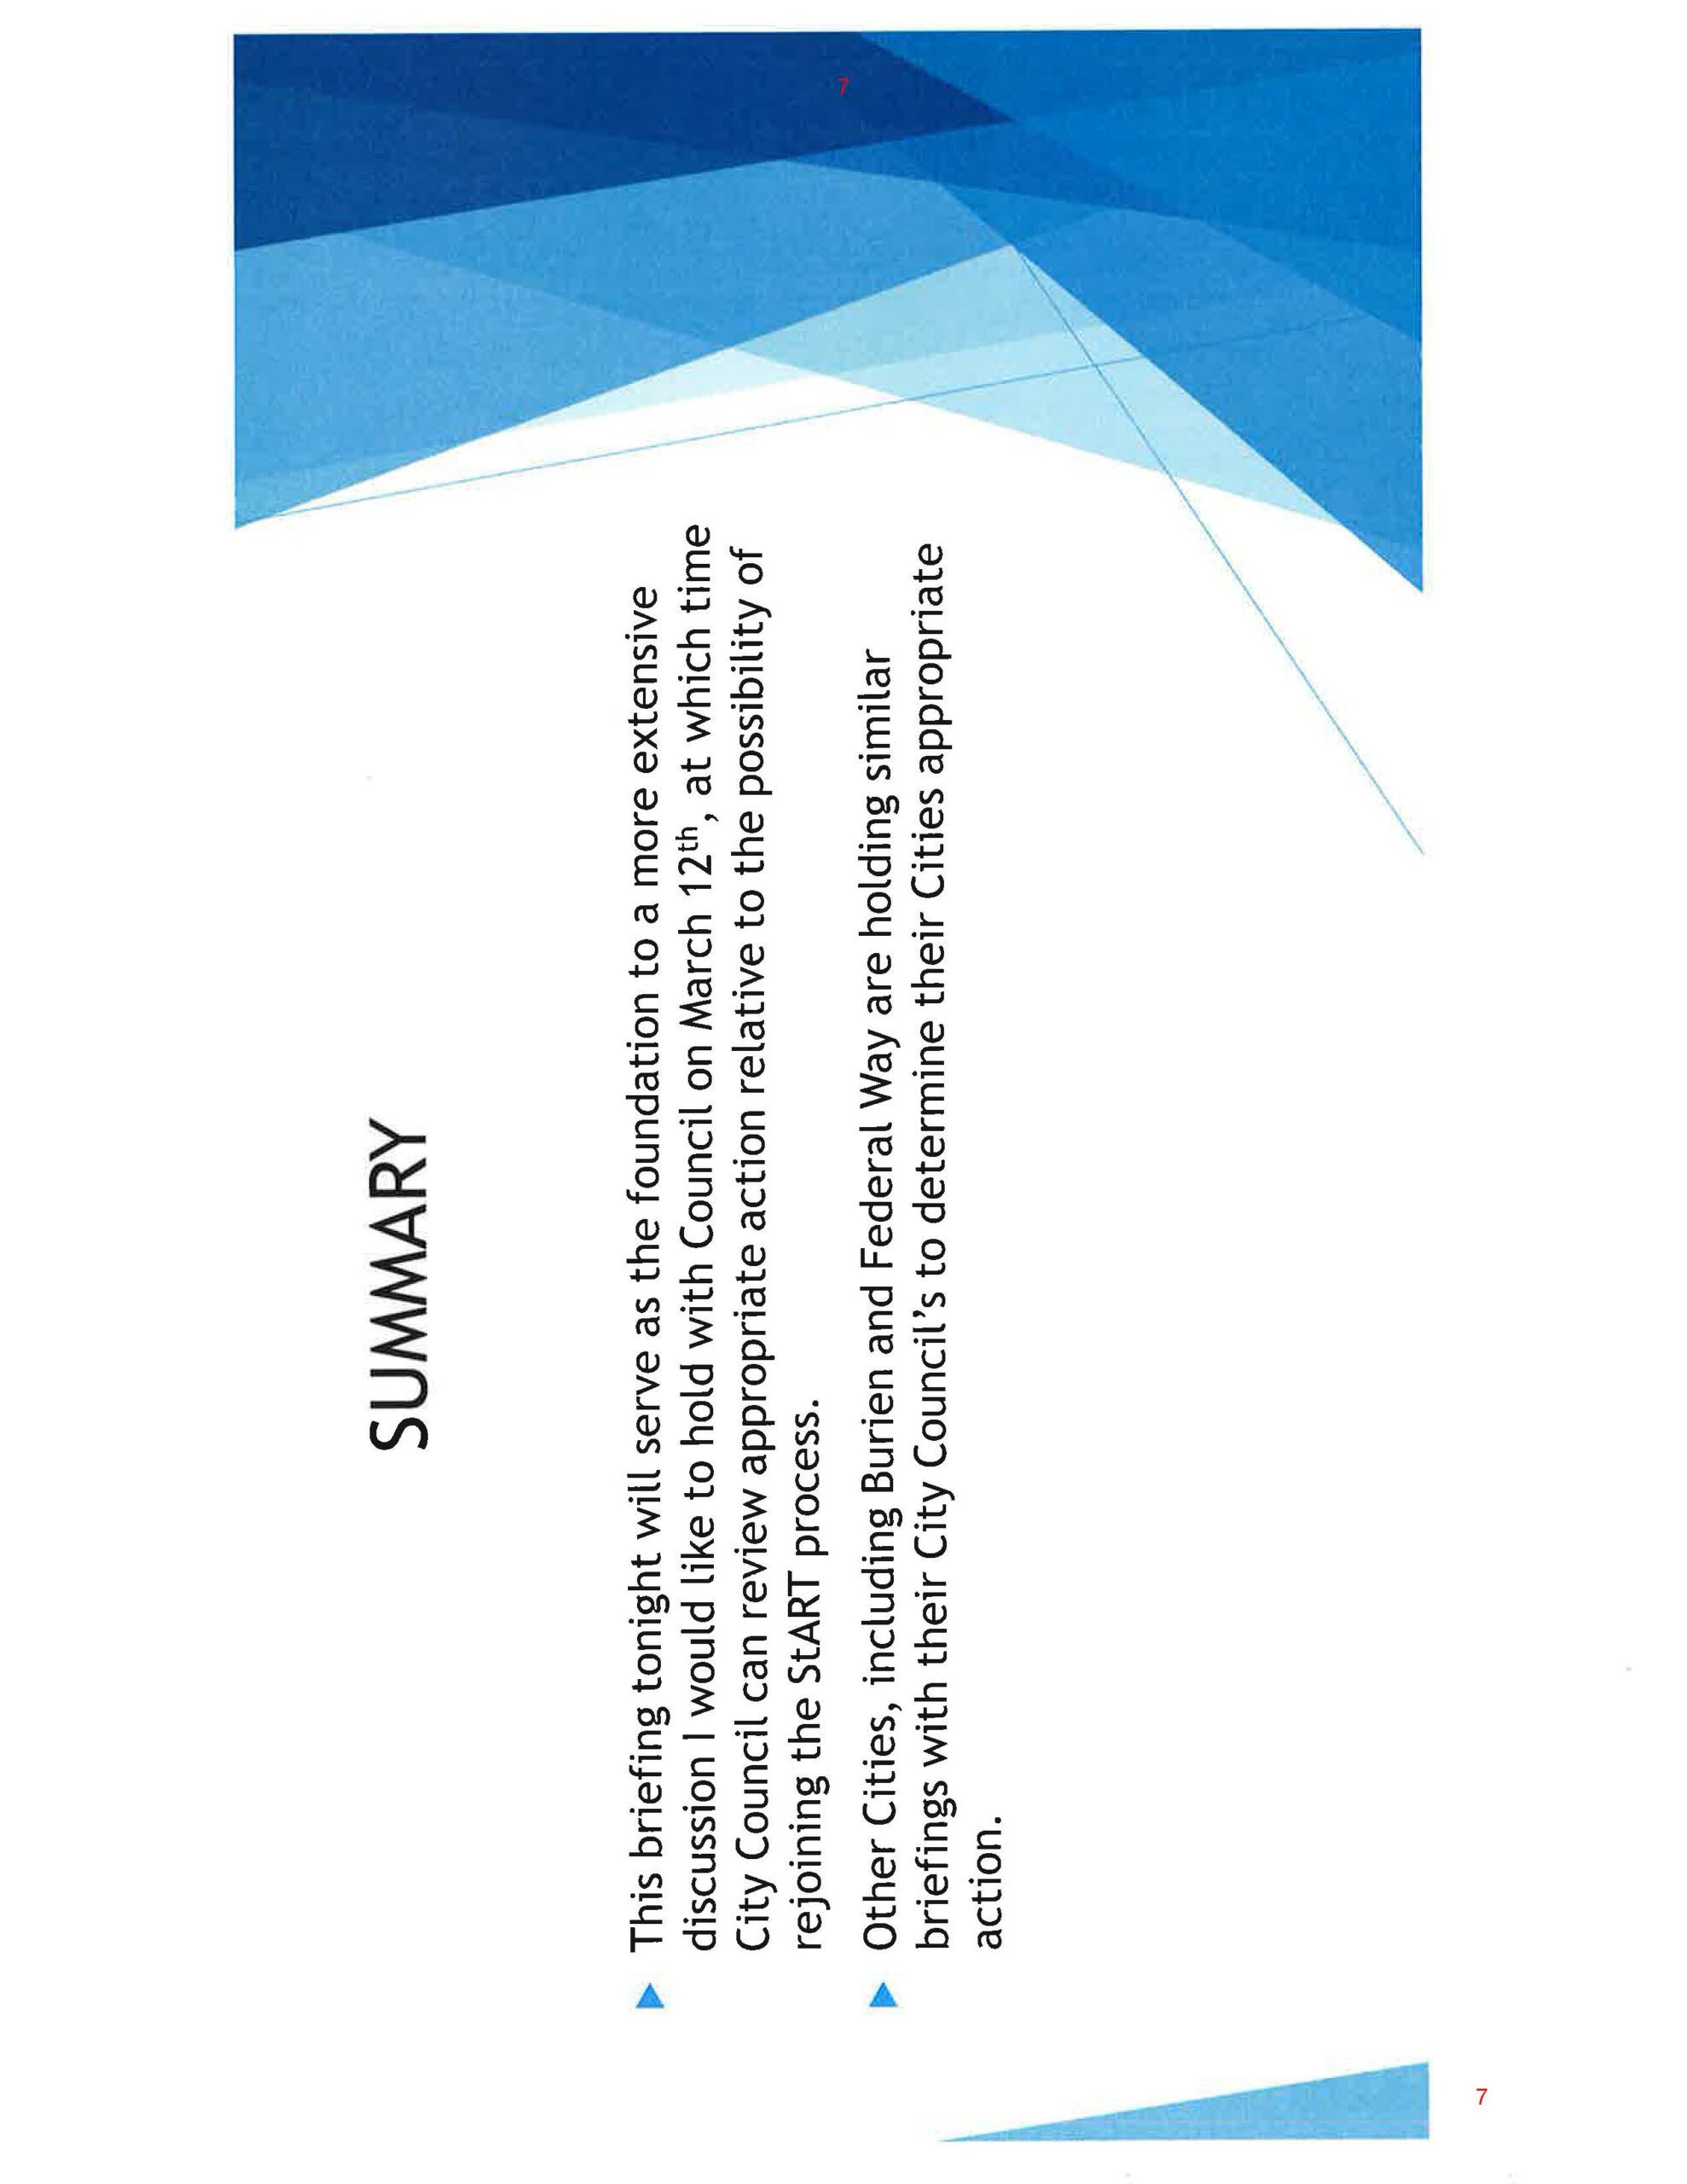
A presentation summary slide indicating that a briefing will serve as the foundation for a more extensive City Council discussion on March 12th regarding the possibility of rejoining the StART (Sea-Tac Airport Roundtable) process. The slide notes that other cities, including Burien and Federal Way, are holding similar briefings with their City Councils to determine appropriate action. -
 2020-07-09
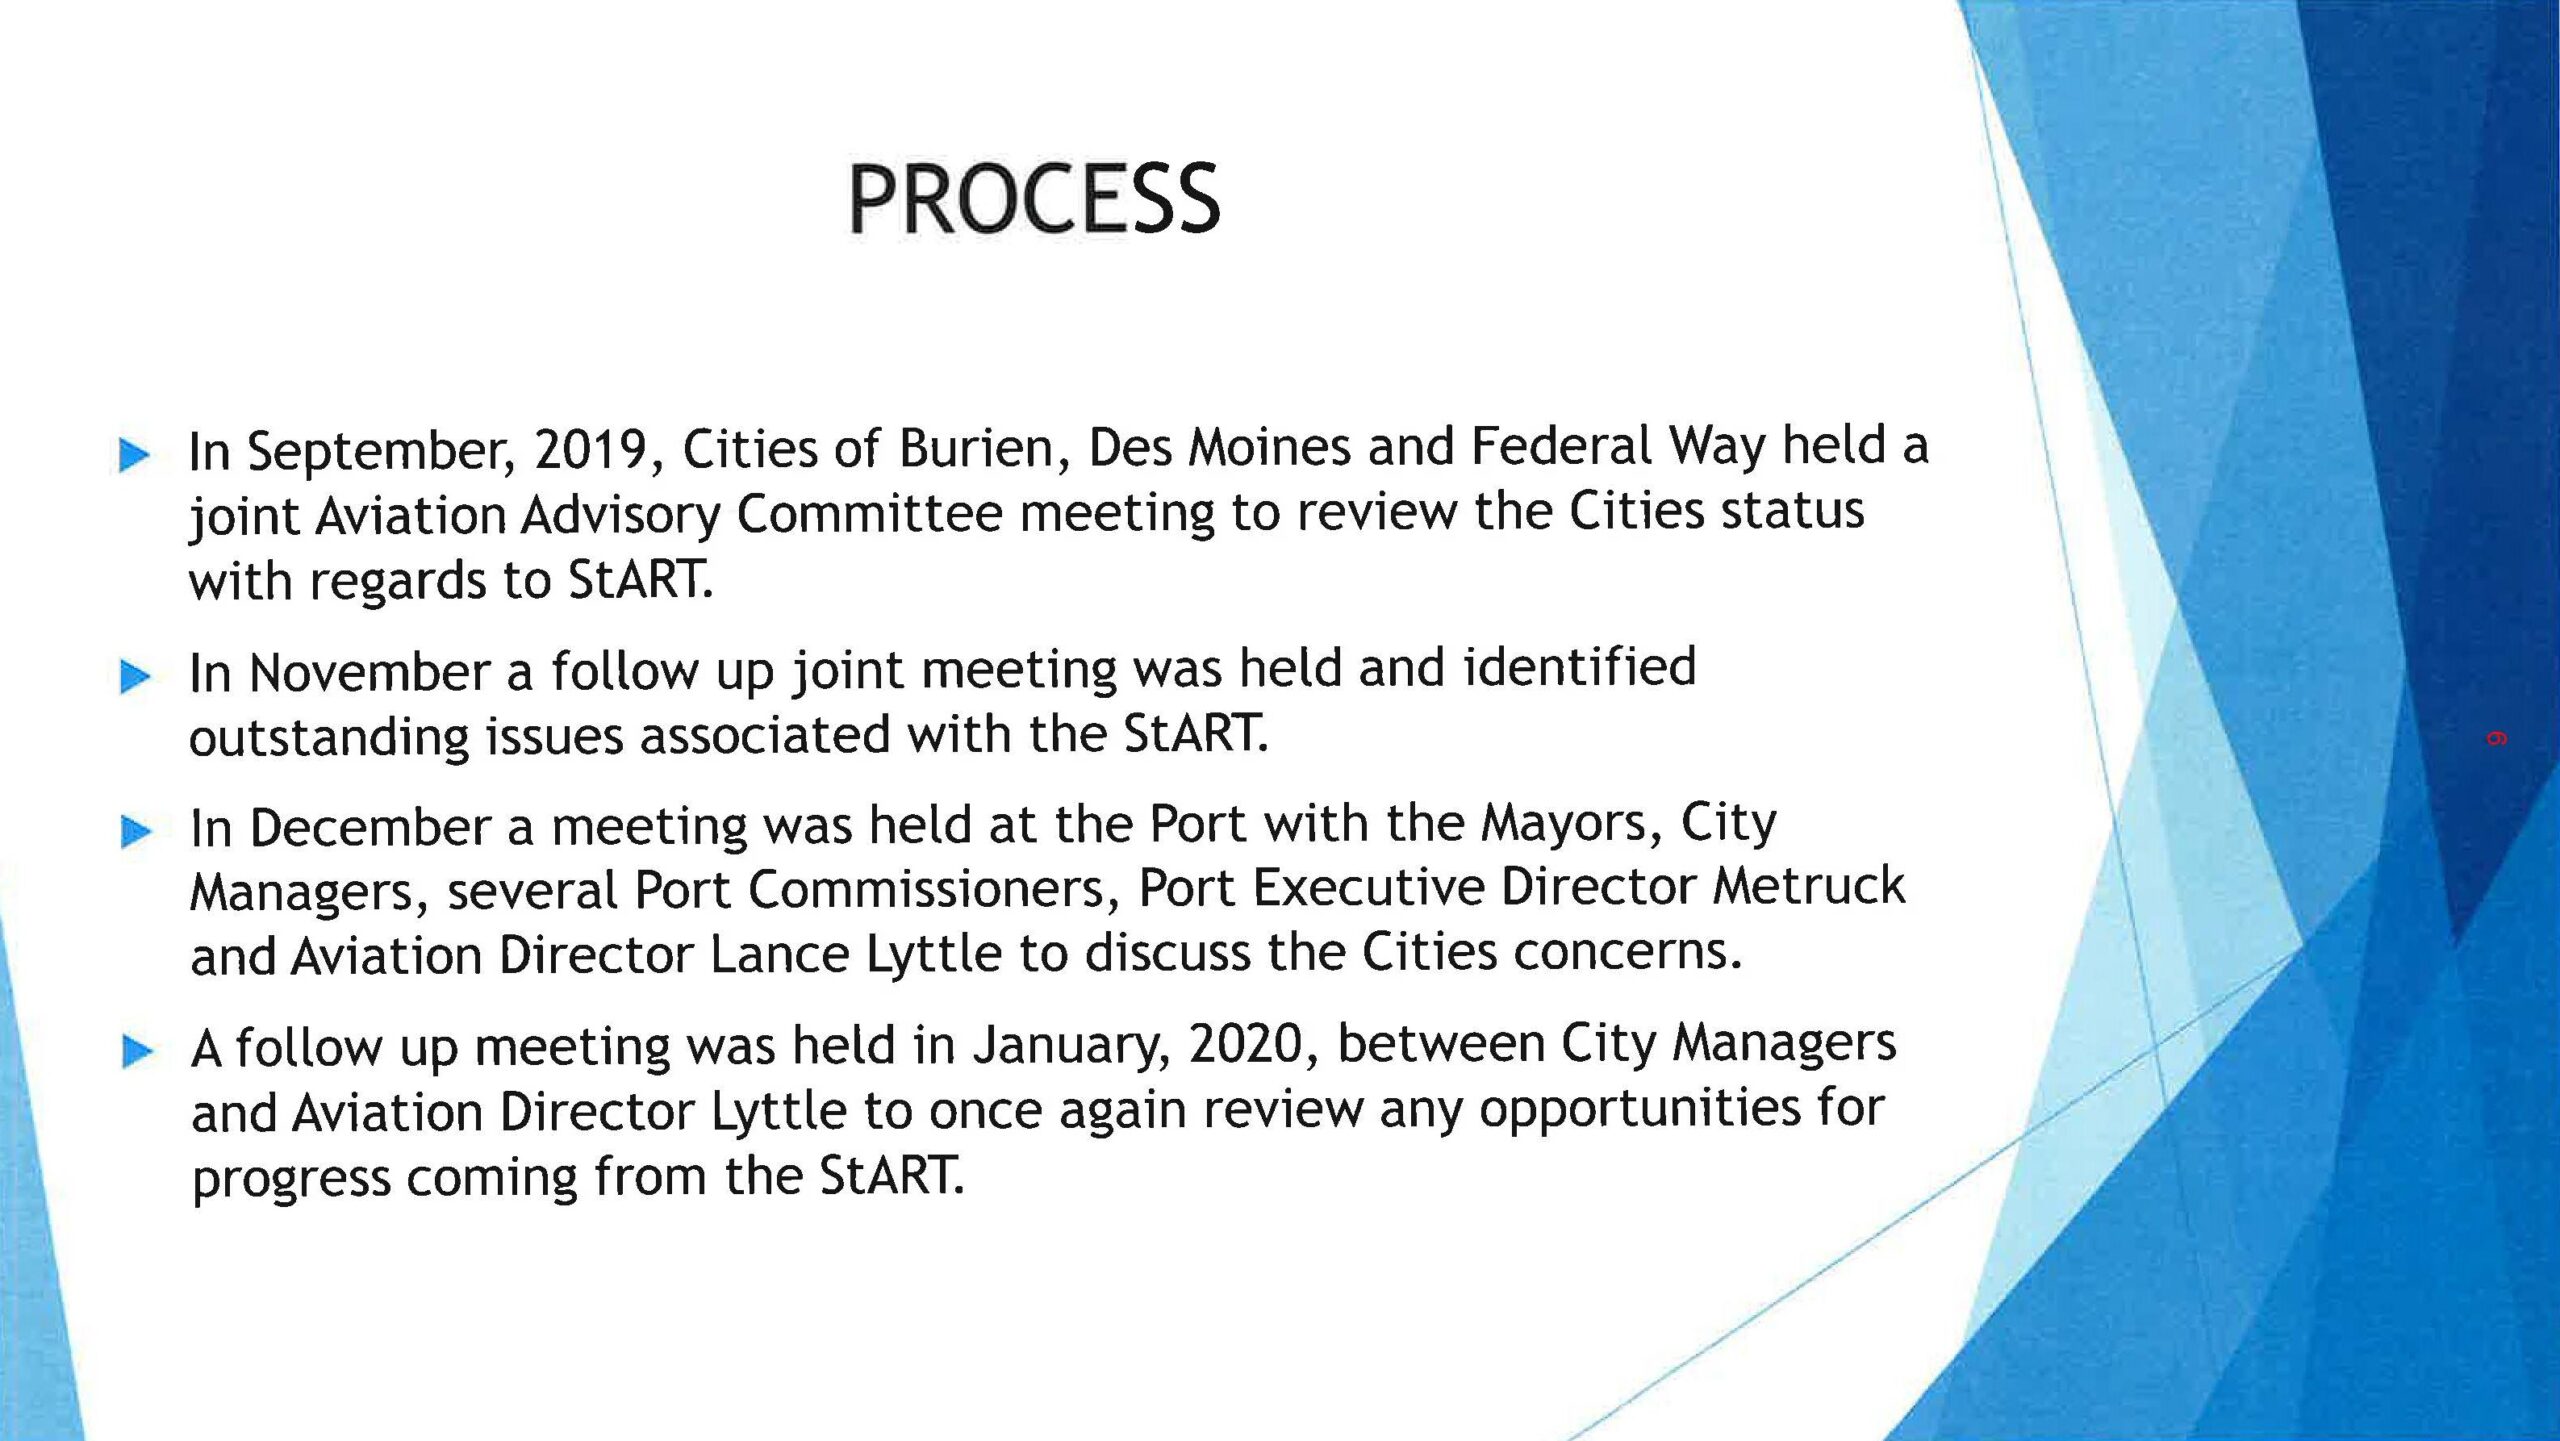
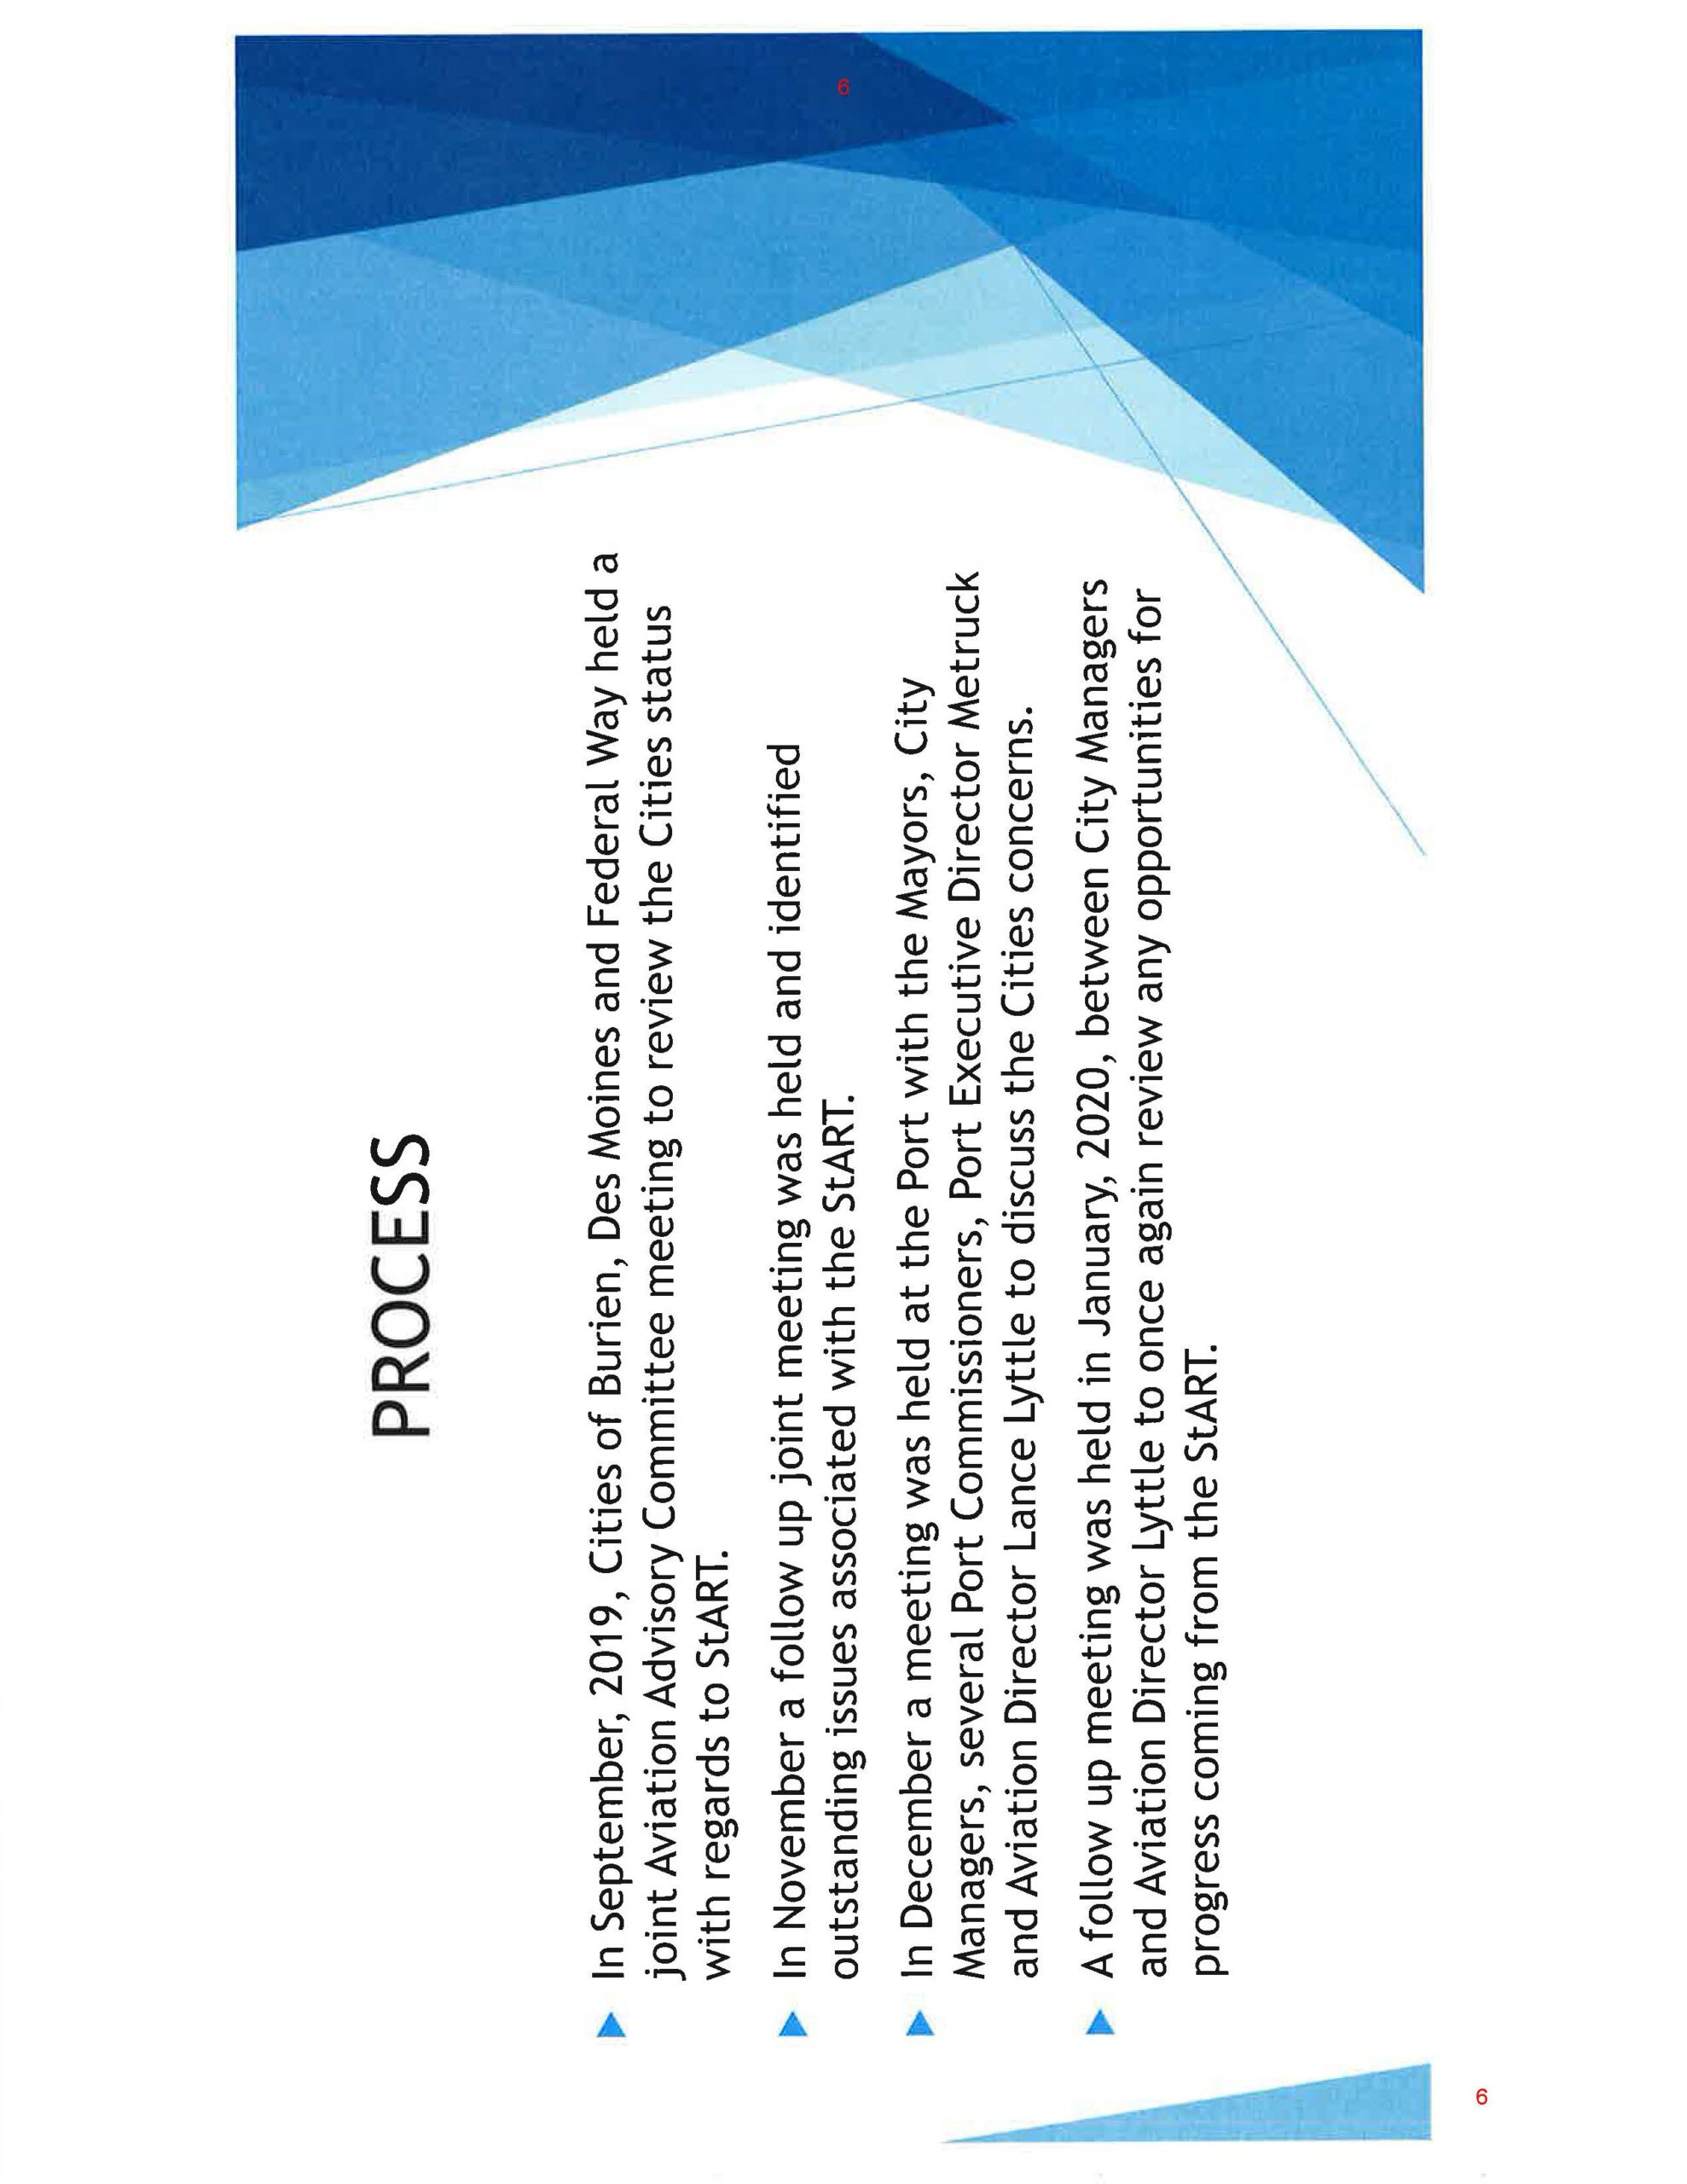
Des Moines, Burien, and Federal Way StART Process Update — July 2020
This presentation slide outlines the process undertaken by the Cities of Burien, Des Moines, and Federal Way regarding the StART (Sea-Tac Airport Roundtable) process, including joint Aviation Advisory Committee meetings in September and November 2019, a December 2019 meeting at the Port with Mayors, City Managers, Port Commissioners, Port Executive Director Metruck, and Aviation Director Lance Lyttle, and a January 2020 follow-up meeting between City Managers and Aviation Director Lyttle to review progress opportunities from StART. -
 2020-07-09
StART Process Overview: Cities of Burien, Des Moines, and Federal Way Meetings with Port Of Seattle, September 2019–January 2020
This presentation slide titled 'PROCESS' outlines four meetings held between September 2019 and January 2020 involving the Cities of Burien, Des Moines, and Federal Way, along with Port of Seattle officials including Aviation Director Lance Lyttle and Executive Director Metruck, to review and discuss outstanding issues associated with the Sea-Tac Airport Roundtable (StART). The slide is numbered page 6. -
 2020-07-09
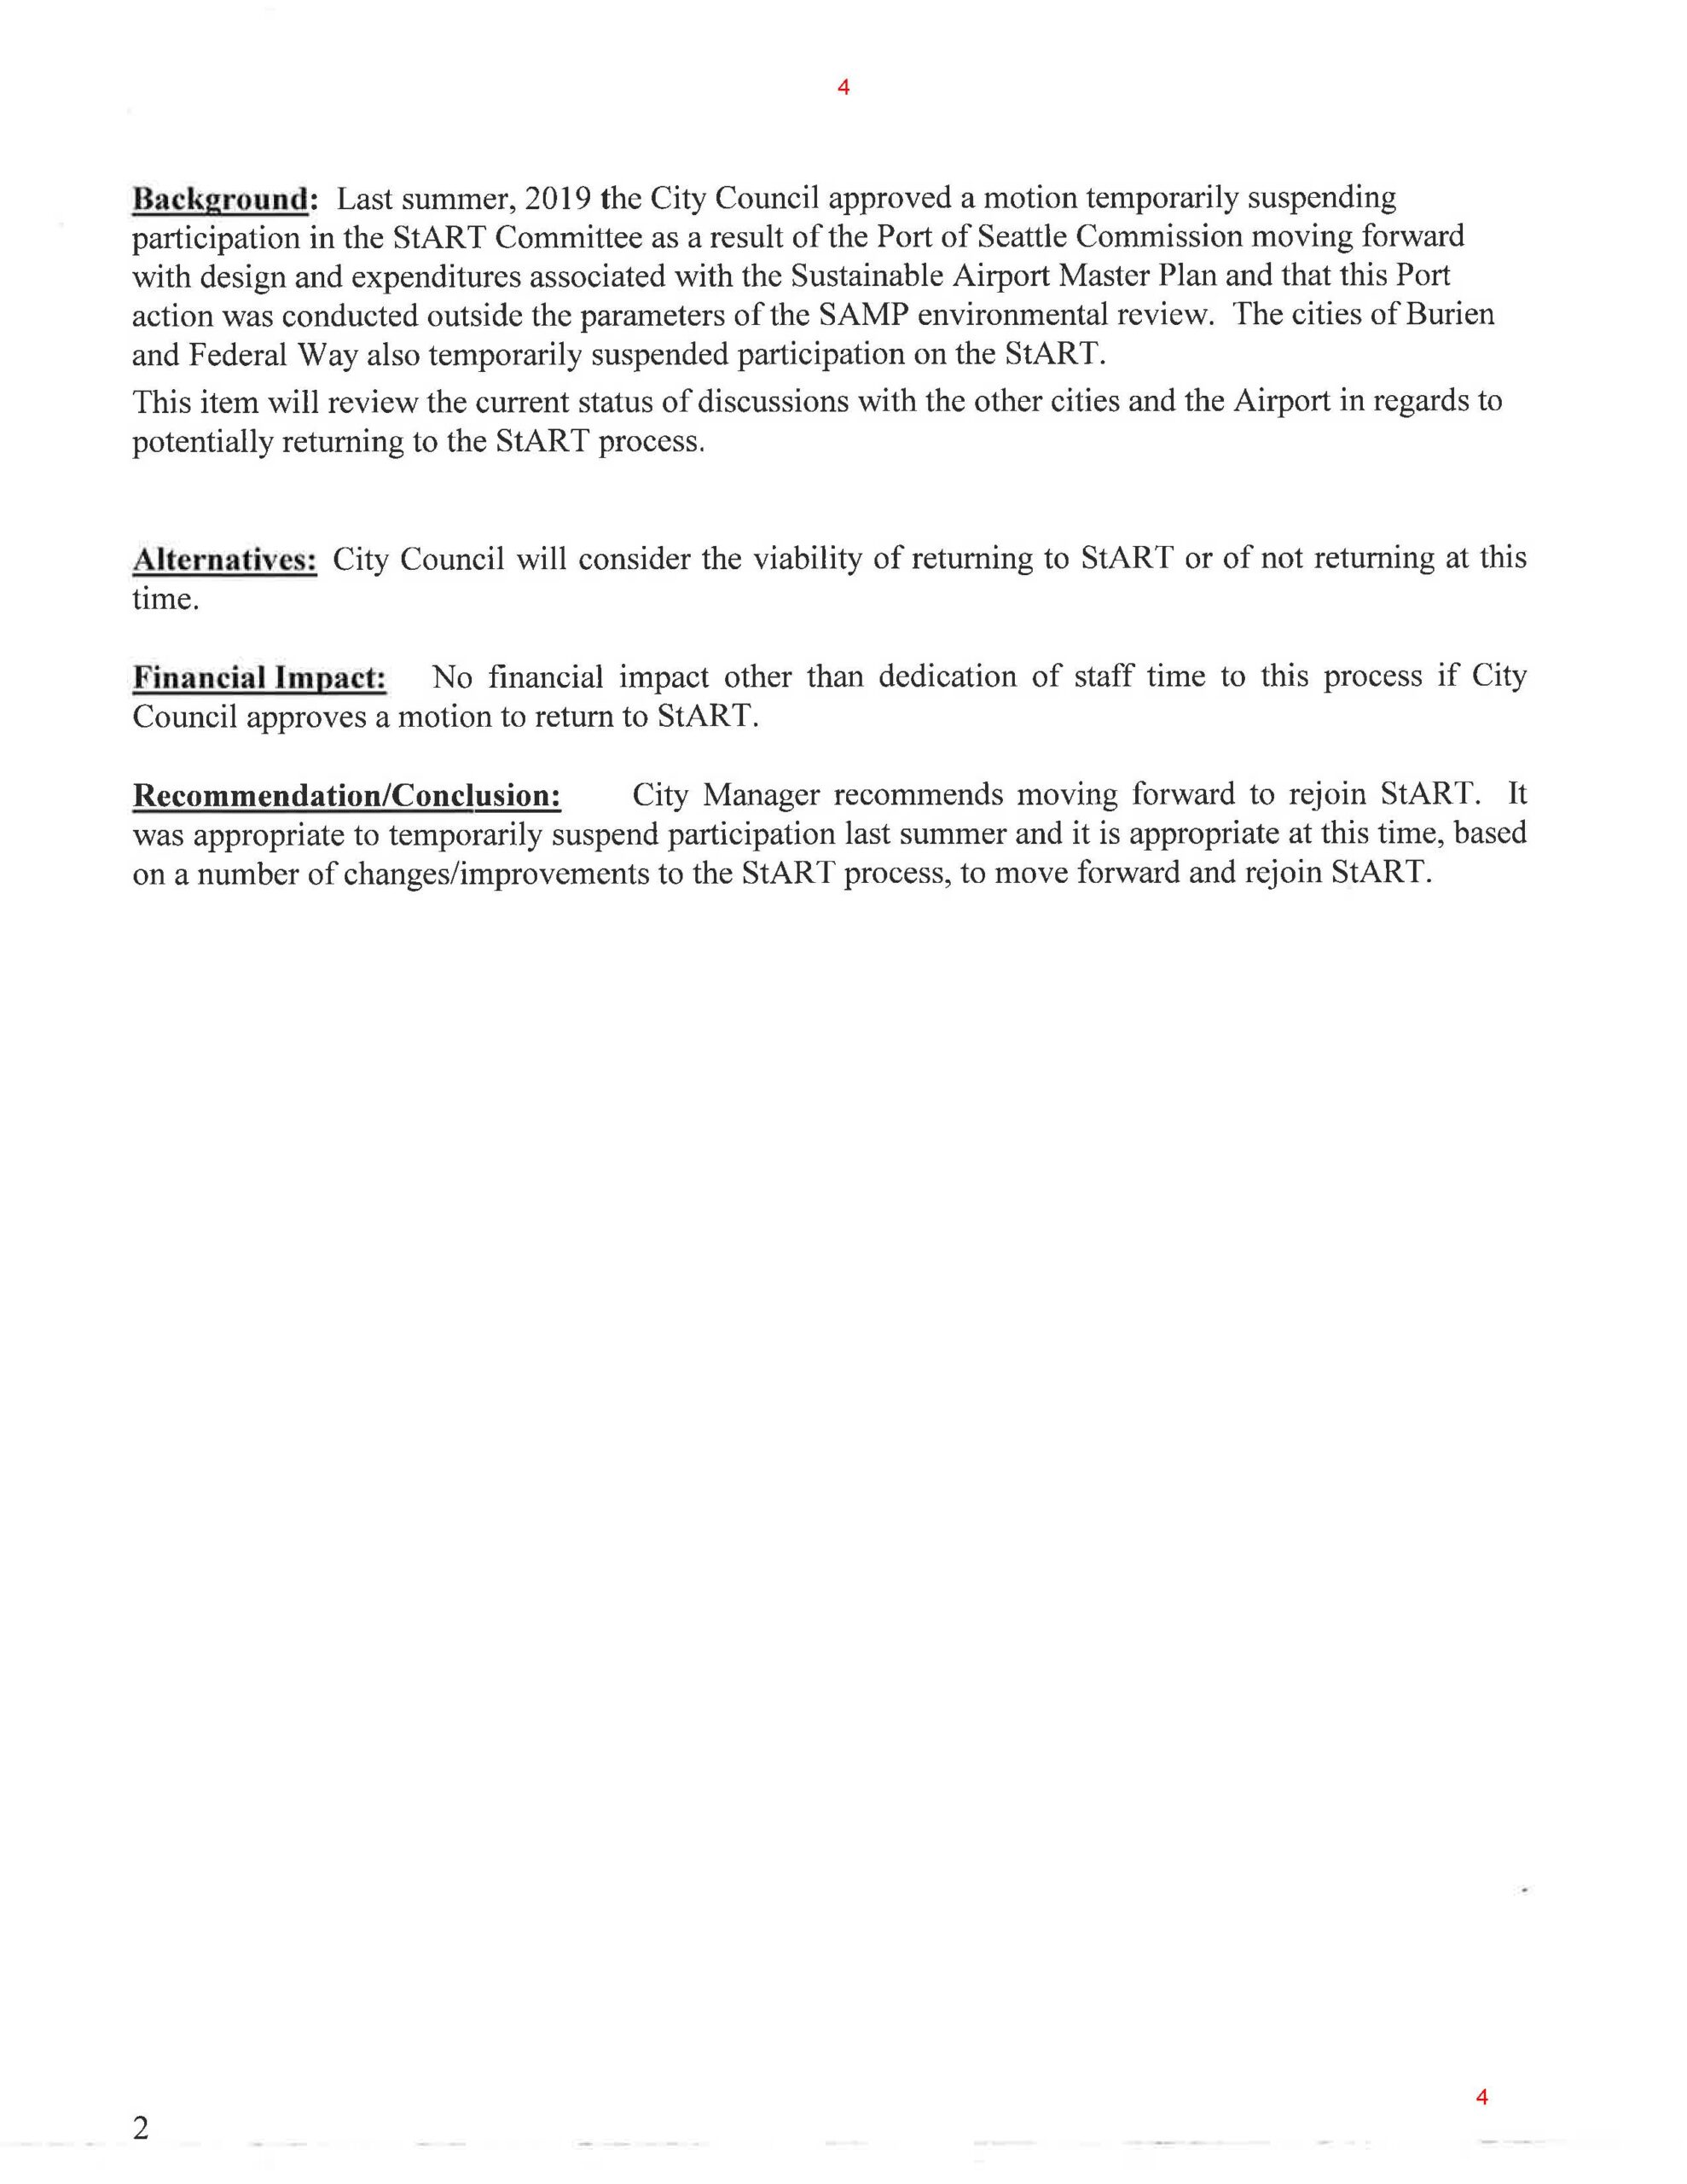
Des Moines City Council Staff Report: Rejoining StART Committee — July 2020
A city council staff report (page 4) describing the background, alternatives, financial impact, and recommendation regarding rejoining the StART (Sea-Tac Airport Roundtable) Committee. The City Manager recommends rejoining StART, noting that participation had been suspended in summer 2019 after the Port of Seattle Commission moved forward with the Sustainable Airport Master Plan (SAMP) outside the parameters of its environmental review, with Burien and Federal Way also having suspended participation. -
 2020-07-09
Des Moines City Council Briefing Slide on Rejoining StART Process — July 2020
A summary slide discussing a briefing serving as the foundation for a more extensive City Council discussion scheduled for March 12th, regarding the possibility of rejoining the StART (Sea-Tac Airport Roundtable) process. The slide also notes that other cities, including Burien and Federal Way, are holding similar briefings with their City Councils to determine appropriate action. -
 2020-07-09
Des Moines City Council Agenda Attachment: StART Withdrawal and SAMP Policy Update — July 2020
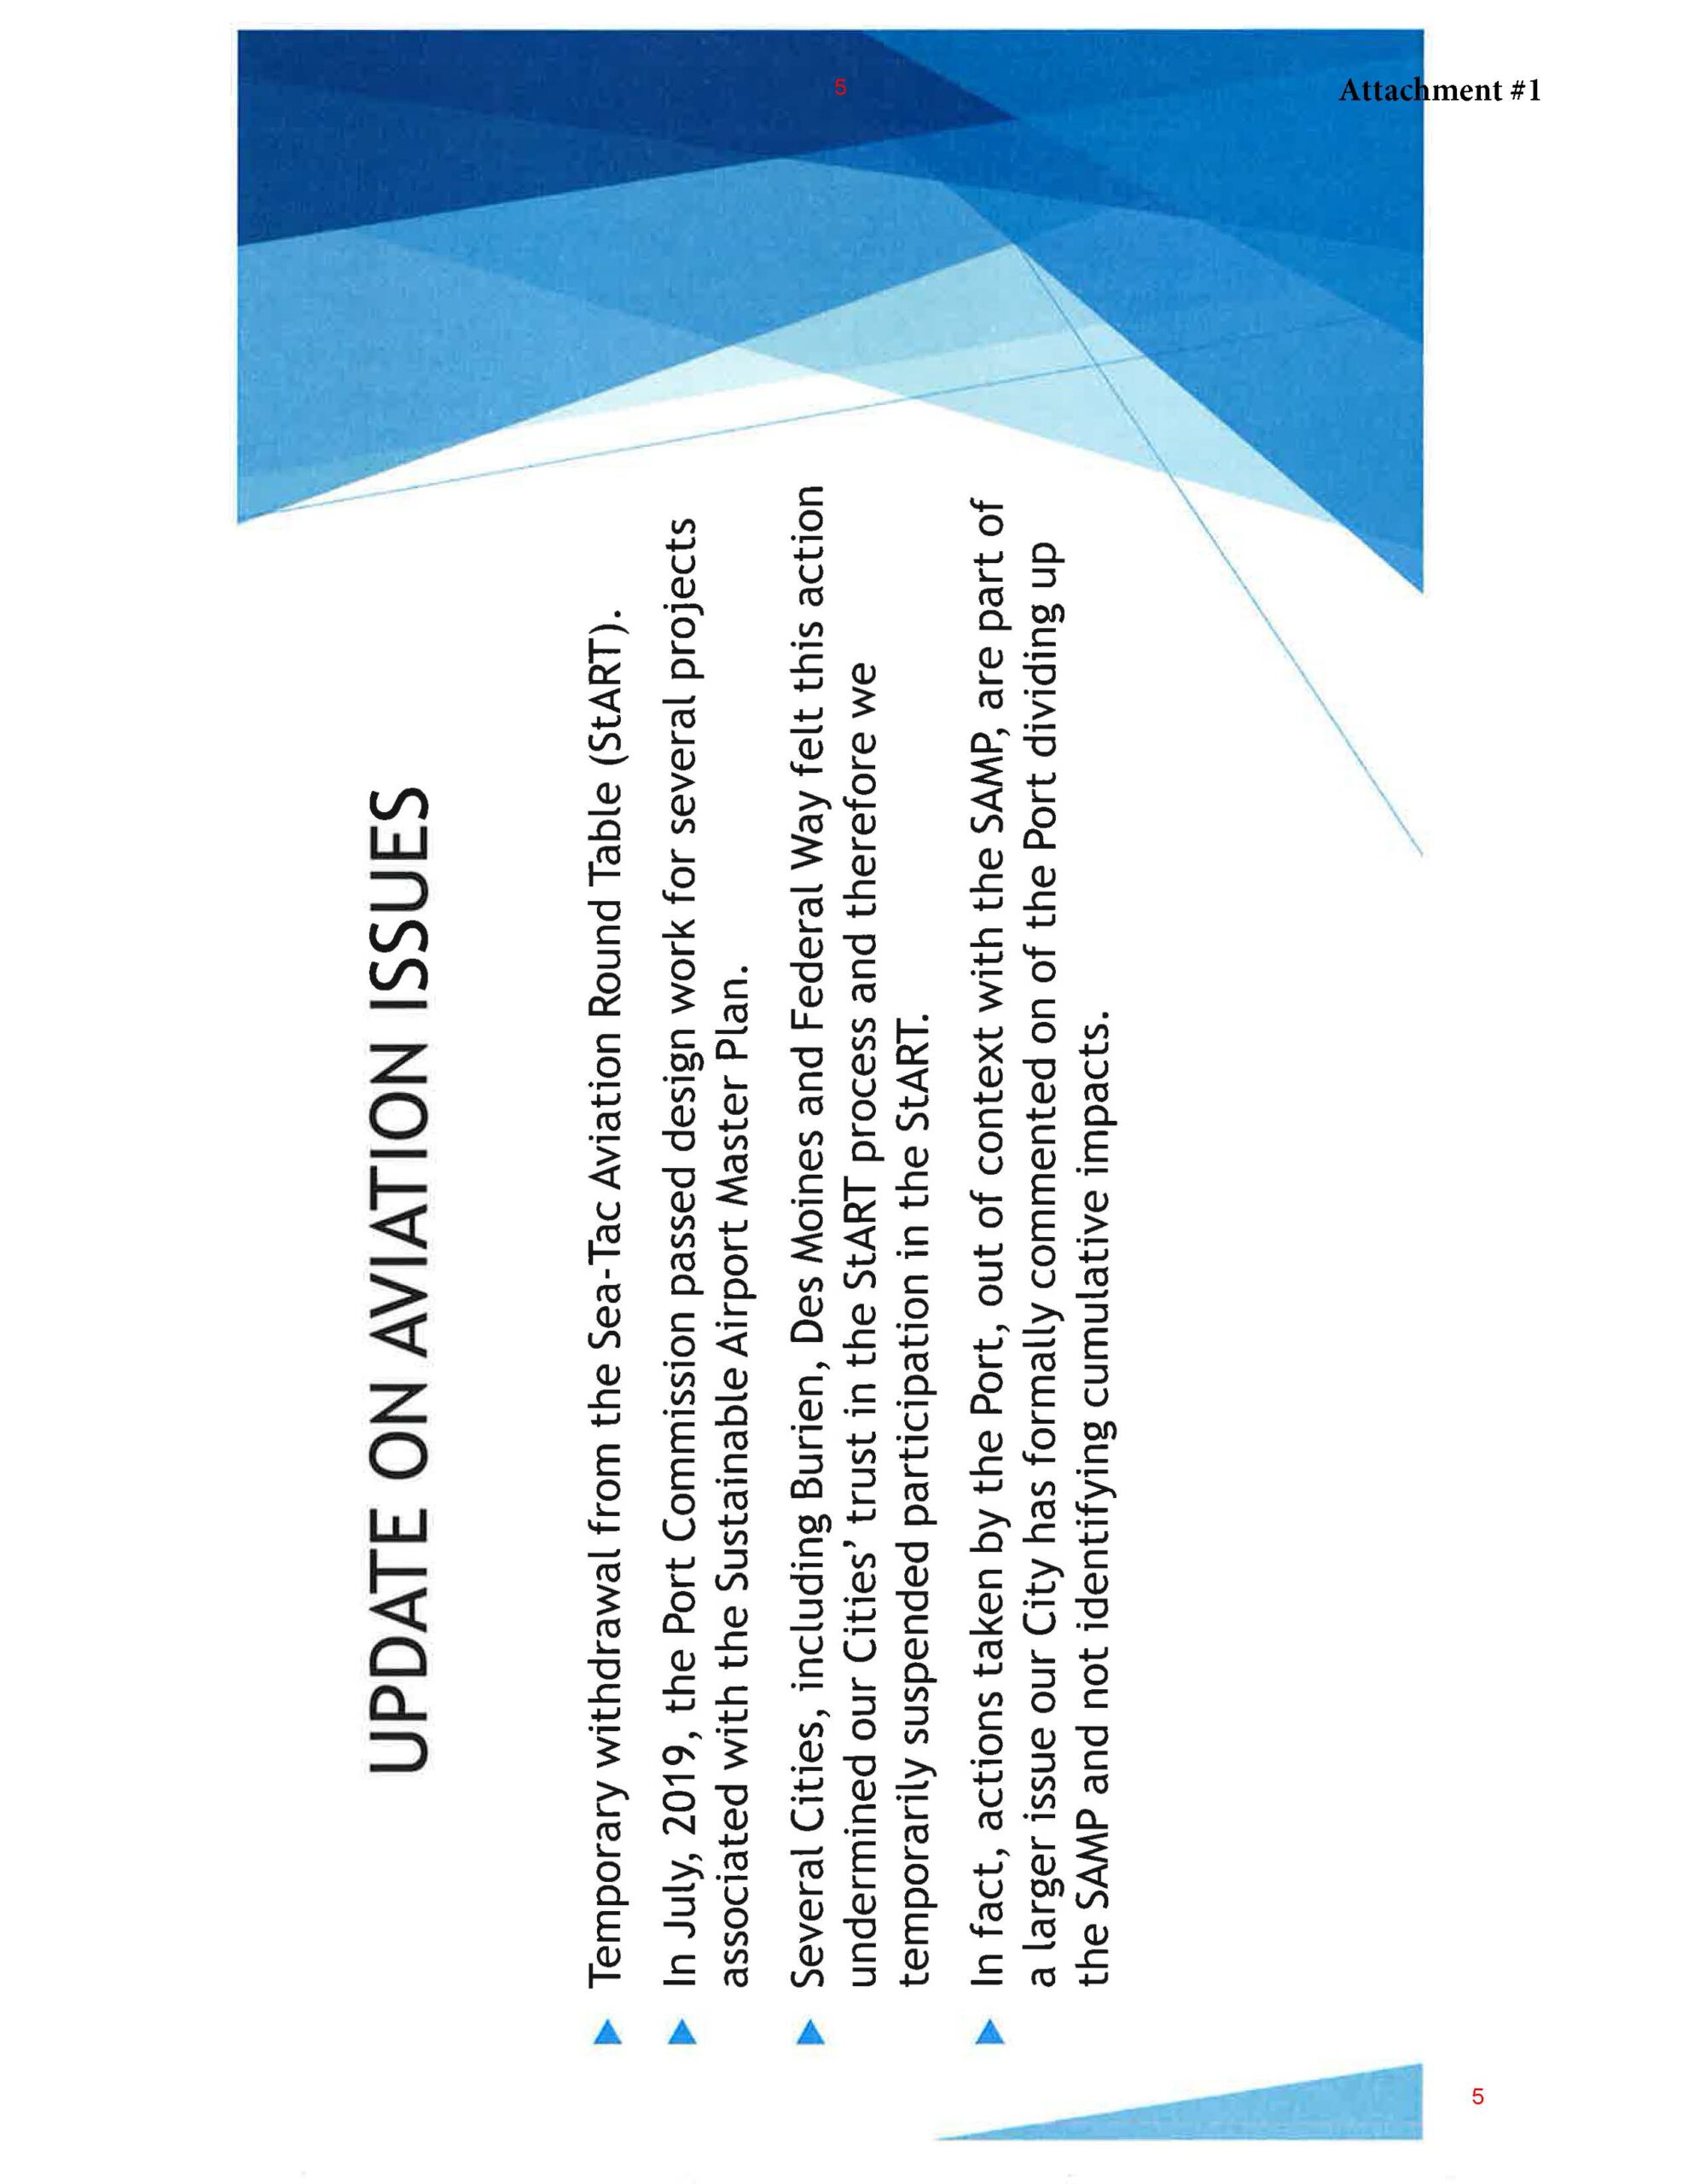
This presentation slide, labeled Attachment #1 (page 5), outlines aviation policy issues related to Sea-Tac Airport, including a temporary withdrawal from the Sea-Tac Aviation Round Table (StART), the Port Commission's July 2019 design work on the Sustainable Airport Master Plan (SAMP), and the suspension of StART participation by several cities including Burien, Des Moines, and Federal Way due to loss of trust in the process. The City also formally commented on the SAMP regarding cumulative impacts.