TagNoise Countour(20)
-
DNL65 For Dummies
There is a geographic area around every large airport where, according to a formula developed by the Federal Aviation Administration (FAA), the ‘noise’ level is equal to or greater than 65 decibels DNL (Day Night Level). That area is depicted on a noise exposure map (NEM) and referred to as the Noise Boundary or just -
 2018-01-01
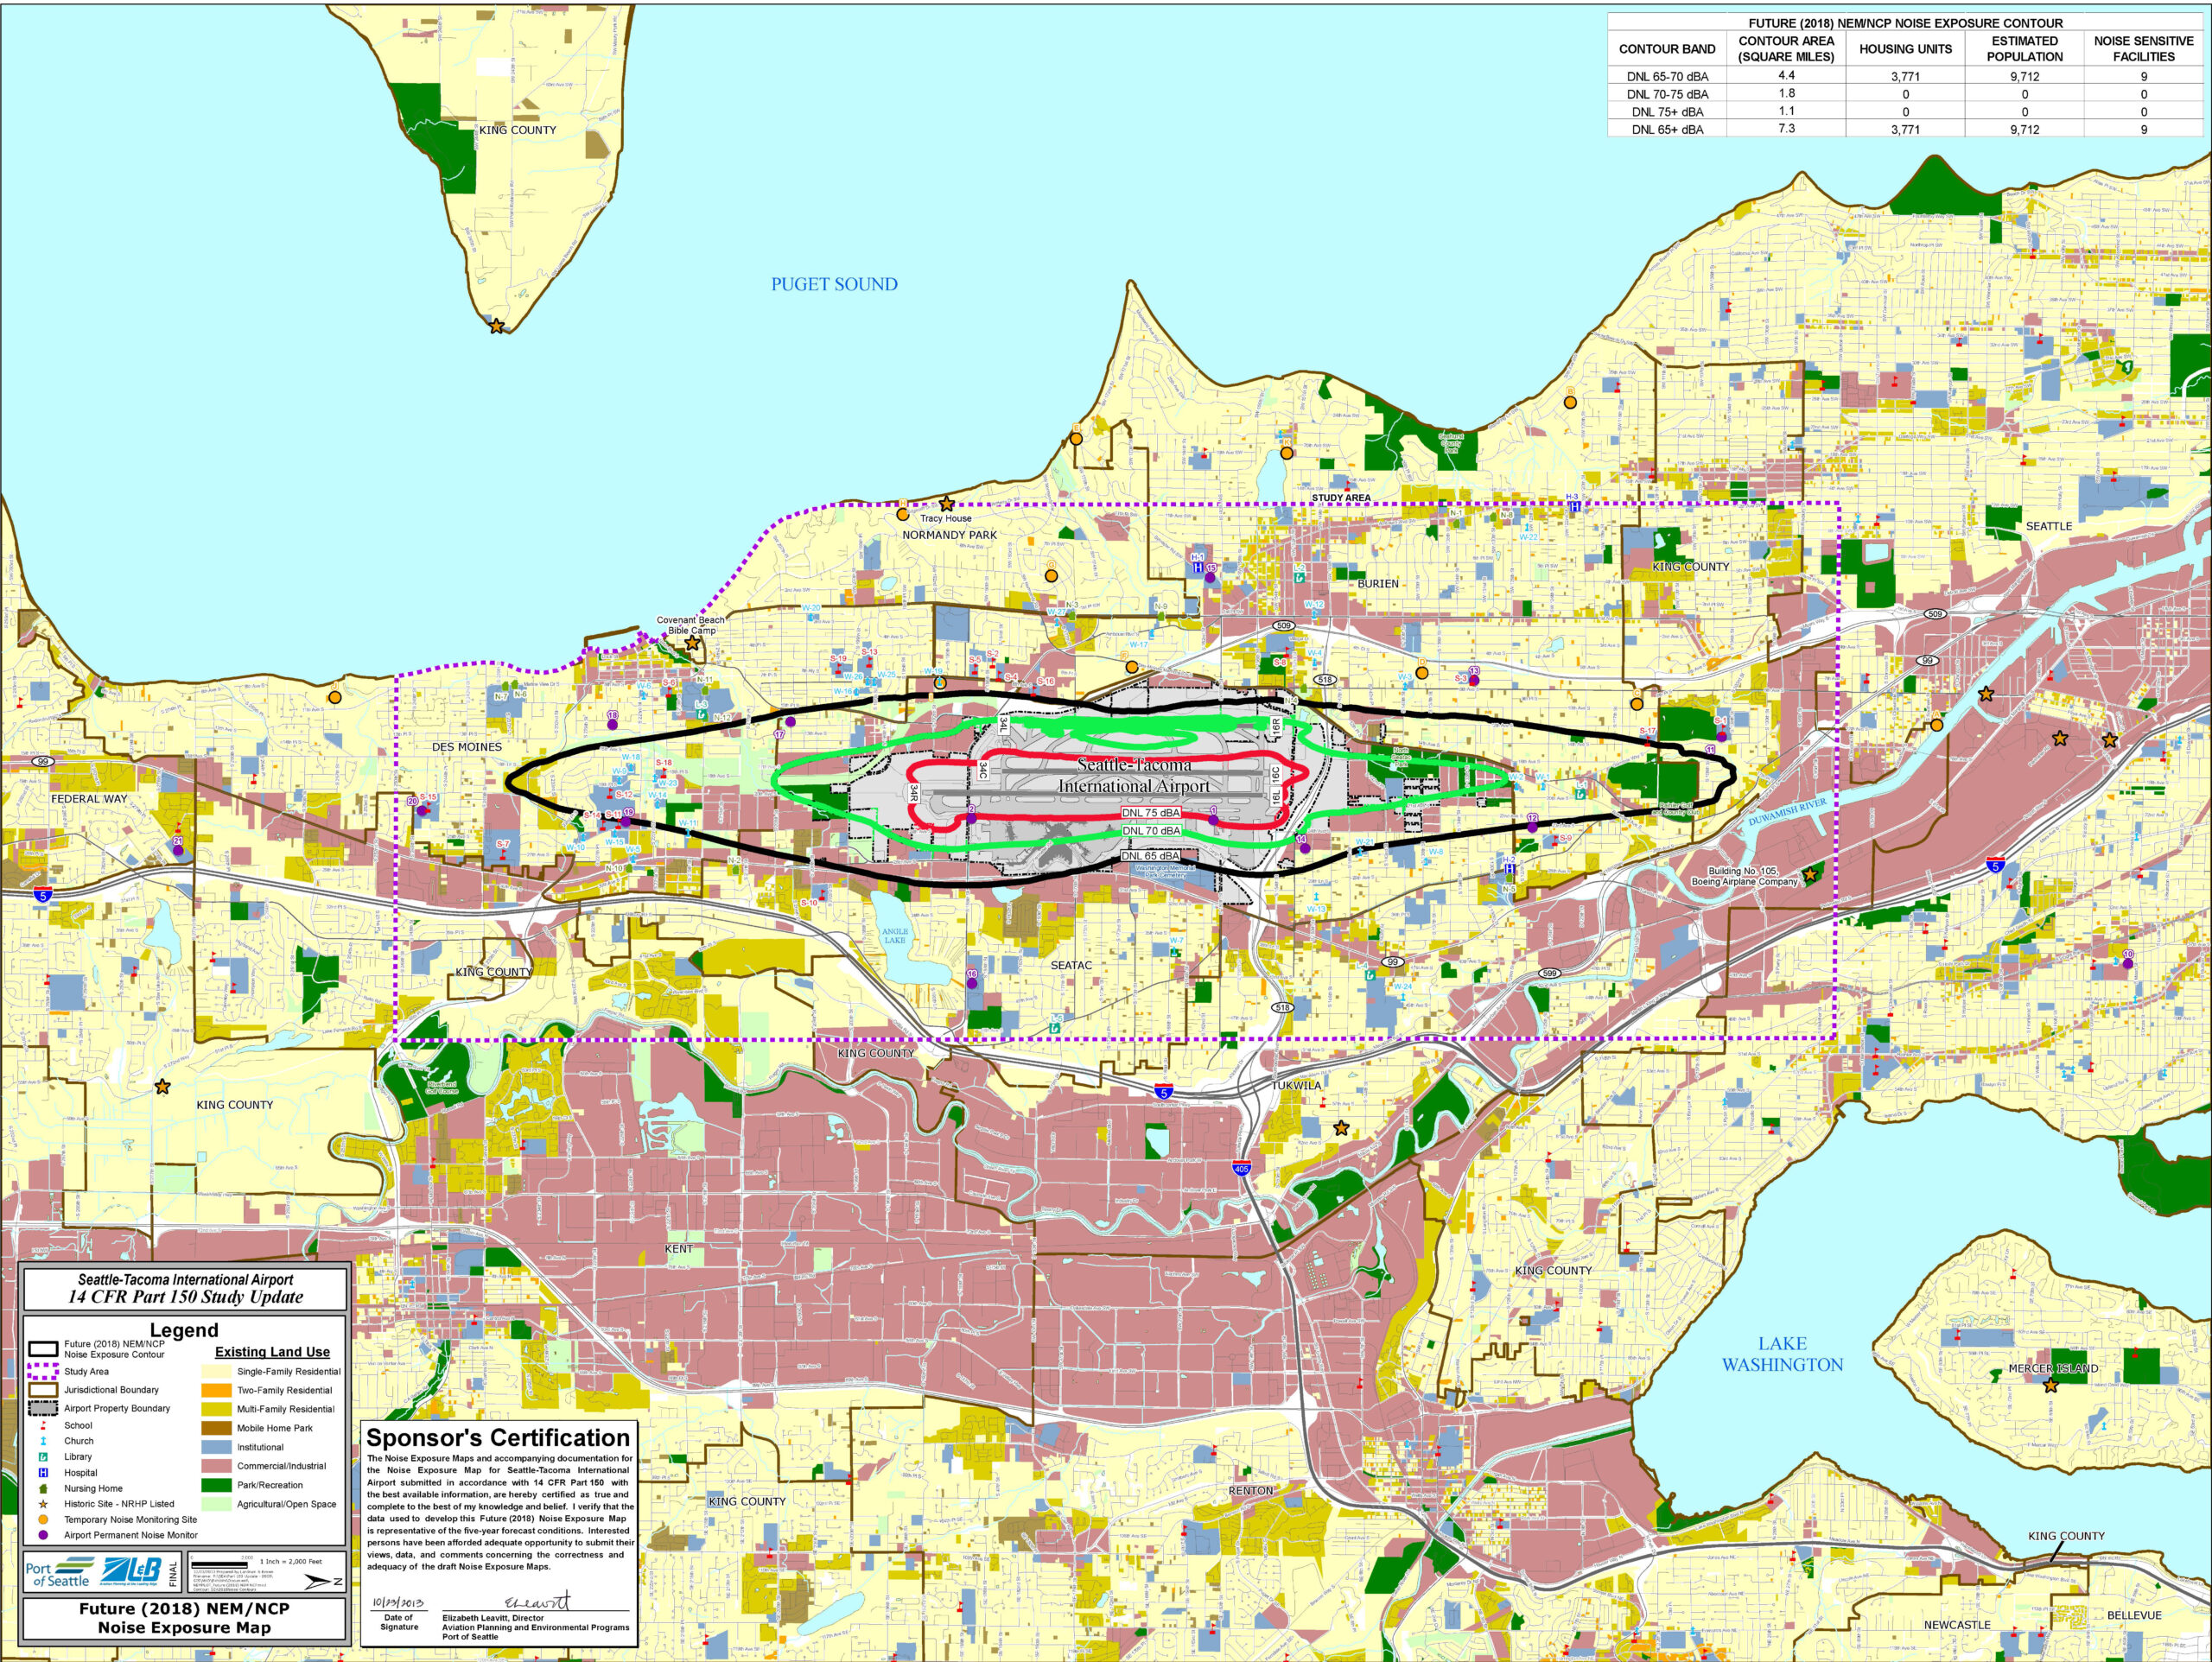
Part 150 2013 Noise Exposure Map NEM PLOT Future 2018
This is the Future (2018) Noise Exposure Map (NEM/NCP) for Seattle-Tacoma International Airport, produced as part of a 14 CFR Part 150 Study Update by the Port of Seattle. The map displays DNL noise contour bands (65–70, 70–75, and 75+ dBA) overlaid on surrounding land uses, with a data table showing the DNL 65–70 dBA contour covering 4.4 square miles and affecting an estimated 9,712 people; it includes a Sponsor's Certification signed by Elizabeth Leavitt, Director of Aviation Planning and Environmental Programs for the Port of Seattle. -
 2015-03-27
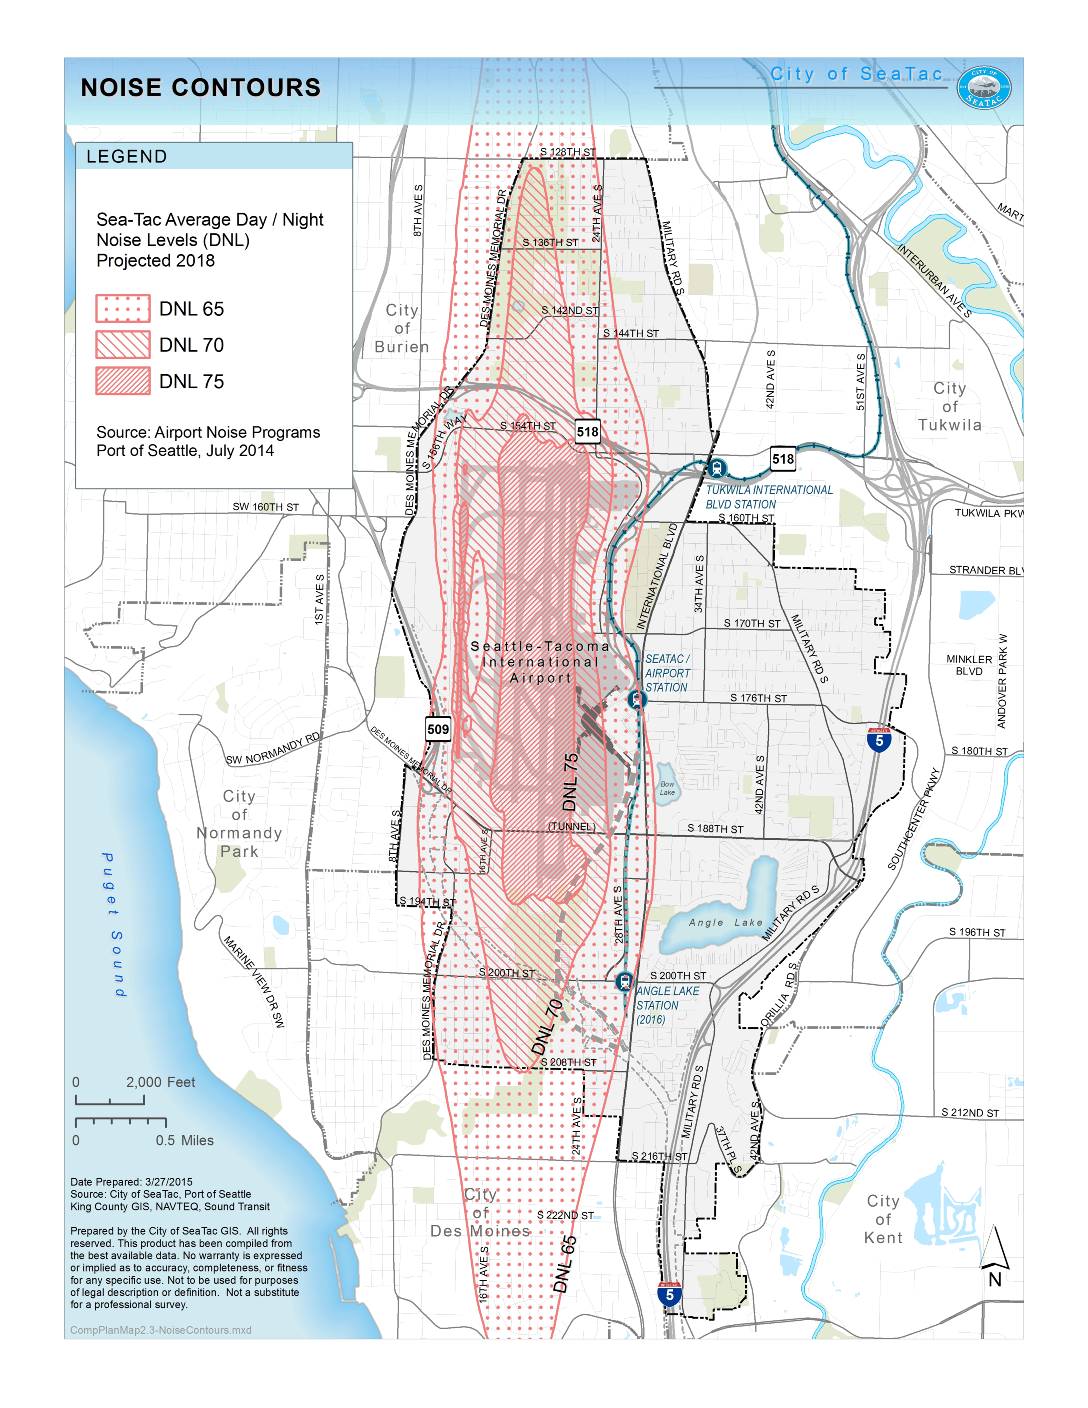
City of Sea-Tac Noise Contours Map: Sea-Tac Airport Projected 2018 DNL Levels
This map from the City of SeaTac shows projected 2018 average day/night noise levels (DNL) radiating from Seattle-Tacoma International Airport, with contour zones indicating areas expected to experience noise levels of 65, 70, and 75 decibels. The noise contours extend north into Burien, south into Des Moines, and affect portions of Tukwila and Normandy Park, with the most intense noise zone (DNL 75) centered directly over the airport. Prepared in March 2015 using Port of Seattle Airport Noise Programs data from July 2014, the map serves as a planning reference for land use and noise mitigation policy in surrounding communities. -
 2013-10-01
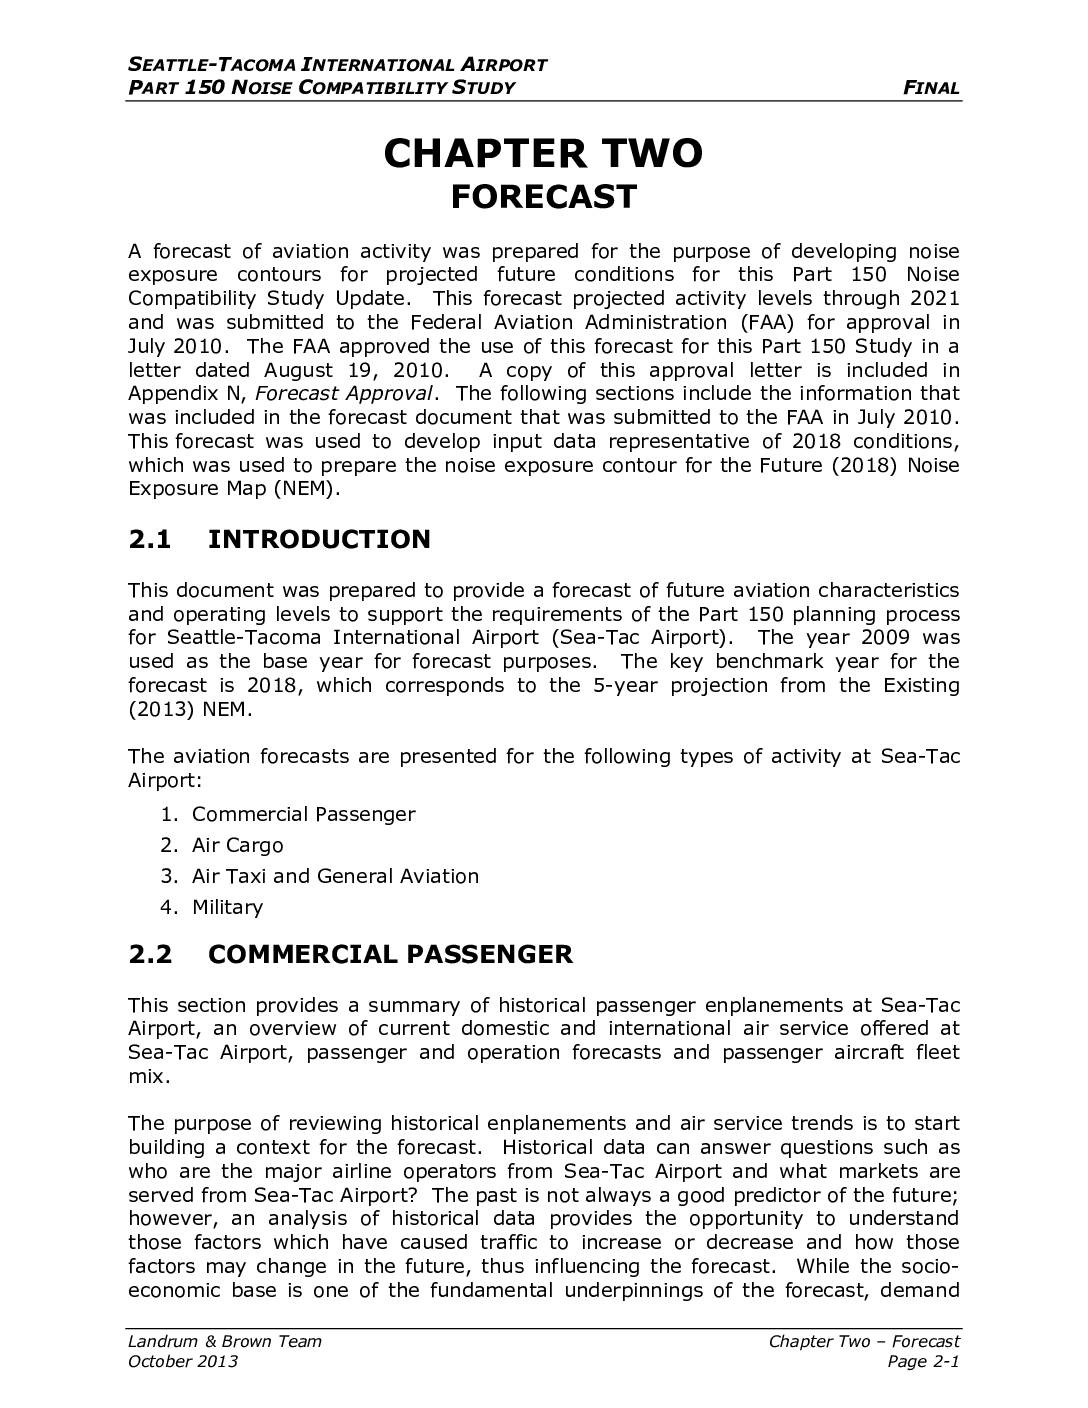
Seattle-Tacoma International Airport Part 150 noise compatibility study final: Chapter two – forecast
This chapter from the Seattle-Tacoma International Airport Part 150 Noise Compatibility Study presents aviation activity forecasts developed to support noise exposure planning through 2018 and beyond. It covers historical passenger enplanement trends showing growth from 8.2 million in 1990 to 15.6 million in 2009, as well as domestic and international air service patterns dominated by Alaska Airlines. The forecasts, approved by the FAA in August 2010, were used to project aircraft fleet mix and noise exposure contours for future planning purposes. -
 2013-10-01
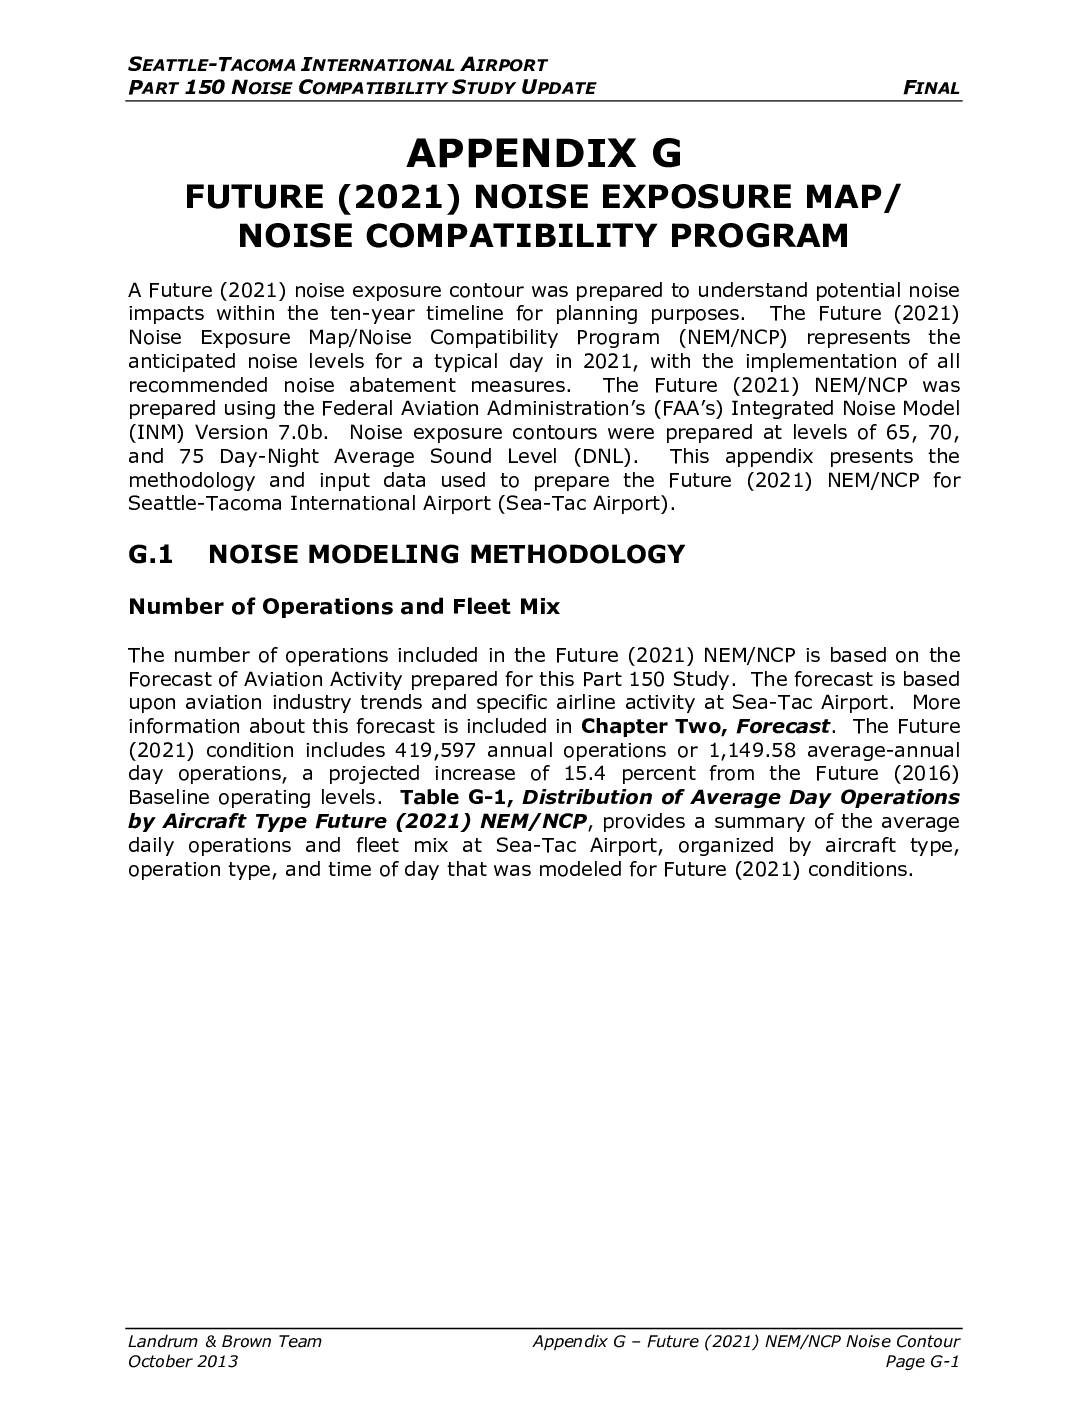
Future (2021) noise exposure map/noise compatibility program – Seattle-Tacoma International Airport Part 150 noise compatibility study update
This document outlines the Future (2021) Noise Exposure Map and Noise Compatibility Program for Seattle-Tacoma International Airport, projecting noise levels for a typical day in 2021 assuming all recommended noise abatement measures are in place. Using the FAA's Integrated Noise Model, it forecasts 419,597 annual aircraft operations — a 15.4% increase over 2016 baseline levels — and maps noise contours at 65, 70, and 75 decibel DNL thresholds. The report details the fleet mix and runway usage data used in the modeling, with Boeing 737-800s representing the largest share of daily operations. -
 2013-05-30
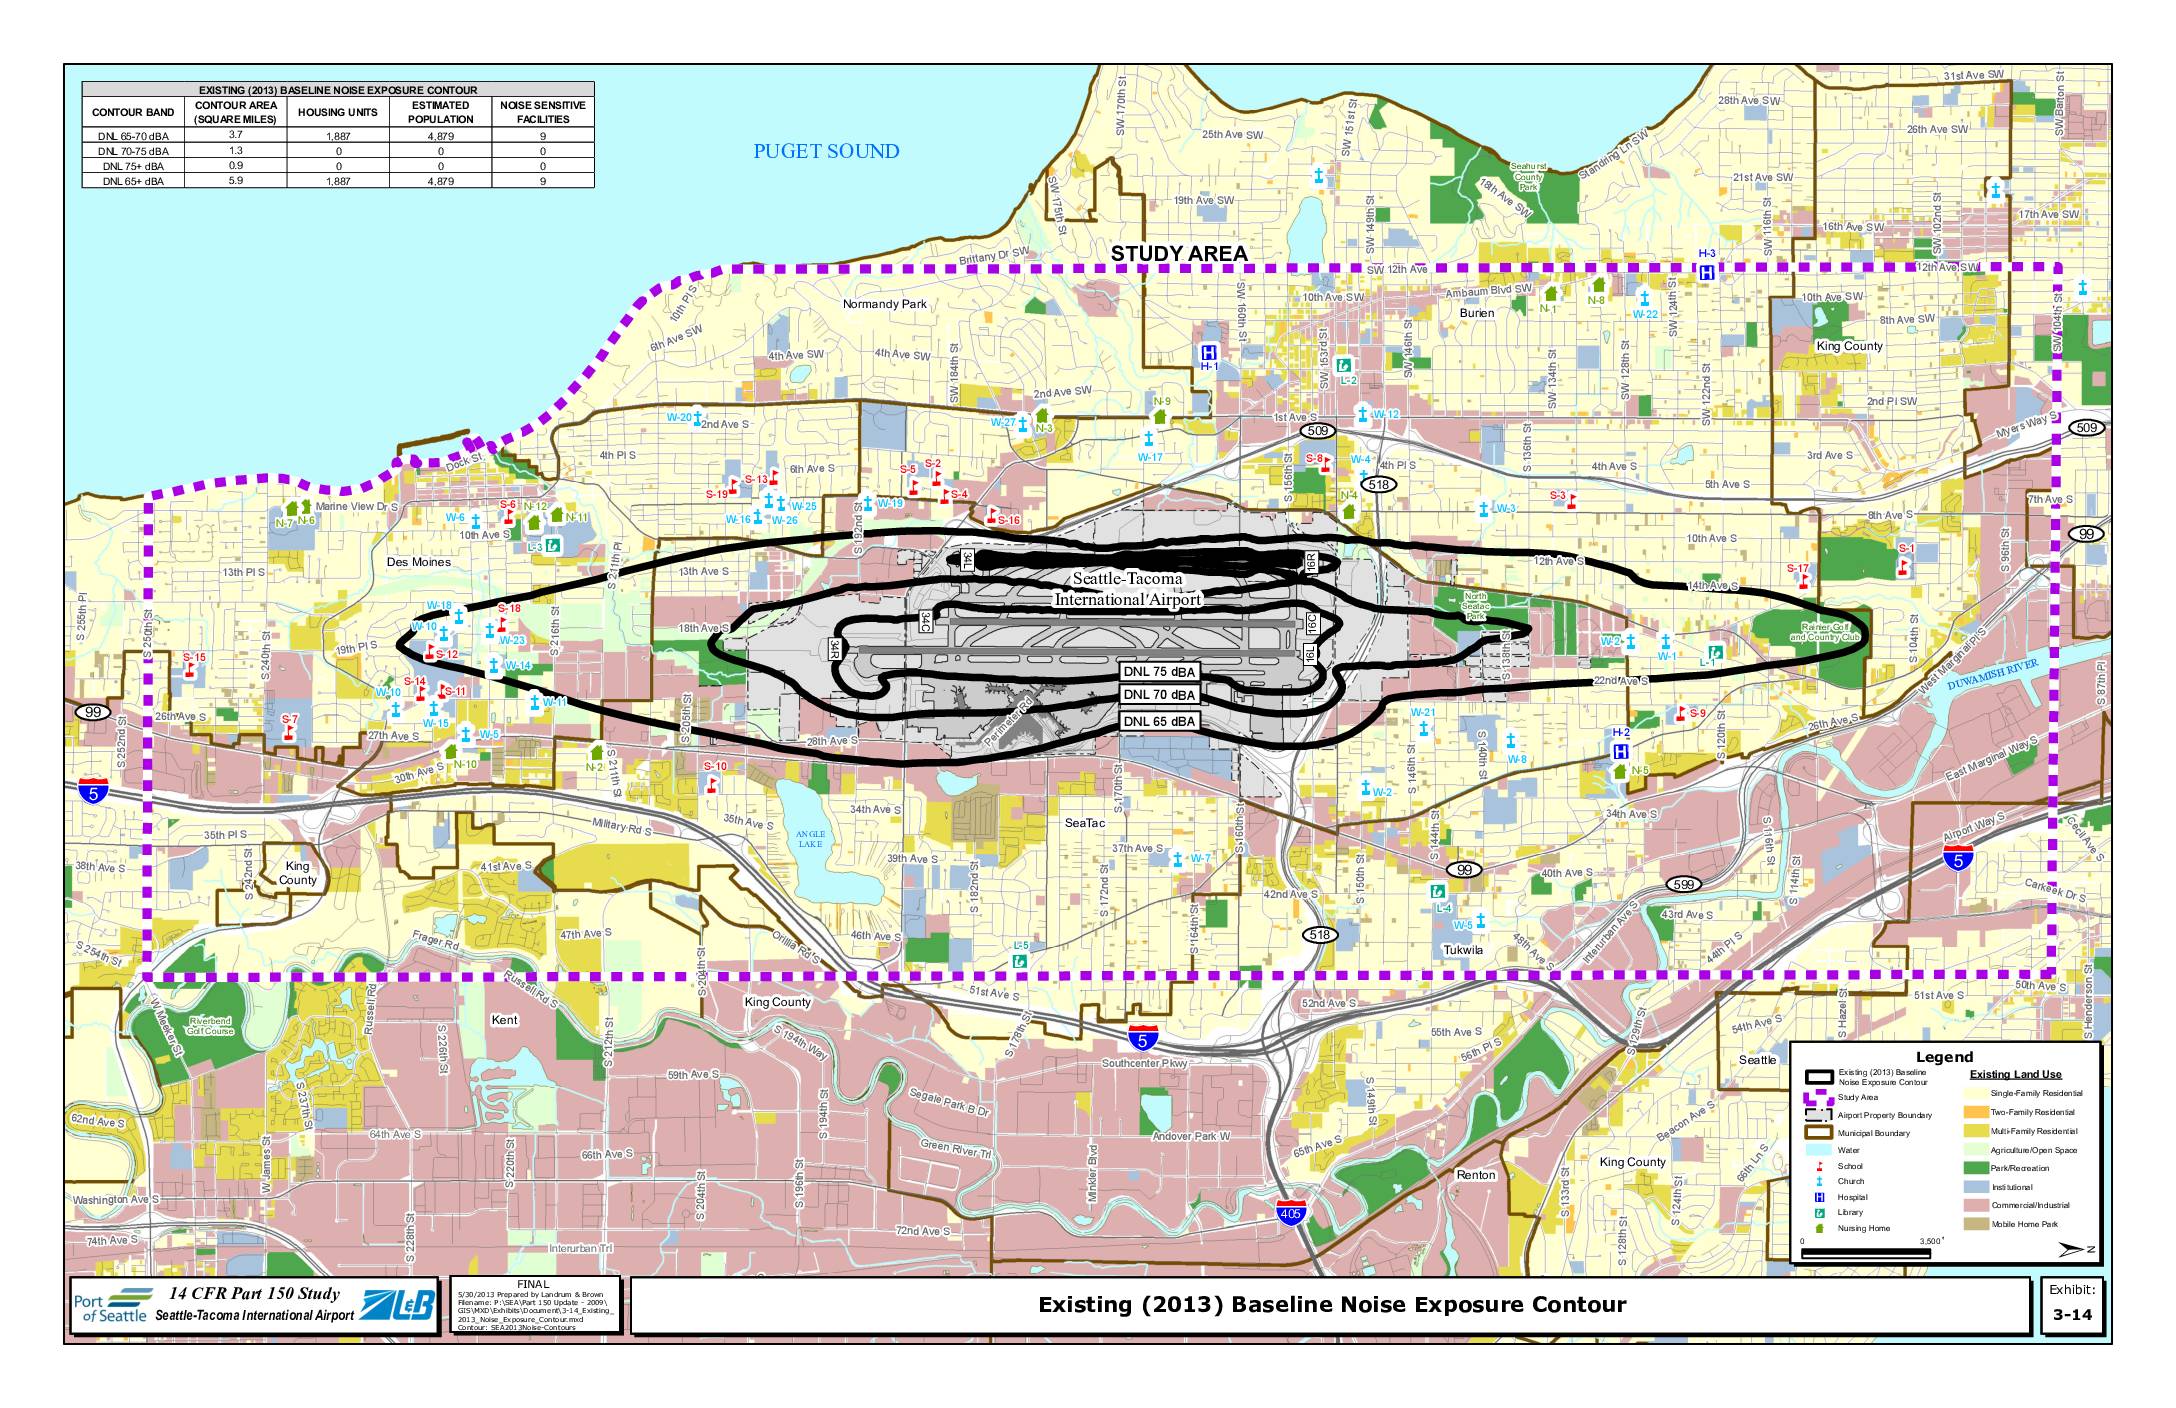
Existing (2013) baseline noise exposure contour
This exhibit from the Seattle-Tacoma International Airport 14 CFR Part 150 Study maps the existing 2013 baseline noise exposure contours around Sea-Tac Airport, showing DNL 65, 70, and 75 dBA noise zones across surrounding communities including SeaTac, Burien, Des Moines, and Tukwila. The DNL 65 dBA or greater contour covers approximately 5.9 square miles, encompassing an estimated 1,887 housing units and roughly 4,879 residents, along with 9 noise-sensitive facilities such as schools, churches, and hospitals. Notably, no housing units fall within the higher-impact DNL 70 dBA or above zones, though significant residential and commercial land uses exist within the broader 65 dBA contour area. -
 2013-01-22
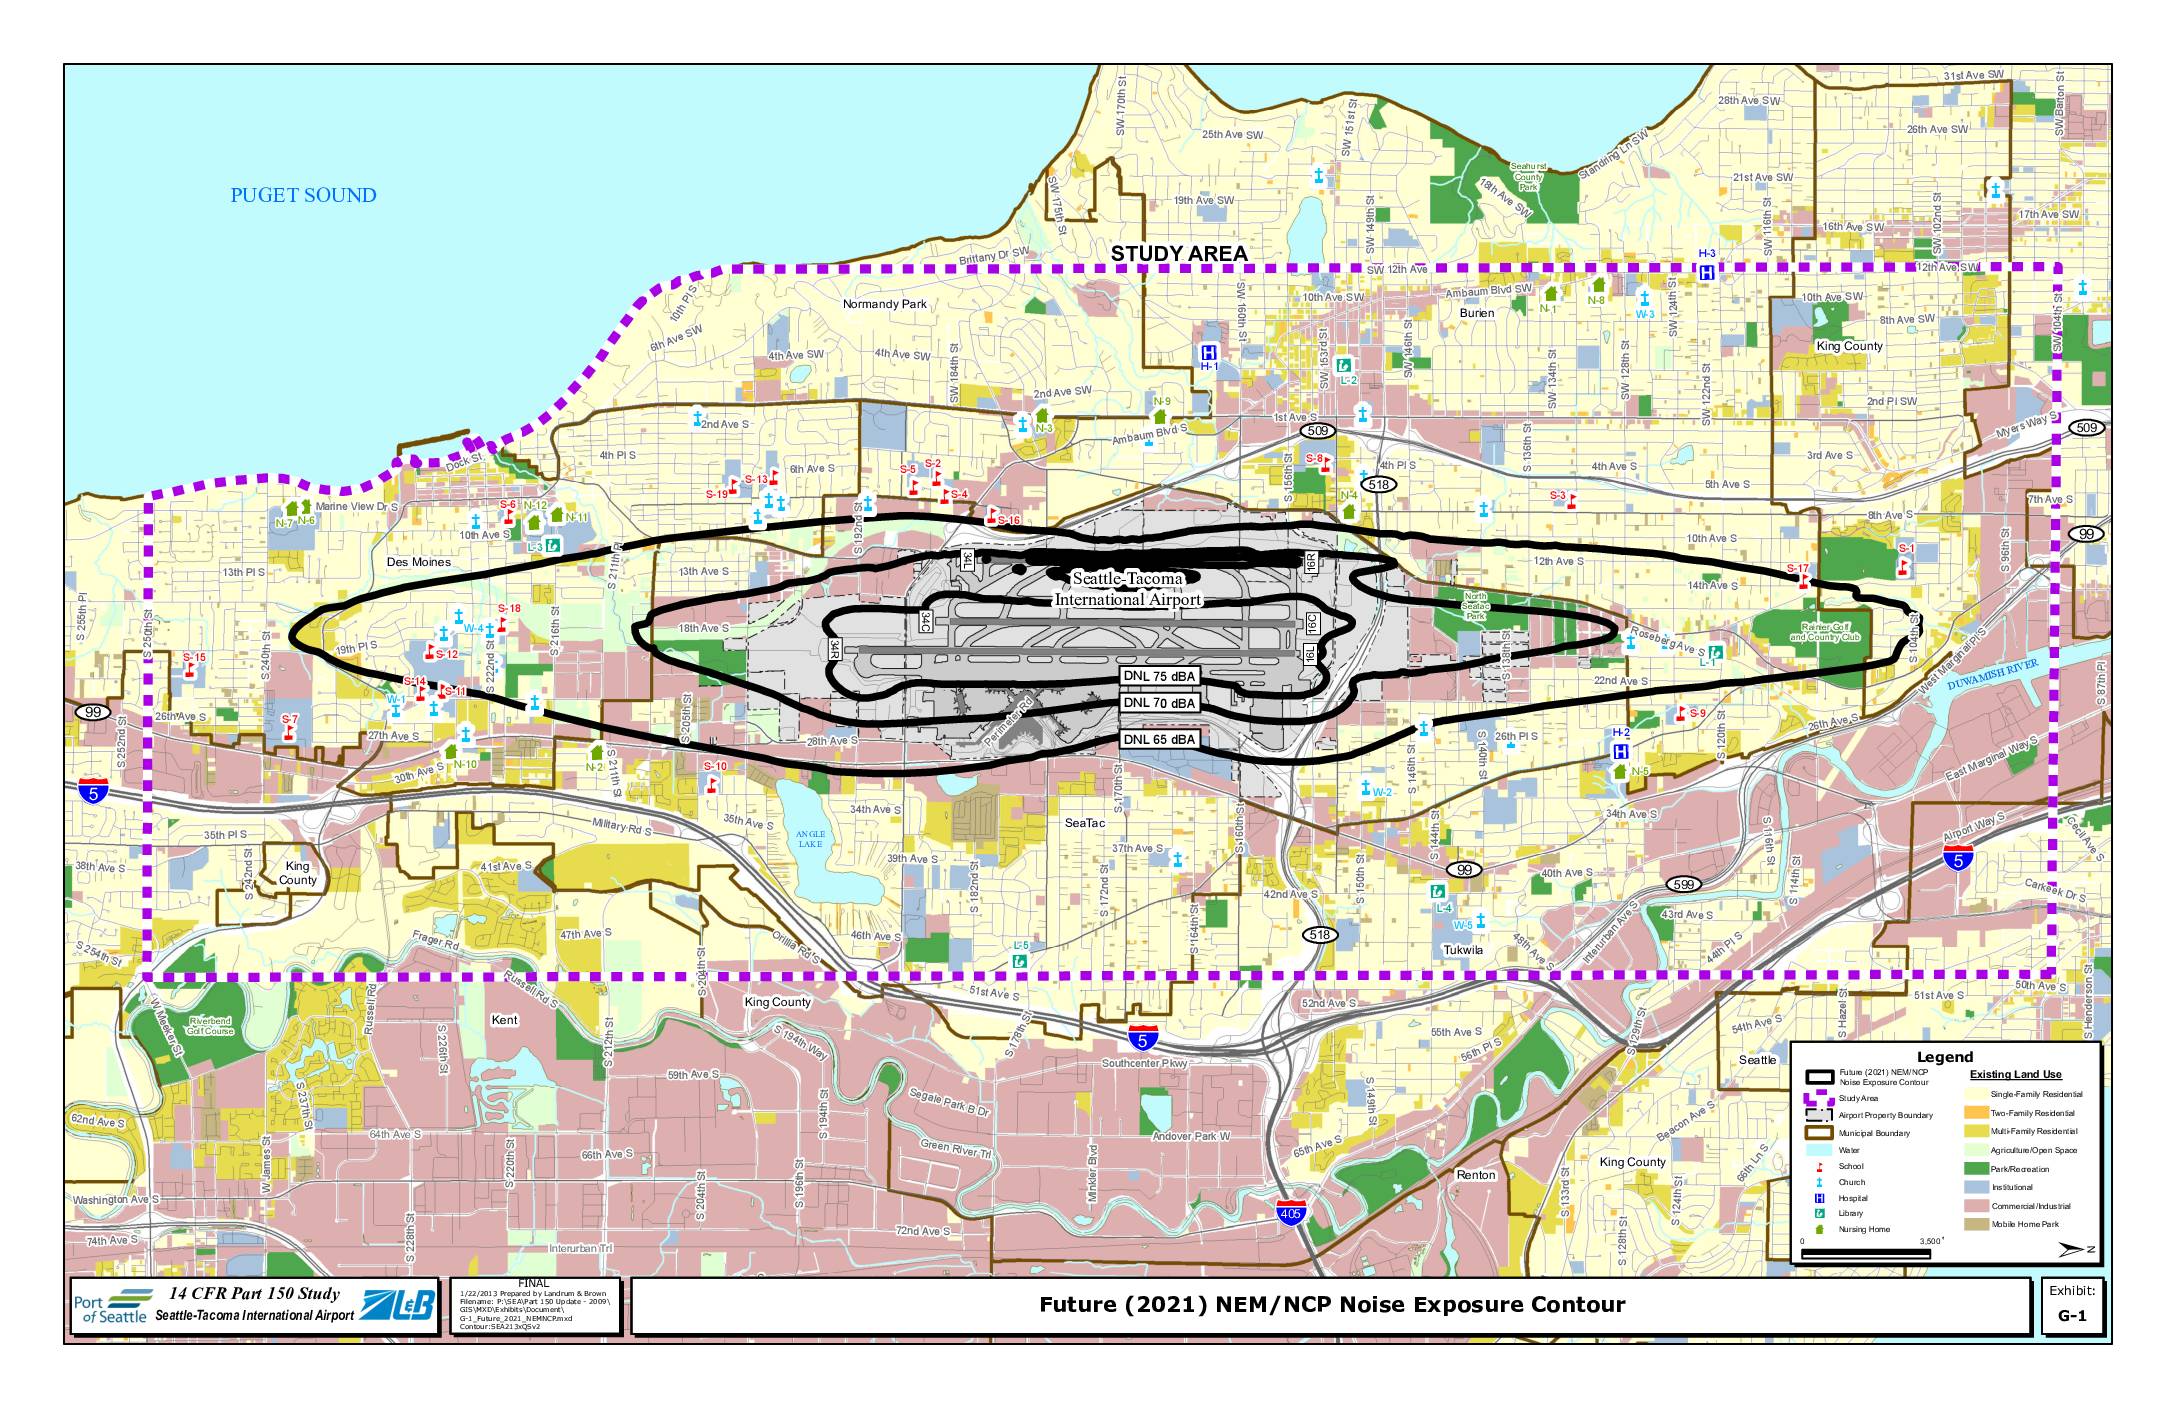
Exhibit G-1: Future (2021) NEM/NCP Noise Exposure Contour
This map, prepared by Landrum & Brown on January 22, 2013 as part of the 14 CFR Part 150 Study for Seattle-Tacoma International Airport, shows projected future (2021) noise exposure contours around Sea-Tac Airport at DNL 65, 70, and 75 dBA levels. The contours extend across surrounding communities including SeaTac, Burien, Des Moines, Tukwila, and portions of Renton and Kent, with sensitive land uses such as schools, churches, hospitals, and residential areas identified within the noise impact zones. The study was conducted to inform noise compatibility planning and policy decisions aimed at reducing aviation noise impacts on affected neighborhoods. -
 2003-09-01
Snohomish County Airport/Paine Field FAR Part 150 noise exposure maps update
This September 2003 report presents an update to the FAR Part 150 Noise Exposure Maps for Snohomish County Airport (Paine Field) near Everett, Washington, prepared by Barnard Dunkelberg & Company. It covers airport inventory, aircraft operations forecasts, and the development of noise contours to map areas affected by aircraft noise. The study was conducted with input from a Study Advisory Committee and involved formal public consultation processes. -
 1993-04-15
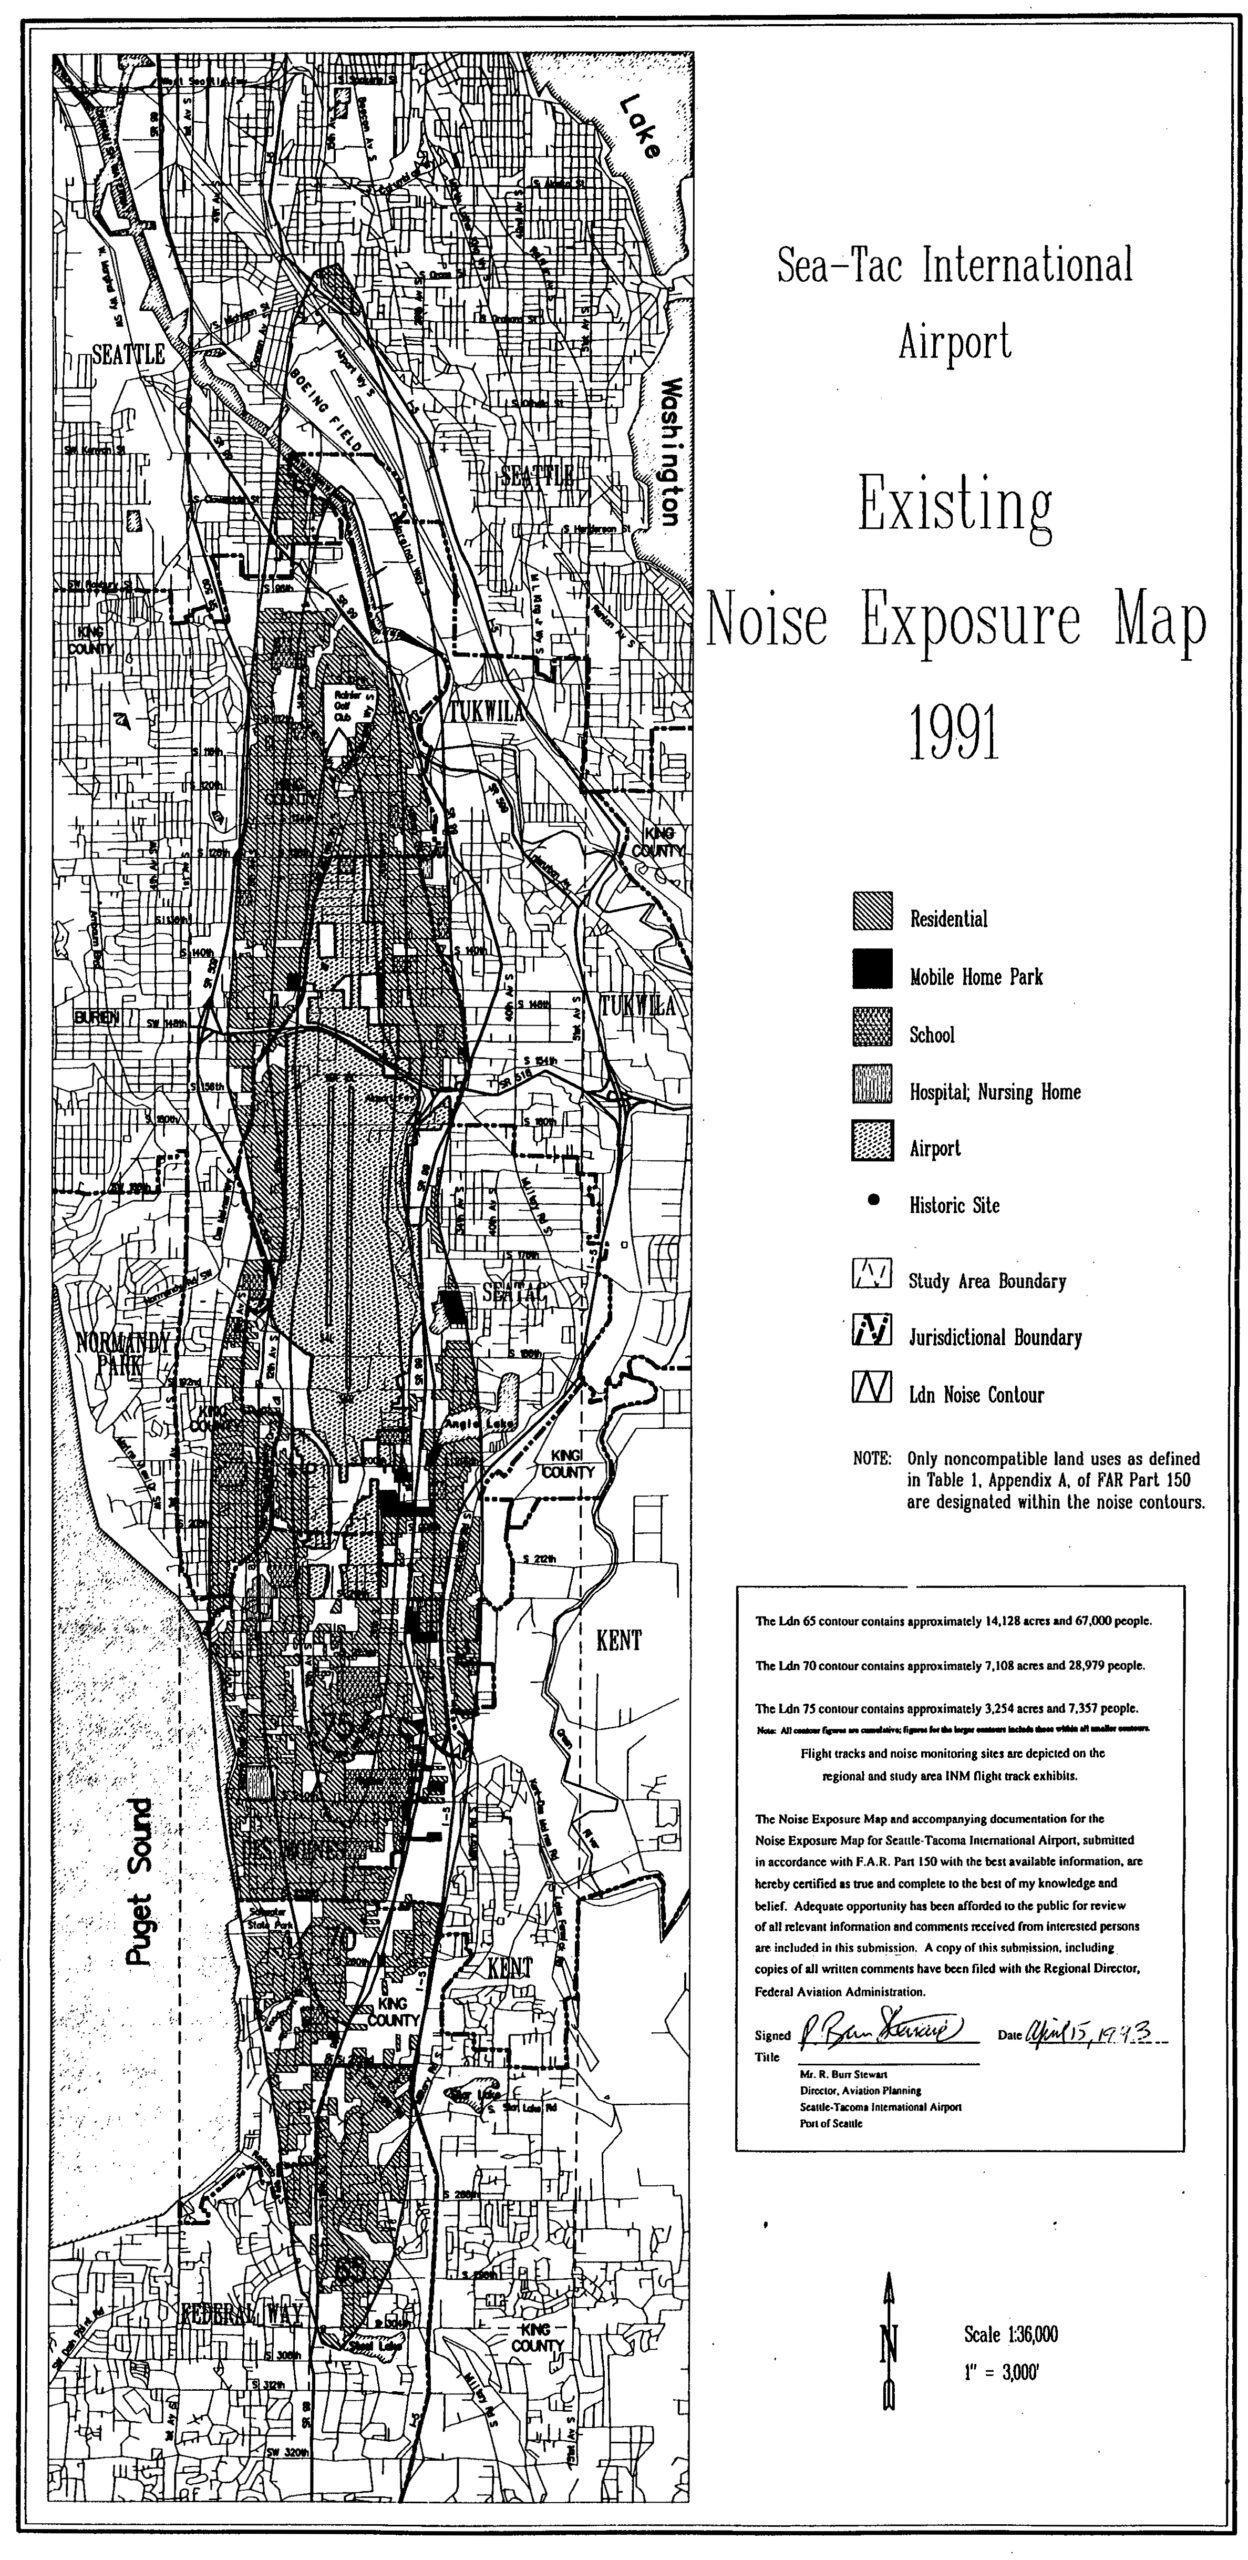
1991 Sea-Tac Part 150 Noise Exposure Map NEM
This is the official 1991 Existing Noise Exposure Map for Seattle-Tacoma International Airport, submitted in accordance with F.A.R. Part 150, signed by R. Bun Stewart, Director of Aviation Planning, Port of Seattle, on April 15, 1993. The map depicts Ldn noise contours (65, 70, and 75) over the surrounding communities including Seattle, Tukwila, SeaTac, Normandy Park, Burien, Kent, and Federal Way, with the Ldn 65 contour encompassing approximately 14,128 acres and 67,000 people. -
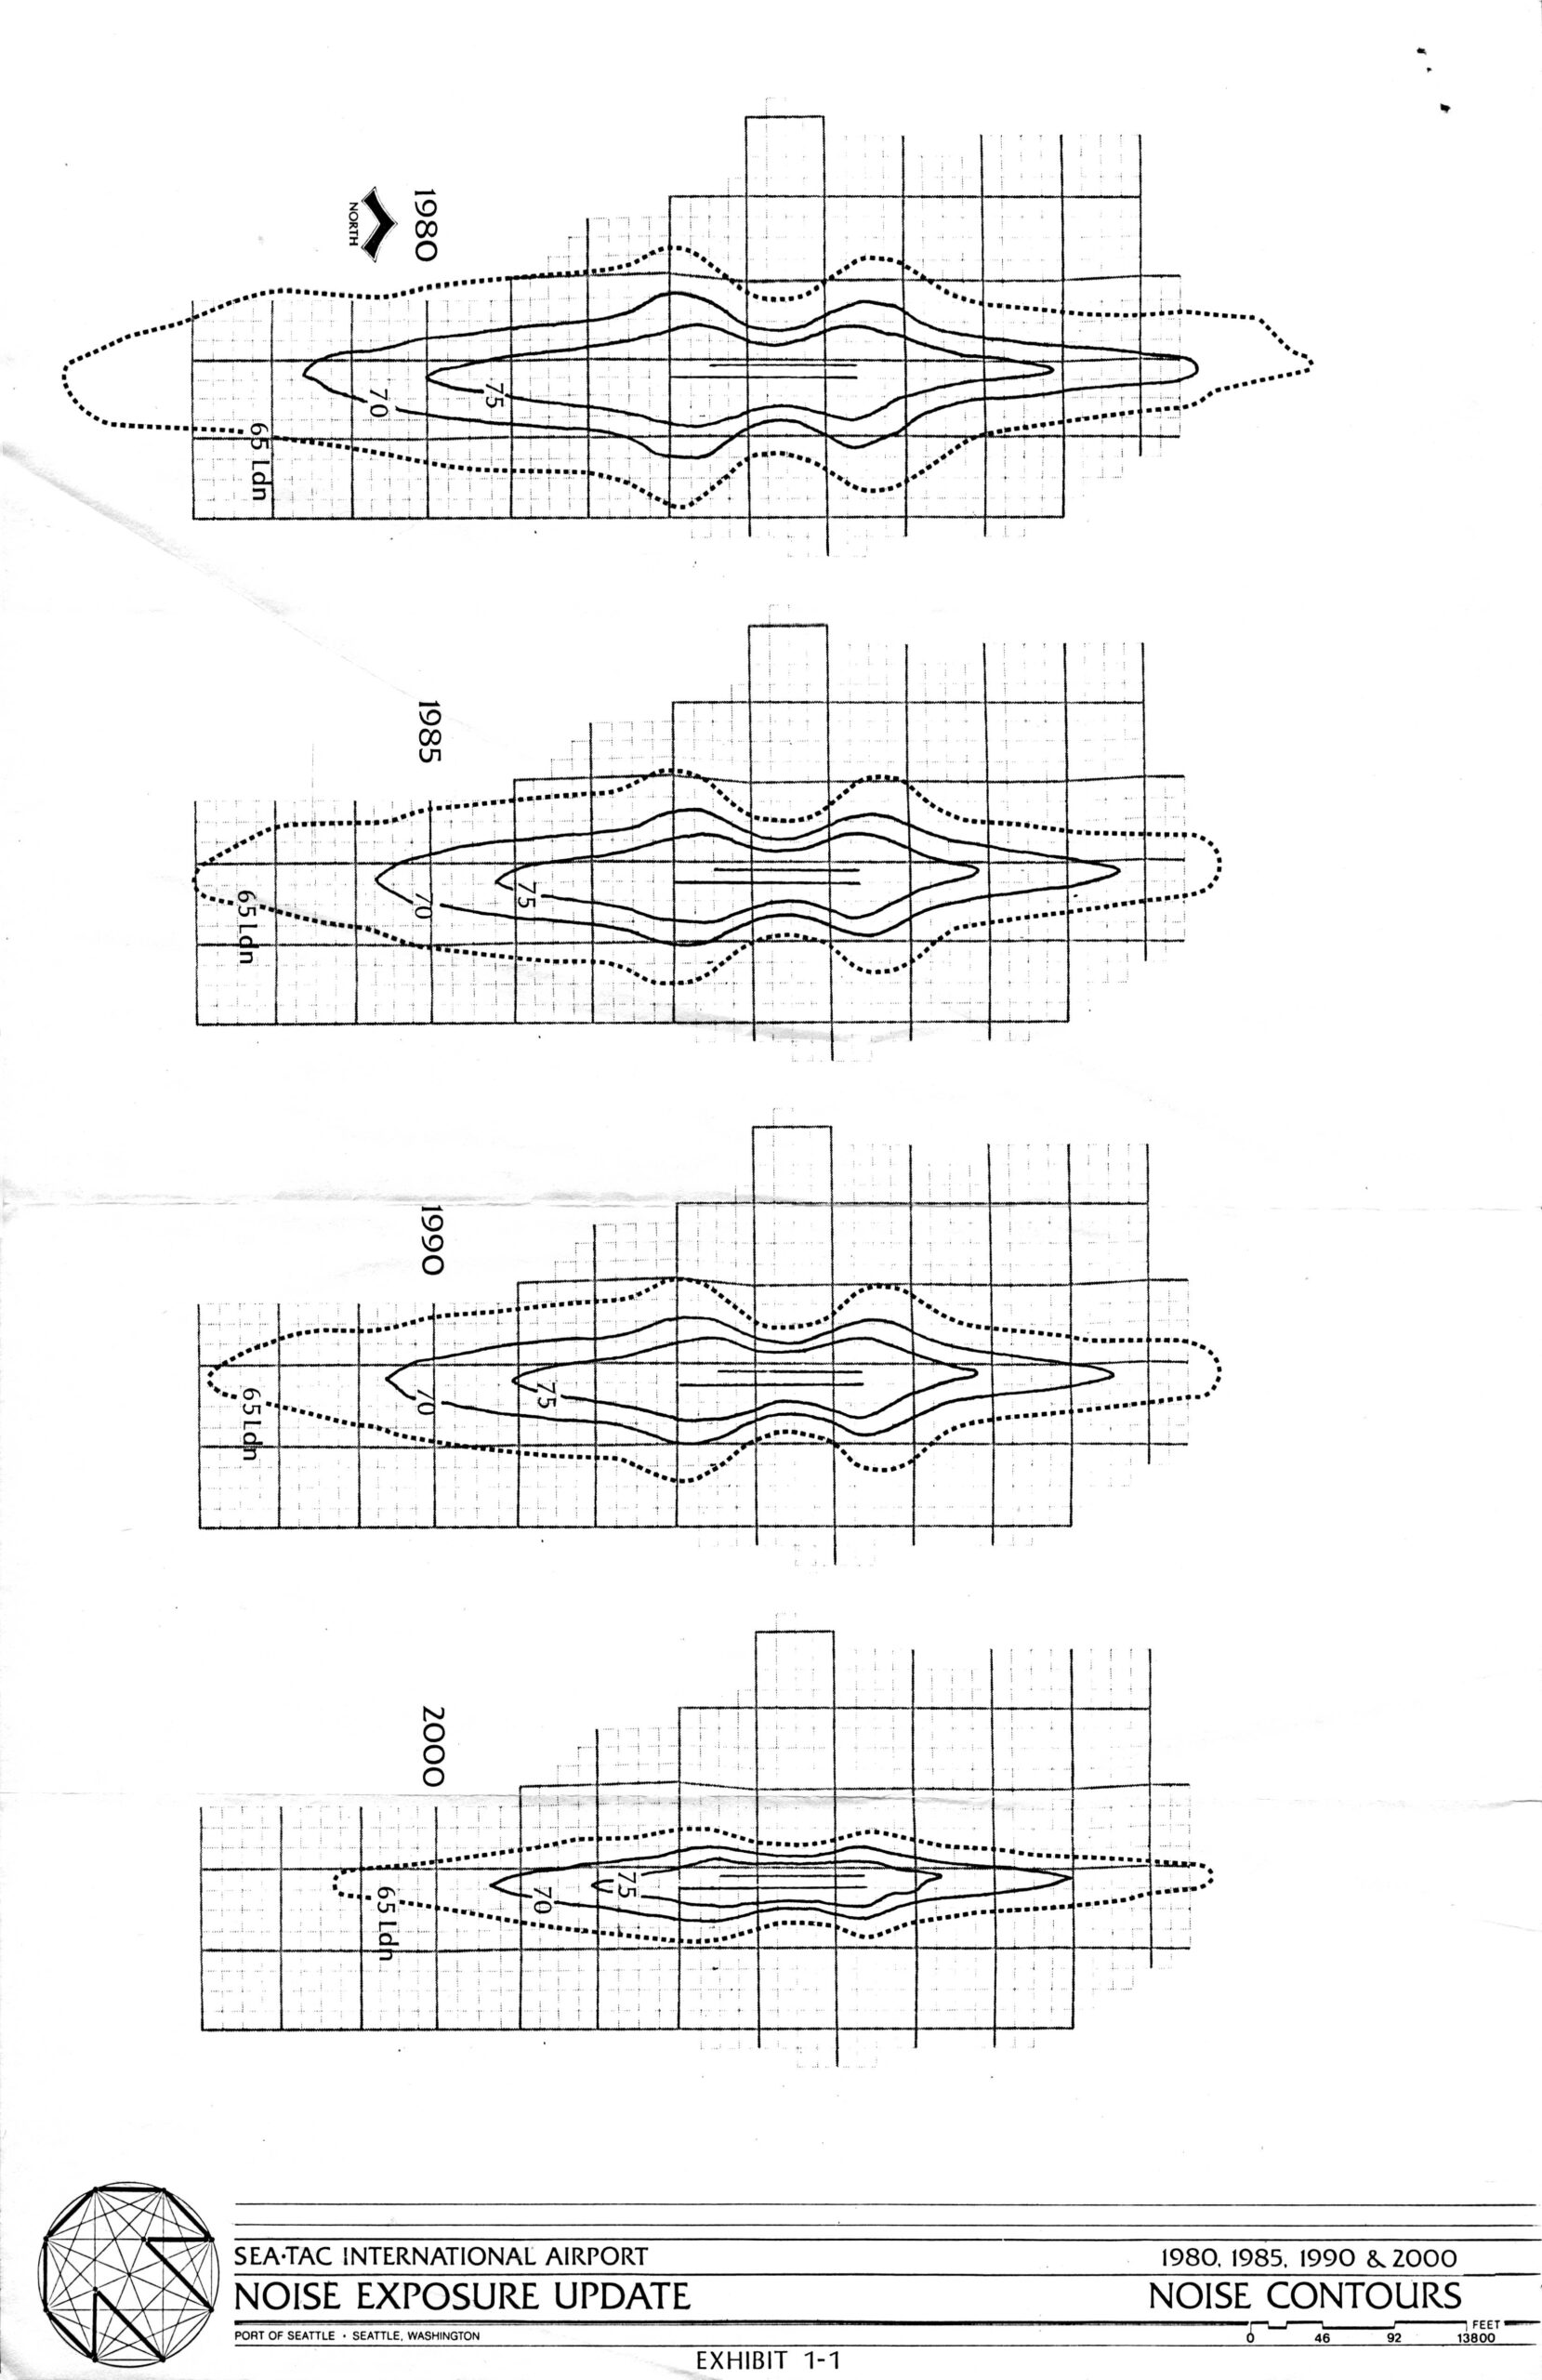
Forecasted Noise Contour Map 1980, 1985,1990, 2000
Exhibit 1-1 from the Port of Seattle's Sea-Tac International Airport Noise Exposure Update, showing four panels of DNL (Ldn) noise contour maps at the 65, 70, and 75 dB levels for the years 1980, 1985, 1990, and 2000. The contours illustrate the projected lateral and longitudinal extent of aircraft noise impact around the airport's runway alignment over those two decades.