TagNEPA(390)
-
 2025-11-20
Engagement Letter – Special Environmental Counsel Services: Cities of Burien, Des Moines, and Sea-Tac
In November 2025, the law firm Ogden Murphy Wallace (OMW) agreed to jointly represent the cities of Burien, Des Moines, and SeaTac as special environmental counsel in matters related to the Port of Seattle's Sustainable Airport Master Plan. The firm's scope of work covers environmental review processes under federal (NEPA) and state (SEPA) law, as well as any potential litigation against the Port of Seattle or the Federal Aviation Administration. Attorneys are billed at hourly rates ranging from $300 to $535 depending on role and experience, with no advance fee deposit required. -
 2025-11-18
Jennifer Sanscrainte: Attorney Profile, Ogden Murphy Wallace
Jennifer Sanscrainte is an environmental and tribal law attorney at Ogden Murphy Wallace in Seattle, representing public and private clients on matters involving federal and state environmental laws such as CERCLA, the Clean Water Act, and the Clean Air Act. She specializes in site remediation, cleanup cost recovery, and permitting, and also works with Native American tribes on environmental program development. This document is a professional biography and does not contain information related to Sea-Tac Airport noise policy. -
 2025-11-16
Interlocal agreement for coordinated SAMP review and legal services
The City of Des Moines and neighboring cities have entered into an Interlocal Agreement (ILA) to coordinate their review of and response to the SeaTac Airport Master Plan (SAMP) environmental review process, covering both federal (NEPA) and state (SEPA) requirements. Originally signed in 2018 and updated in 2024, the agreement establishes how participating cities share costs, manage contracts, and jointly hire environmental and legal consultants—including attorneys who can support a legal challenge to the SAMP's environmental conclusions. The latest version, managed by the City of SeaTac and expected to run through December 31, 2028, excludes Normandy Park but otherwise continues the multi-city partnership focused on protecting community interests during the airport planning process. -
 2025-11-16
Des Moines, WA – NEPA Appeal Slide, Airport Advisory Committee Recommendation
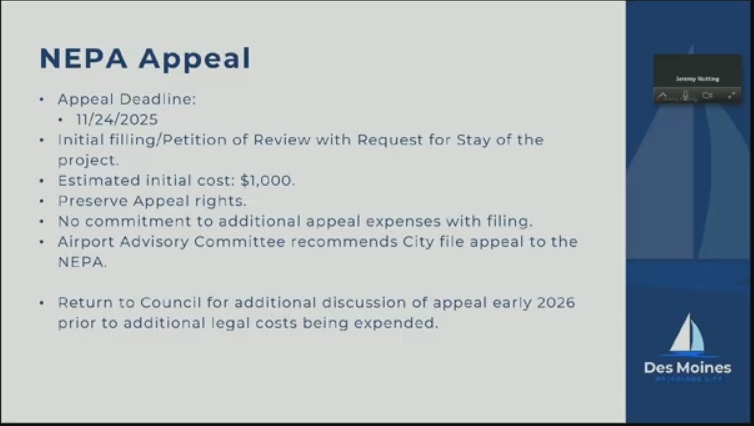
A City of Des Moines (Washington) presentation slide outlining a NEPA appeal with a deadline of 11/24/2025, an estimated initial filing cost of $1,000, and a recommendation from the Airport Advisory Committee that the City file the appeal. The slide notes the City would return to Council in early 2026 before incurring additional legal costs. -
 2025-11-14
NEPA Determination, Simple Categorical Exclusion for the Industrial Wastewater Treatment Plan Expansion Project at Seattle-Tacoma International Airport
The FAA has determined that Seattle-Tacoma International Airport's proposed expansion of its Industrial Wastewater Treatment Plant (IWTP) qualifies for a Simple Categorical Exclusion under the National Environmental Policy Act, meaning the project is not expected to have a significant impact on the environment. The project includes upgrades to the existing treatment plant infrastructure, construction of an aerated gravel bed, and updates to the adjacent Lagoon 3 site. This determination, issued November 14, 2025, clears the way for the required Airport Layout Plan update without the need for further environmental review. -
2025-11-14
NEPA Determination, Simple Categorical Exclusion for the Industrial Wastewater Treatment Plan Expansion Project at Seattle-Tacoma International Airport
The FAA has determined that Seattle-Tacoma International Airport's proposed expansion of its Industrial Wastewater Treatment Plant (IWTP) qualifies for a Simple Categorical Exclusion under the National Environmental Policy Act, meaning the project is not expected to have a significant impact on the environment. The project includes upgrades to the existing treatment plant infrastructure, construction of an aerated gravel bed, and updates to the adjacent Lagoon 3 site. This determination, issued November 14, 2025, clears the way for the required Airport Layout Plan update without the need for further environmental review. -
 2025-11-13
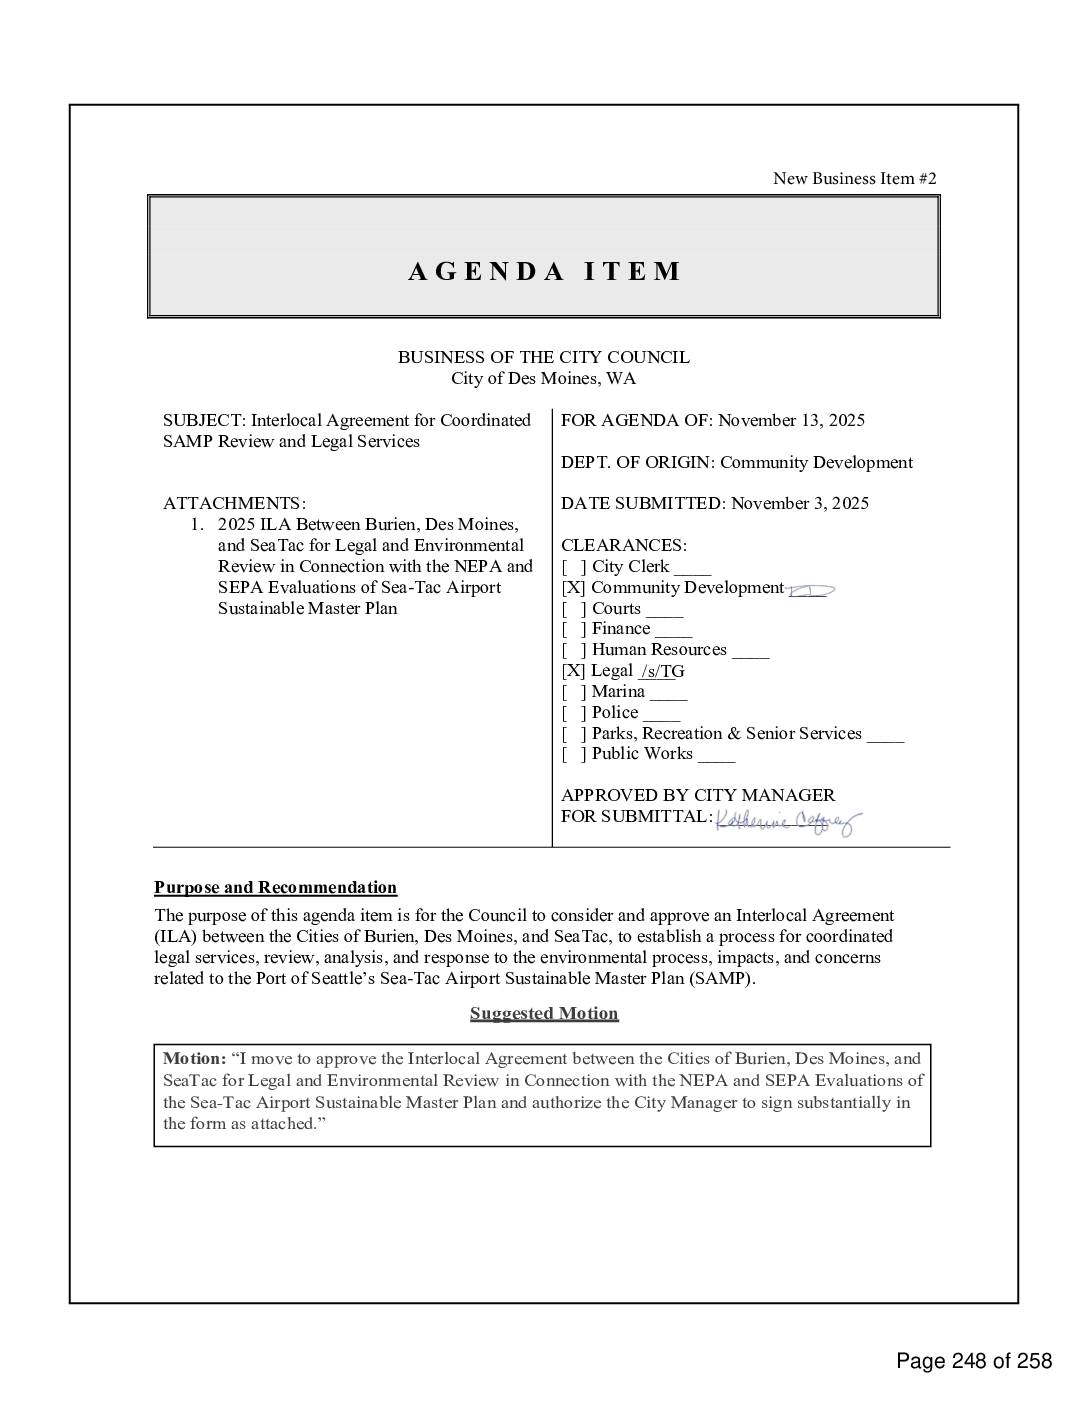
Interlocal agreement between the cities of Burien, Des Moines, and SeaTac for legal and environmental review in connection with the NEPA and SEPA evaluations of the Sea-Tac Airport Sustainable Airport Master Plan
The cities of Burien, Des Moines, and SeaTac are joining forces under a formal Interlocal Agreement to coordinate their review of and legal response to the Port of Seattle's Sea-Tac Airport Sustainable Airport Master Plan (SAMP), which could bring significant noise and environmental impacts to surrounding communities. The agreement, considered by Des Moines City Council on November 13, 2025, allows the three cities to jointly hire environmental consultants and legal counsel to analyze and formally challenge the airport expansion's environmental review under both federal (NEPA) and state (SEPA) law. A Draft Environmental Impact Statement from the Port is expected in early 2026, with the overall process estimated to conclude by December 31, 2028. -
 2025-11-12
SEA Sustainable Airport Master Plan: ILA, Budget Amendment, Letters of Engagement (AB 6794)
The cities of SeaTac, Burien, Des Moines, and Normandy Park are jointly challenging the FAA's environmental review of the Port of Seattle's Sustainable Airport Master Plan (SAMP), arguing that a September 2025 Finding of No Significant Impact (FONSI) failed to adequately address their concerns about airport expansion impacts. The SeaTac City Council is being asked to approve a budget amendment of up to $350,000, authorize an Interlocal Agreement among the four cities, and hire two law firms to advocate for airport-affected communities. The action reflects ongoing efforts by neighboring cities to ensure environmental impacts of SEA airport growth are properly evaluated under both federal (NEPA) and state (SEPA) law. -
 2025-11-12
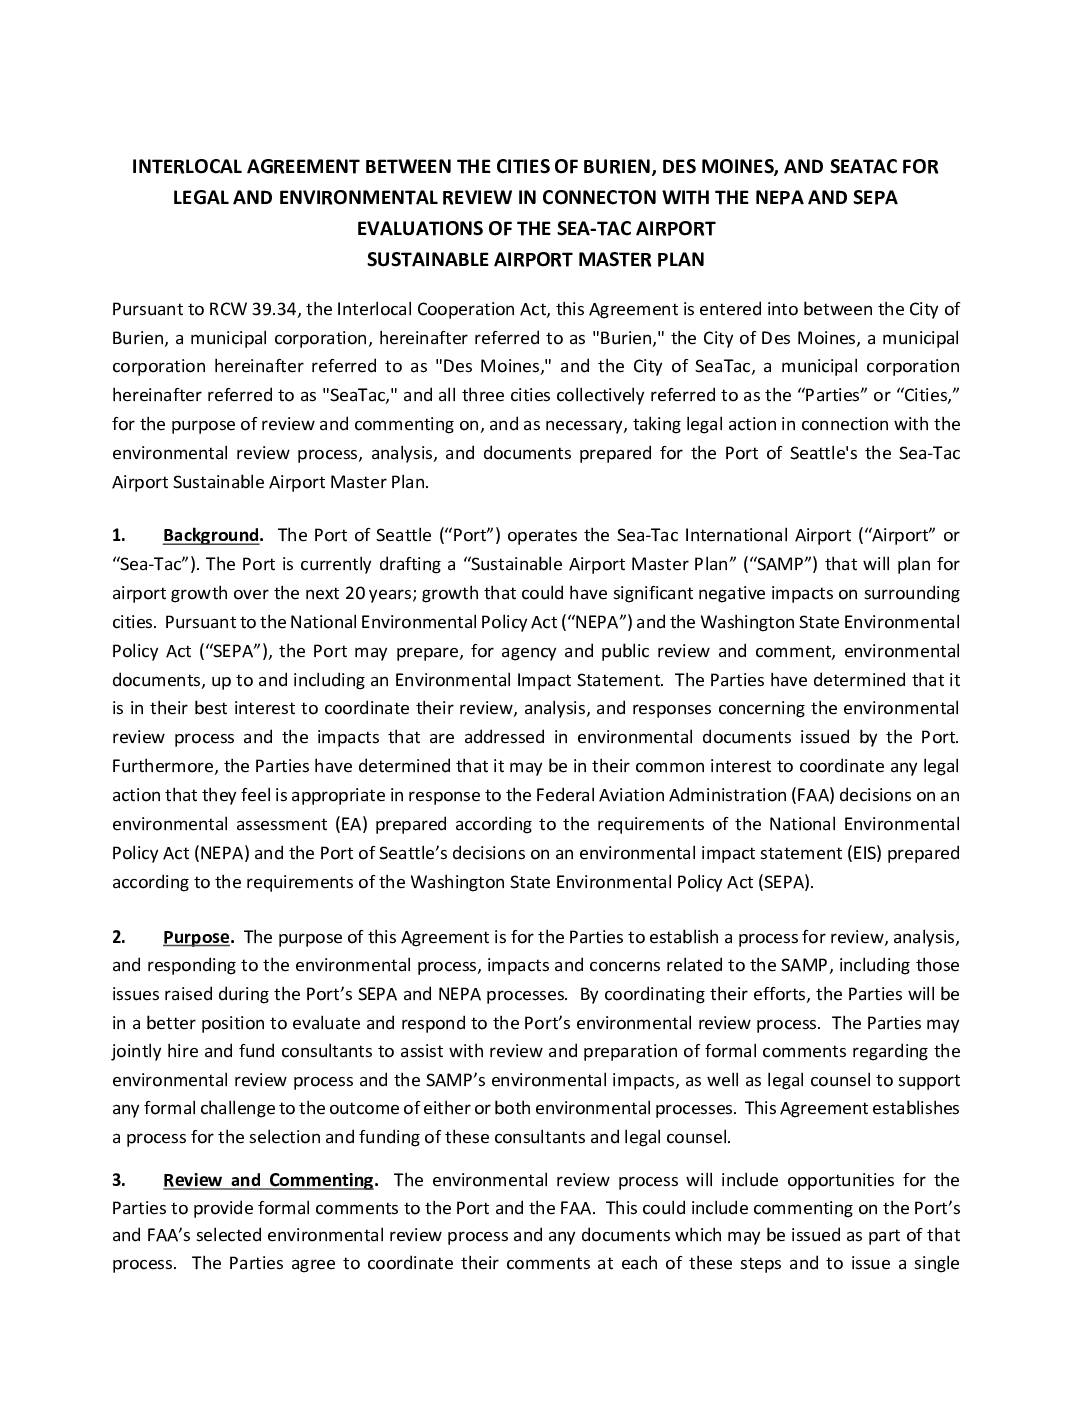
Interlocal Agreement Between the Cities of Burien, Des Moines, and Sea-Tac for Legal and Environmental Review in Connection with the NEPA and SEPA Evaluations of the Sea-Tac Airport Sustainable Airport Master Plan
The cities of Burien, Des Moines, and SeaTac have entered into a formal agreement to coordinate their review of, and potential legal challenges to, the Port of Seattle's Sustainable Airport Master Plan, which could significantly impact surrounding communities over the next 20 years. The three cities agreed to share costs proportionally based on population, jointly hire environmental consultants and legal counsel, and issue unified comment letters during the NEPA and SEPA environmental review processes. Key provisions require unanimous agreement to file a joint appeal and a two-city majority to continue litigation at each subsequent stage. -
 2025-11-12
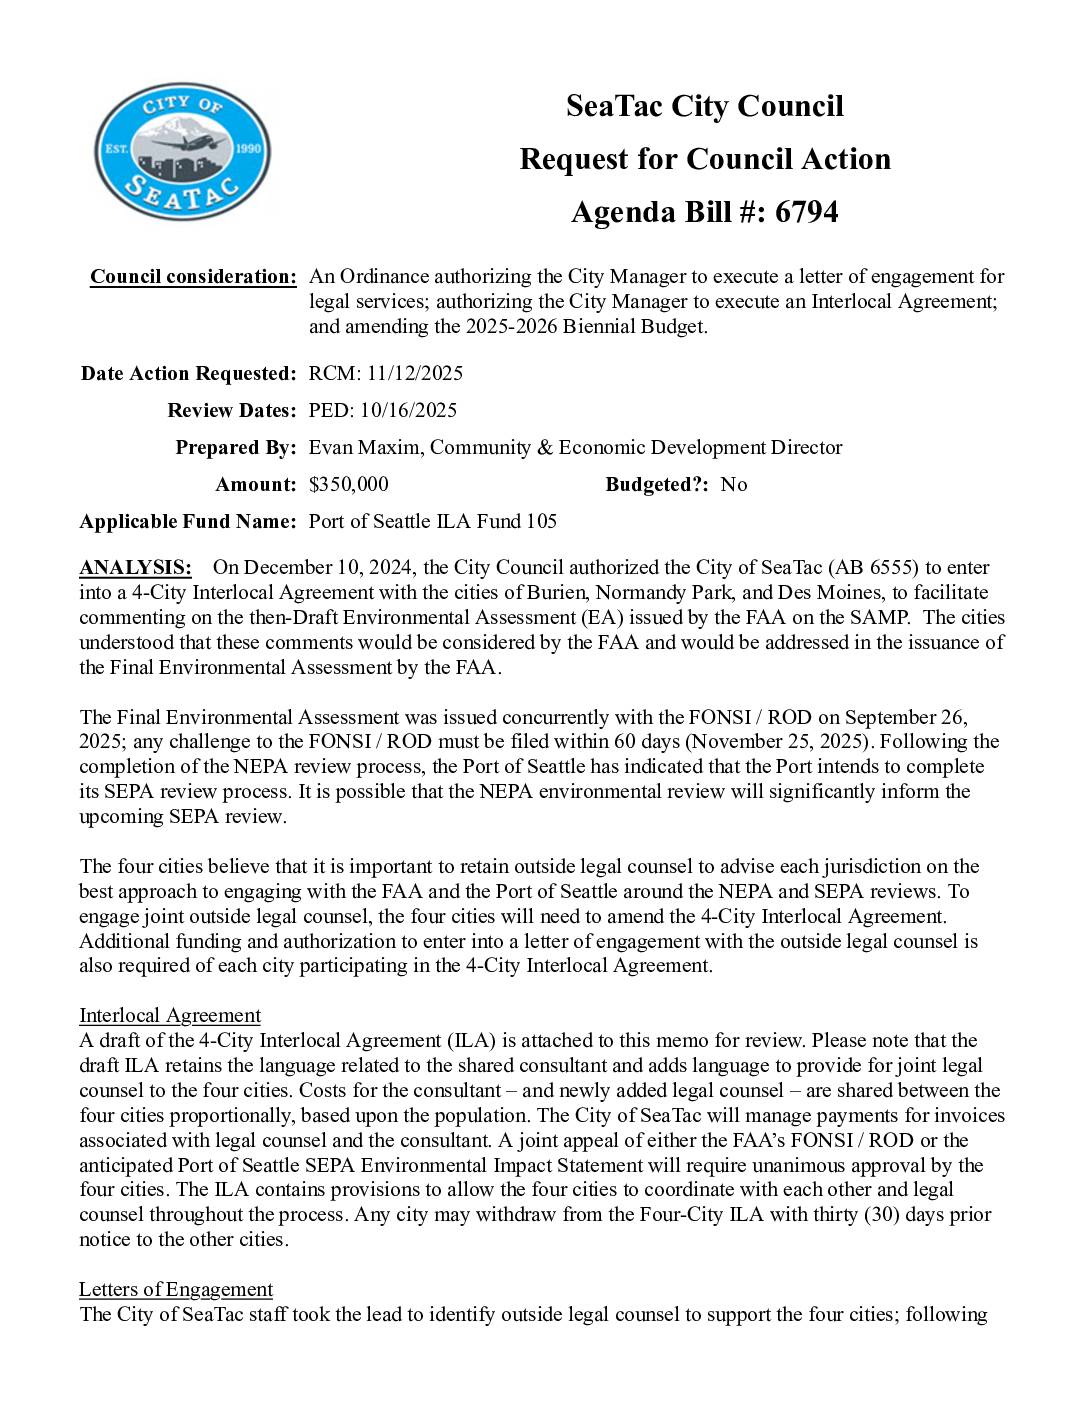
Sea-Tac City Council Request for Council Action: Agenda Bill 6794 — Authorization for Legal Services Letters of Engagement, Four-City Interlocal Agreement Amendment, and 2025-2026 Budget Amendment for SAMP NEPA/SEPA Review
The SeaTac City Council is considering an ordinance to hire outside legal counsel and update a cost-sharing agreement with the cities of Burien, Normandy Park, and Des Moines to challenge or engage with the FAA's environmental review of Seattle-Tacoma International Airport expansion plans. The four cities would jointly retain two law firms—Leech Tishman for federal NEPA matters and Ogden Murphy Wallace for state SEPA matters—at an estimated cost of $350,000, with SeaTac covering roughly 26% and recovering the rest from its partner cities. The effort is driven by the FAA's September 2025 issuance of a Final Environmental Assessment and Finding of No Significant Impact, which must be challenged by November 25, 2025.