TagStatistics(20)
-
 2020-05-29
Section 13: Socio-Economics — Study of the Current and Ongoing Effects of the Operation of the Seattle-Tacoma International Airport
This 2020 report examines the socio-economic conditions in six south King County cities near Seattle-Tacoma International Airport, including Burien, Des Moines, Federal Way, Normandy Park, SeaTac, and Tukwila. It analyzes demographic trends such as population growth, age distribution, and ethnic profiles from 1997 to 2018, finding that most study area cities grew more slowly than King County overall, with Burien being a notable exception largely due to a 2010 annexation. The report is part of a broader study assessing how airport operations affect surrounding communities across indicators including income, housing, education, employment, and municipal tax revenues. -
 2019-06-01
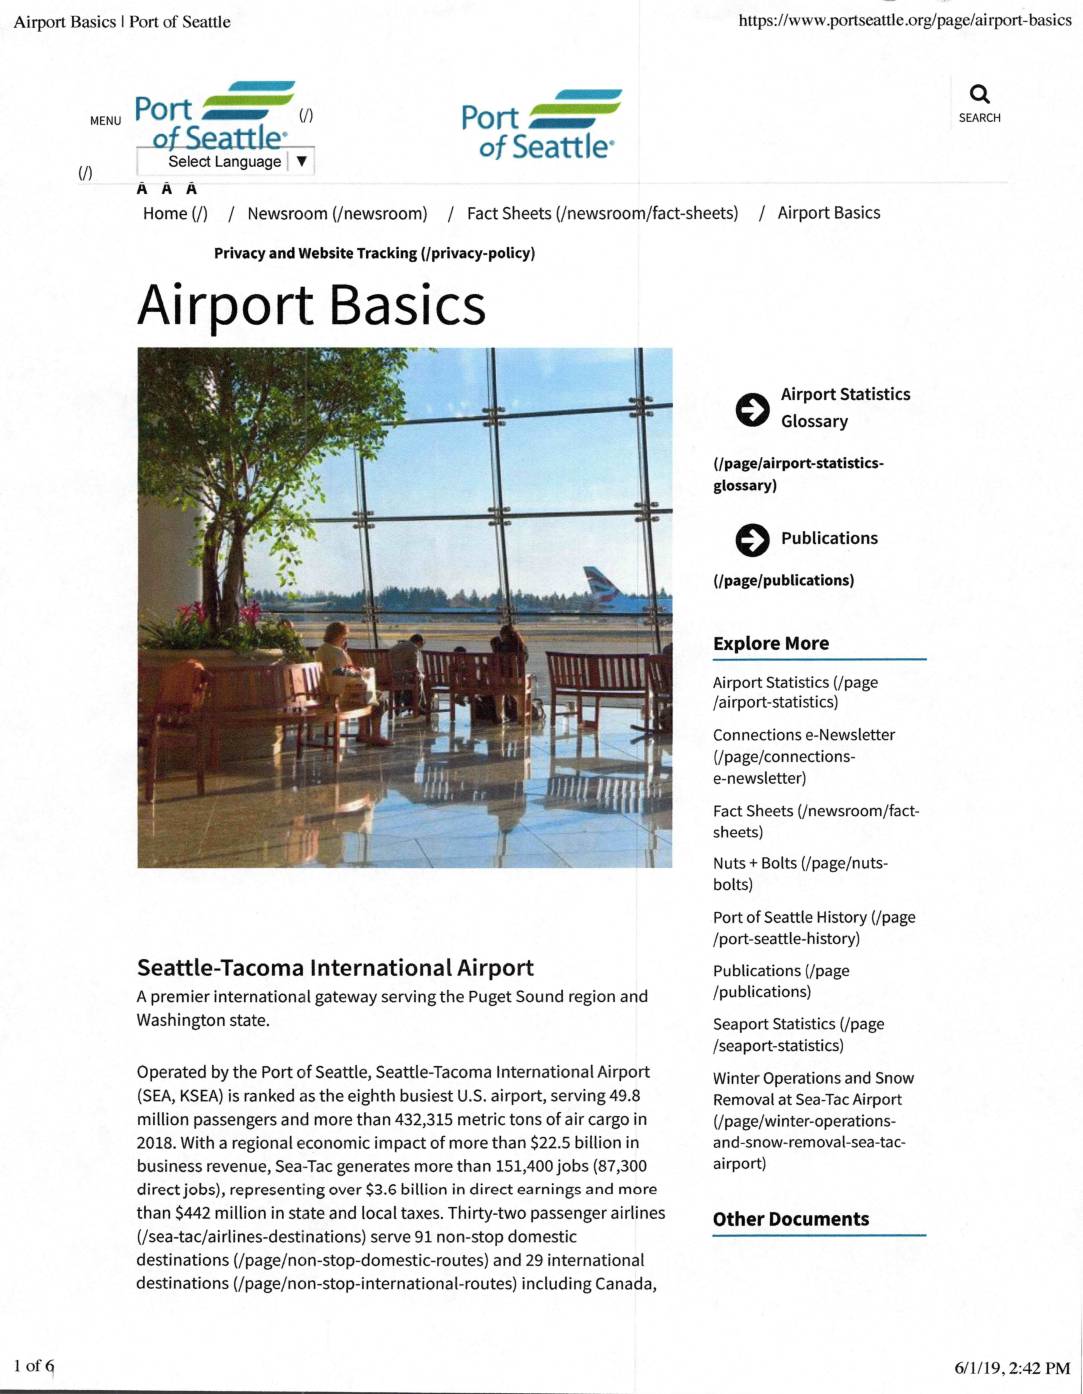
Airport basics
Seattle-Tacoma International Airport (Sea-Tac), operated by the Port of Seattle, is the eighth busiest U.S. airport, serving 49.8 million passengers and handling over 432,315 metric tons of air cargo in 2018, with 32 airlines offering 91 domestic and 29 international non-stop destinations. The document also profiles Jason Schwartz, an aviation professional with over 25 years of experience specializing in airport noise management, UAS operations, and airside planning, currently serving in dual roles at the Port of Portland and his own consulting firm, Aviation Compatibility Consulting. Schwartz's background includes noise program management, community engagement, and relevant certifications in airport environmental management and business operations. -
 2019-06-01
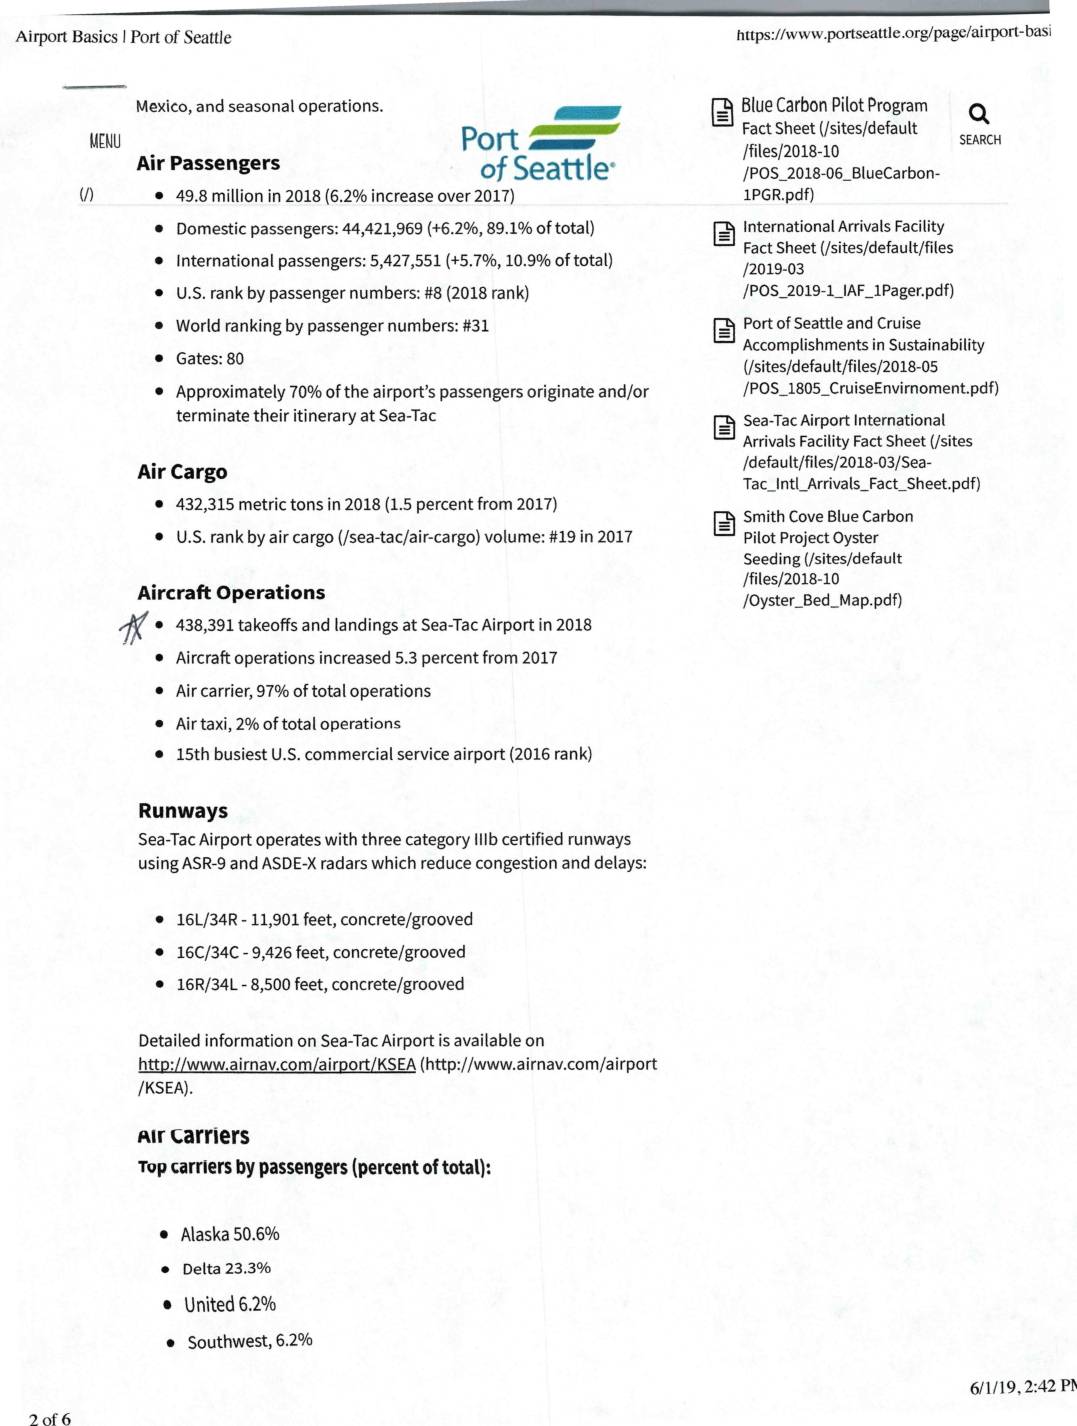
Airport basics | Port Of Seattle
Seattle-Tacoma International Airport handled 49.8 million passengers and 438,391 aircraft operations in 2018, ranking 8th in the U.S. by passenger volume. A noise compatibility study forecasted total annual aircraft operations to grow from approximately 301,870 in 2009 to 399,200 by 2021, driven by increases in both domestic and international air carrier activity. The airport operates three category IIIb certified runways and is dominated by Alaska Airlines, which carries over 50% of its passengers. -
 2019-01-01
2019 Airport Traffic Report: John F. Kennedy International Airport, Newark Liberty International Airport, LaGuardia Airport, New York Stewart International Airport, Teterboro Airport
This is the 2019 Airport Traffic Report published by the Port Authority of New York and New Jersey, covering five airports: John F. Kennedy International, Newark Liberty International, LaGuardia, New York Stewart International, and Teterboro. The report compiles data on aircraft movements, passenger traffic, cargo transport, and ground transportation across these airports for the year 2019. Note that this report pertains to the New York/New Jersey region and does not contain information relevant to Sea-Tac Airport or noise policy. -
 2018-04-25
Sea-Tac Airport: passenger and air cargo activity
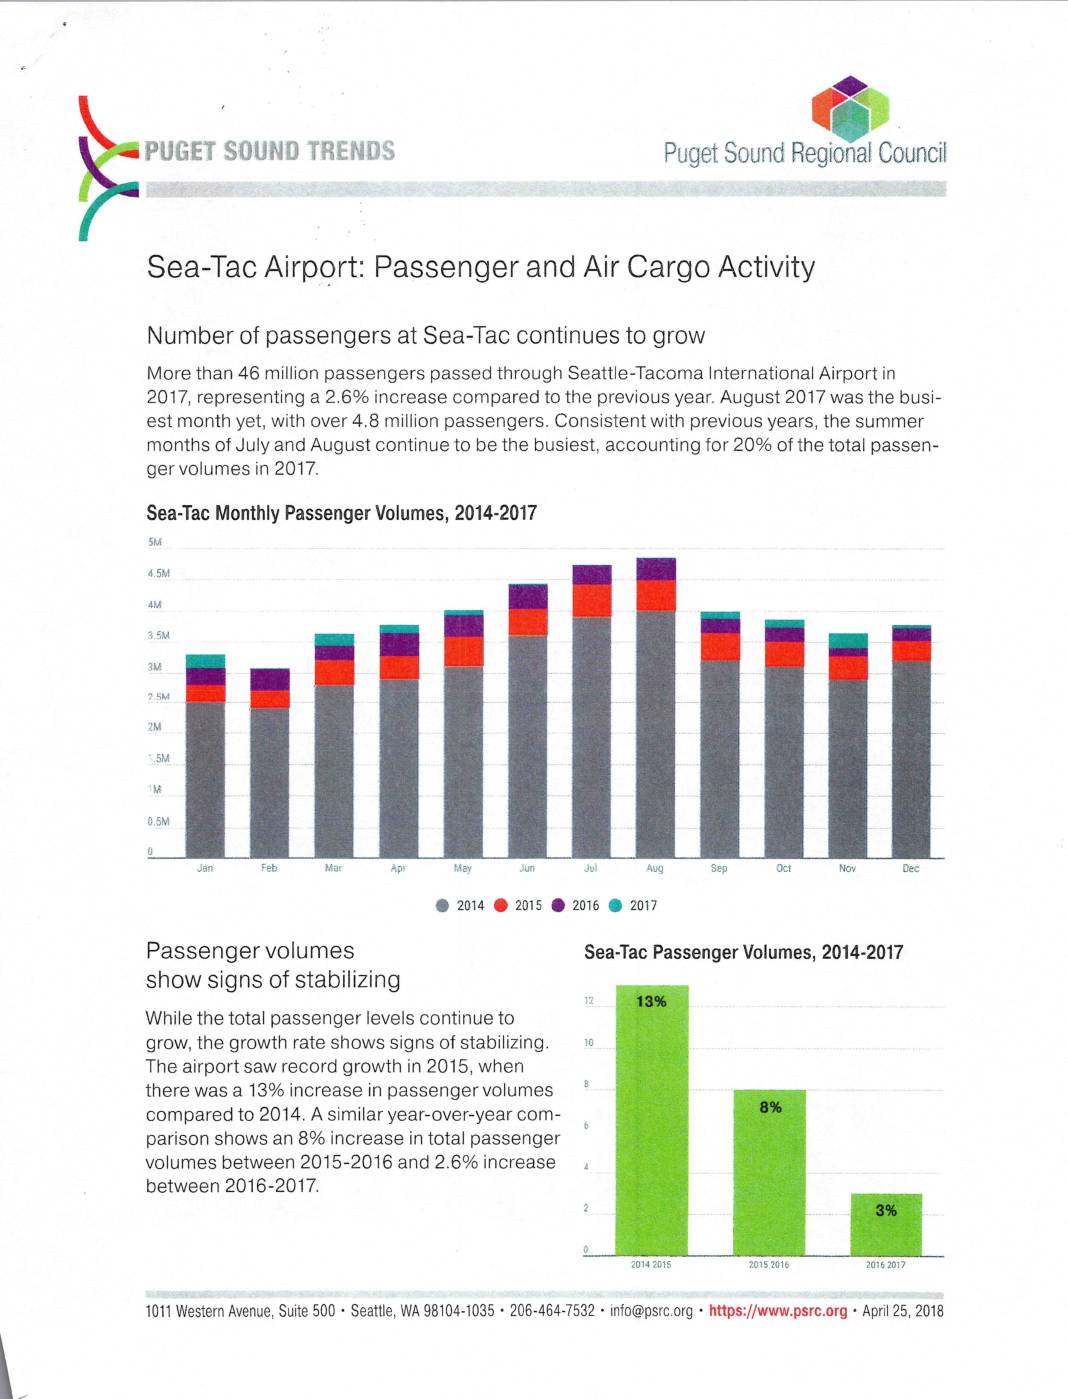
Sea-Tac Airport saw record activity between 2014 and 2017, with over 46 million passengers and 425,895 metric tons of cargo passing through in 2017 alone. Passenger growth is slowing — dropping from a 13% year-over-year increase in 2015 to just 2.6% in 2017 — while air cargo, driven largely by domestic freight, surged 16% compared to the prior year. Summer months remain the busiest for passengers, and air mail volumes have shown a steady annual increase throughout the period. -
 1998-02-01
EXH AR041556: Multiple Day Rainfall Probabilities for Seattle-Tacoma International Airport
Report prepared by Parametrix, Inc. for Port Of Seattle analyzing multiple-day rainfall probabilities at Seattle-Tacoma International Airport (Sea-Tac Airport). AR041556. Contains annual maximum precipitation probability plots for 1-7 day periods, monthly rainfall probability plots for each calendar month, and April-October seasonal rainfall probability plots. Includes appendices with slope and intercept estimates for rainfall-to-probability and probability-to-rainfall -
 1992-07-01
Sea-Tac Airspace Update Study: Comparison of 1988 Airspace Update Study, 1992 Terminal Development Plan, and the 1991 Enhancement Plan
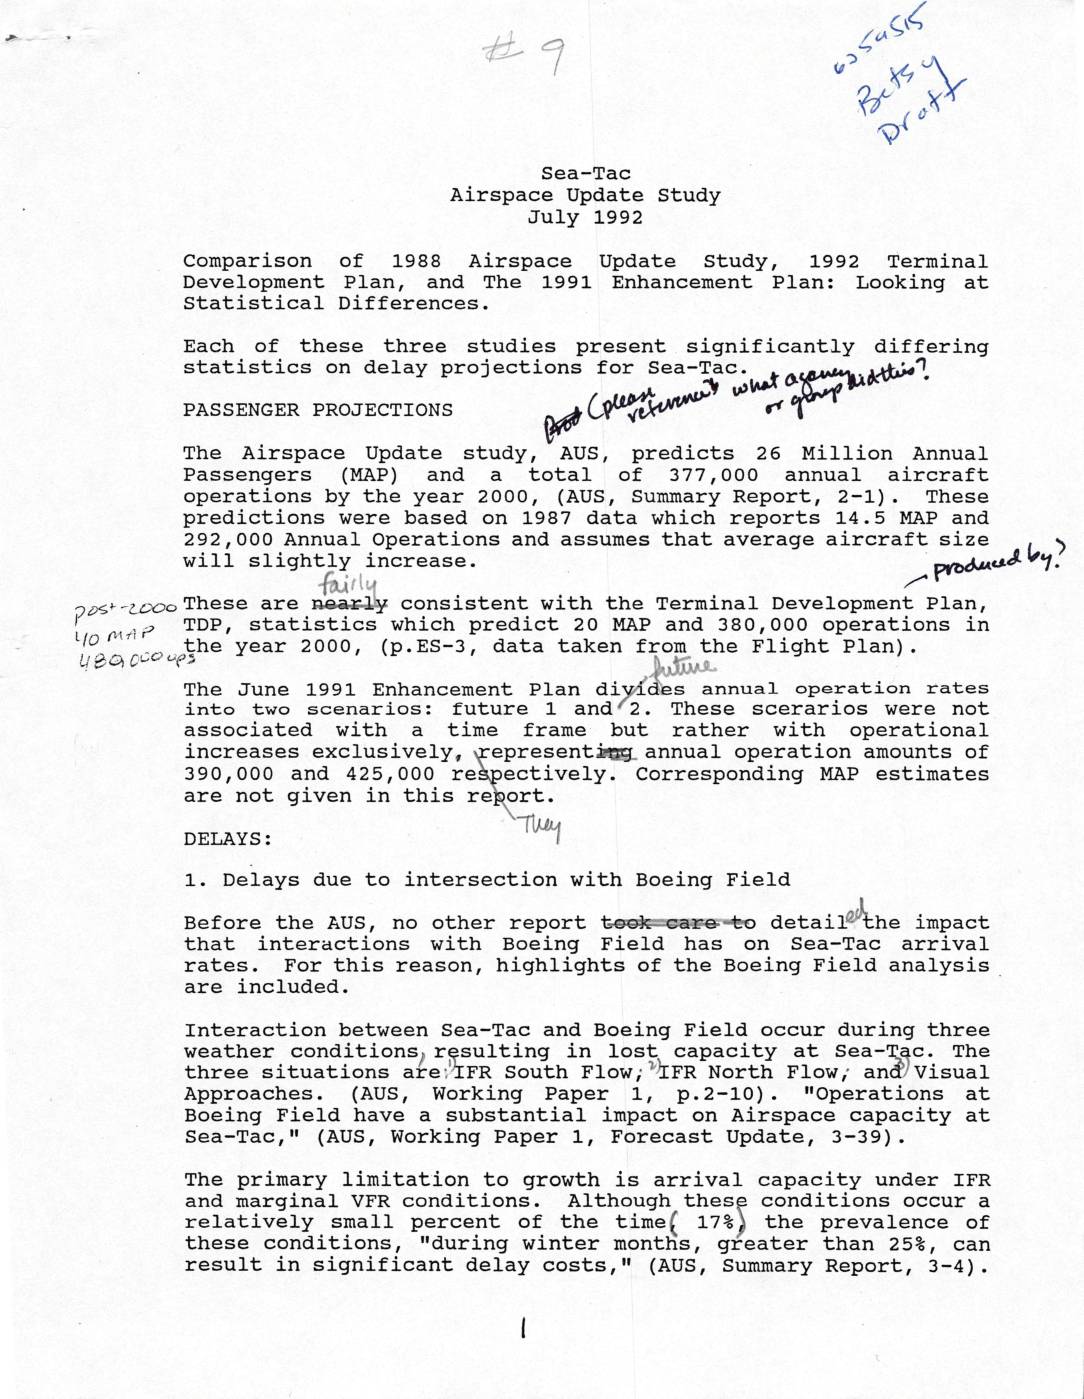
This 1992 study compares three planning reports on Sea-Tac Airport's future capacity and delays: the 1988 Airspace Update Study, the 1992 Terminal Development Plan, and the 1991 Enhancement Plan. The reports differ significantly in their passenger and flight operation projections for the year 2000, and show striking discrepancies in delay estimates — with the Enhancement Plan projecting delay hours more than five times higher than the Airspace Update Study. The document also outlines proposed solutions to reduce delays, including new runway construction, airspace conflict resolution with nearby Boeing Field, and improved approach procedures. -
 1990-01-01
First Quarter, 1990: Sea-Tac Noise Hotline Calls per Month and Complaint Analysis
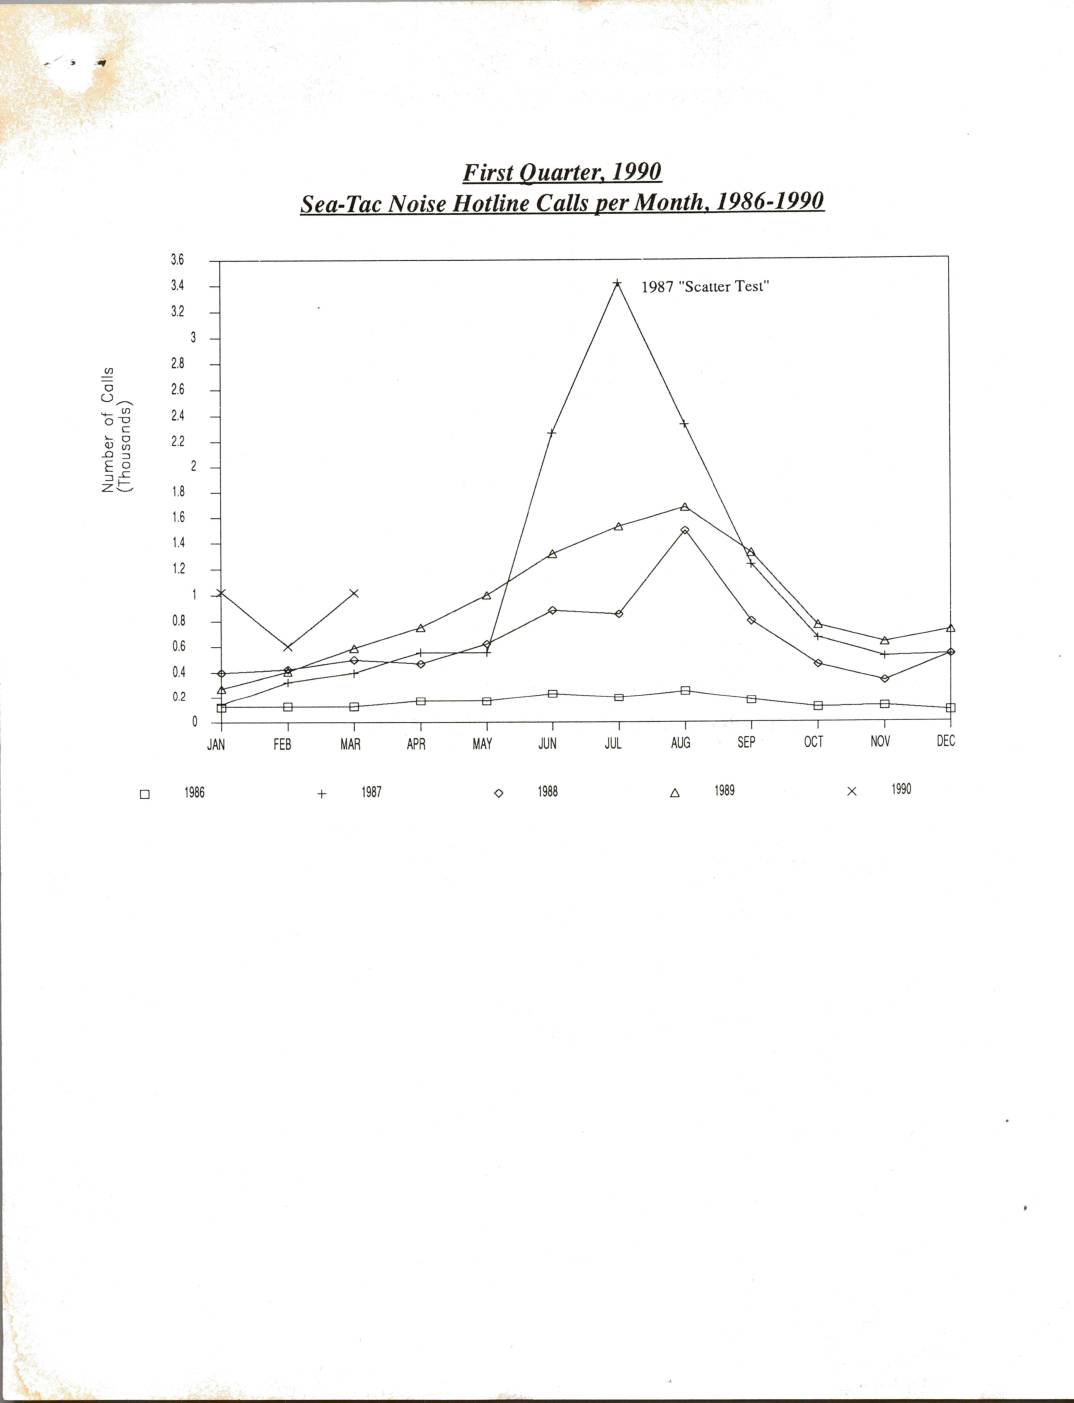
This report summarizes Sea-Tac Airport noise hotline complaint calls for the First Quarter of 1990, tracking call volumes from 1986 through early 1990 and noting a significant spike during the 1987 'Scatter Test.' The majority of complaints (57.2%) concerned northbound departures, while callers most commonly described aircraft as 'too loud' (57.5%) or 'too frequent' (22.2%). A zip-code breakdown shows complaints originated from communities across the greater Seattle-Tacoma region, with areas such as E. Queen Anne Hill and North Renton/Maple Wood among the higher-volume sources. -
 1975-04-22
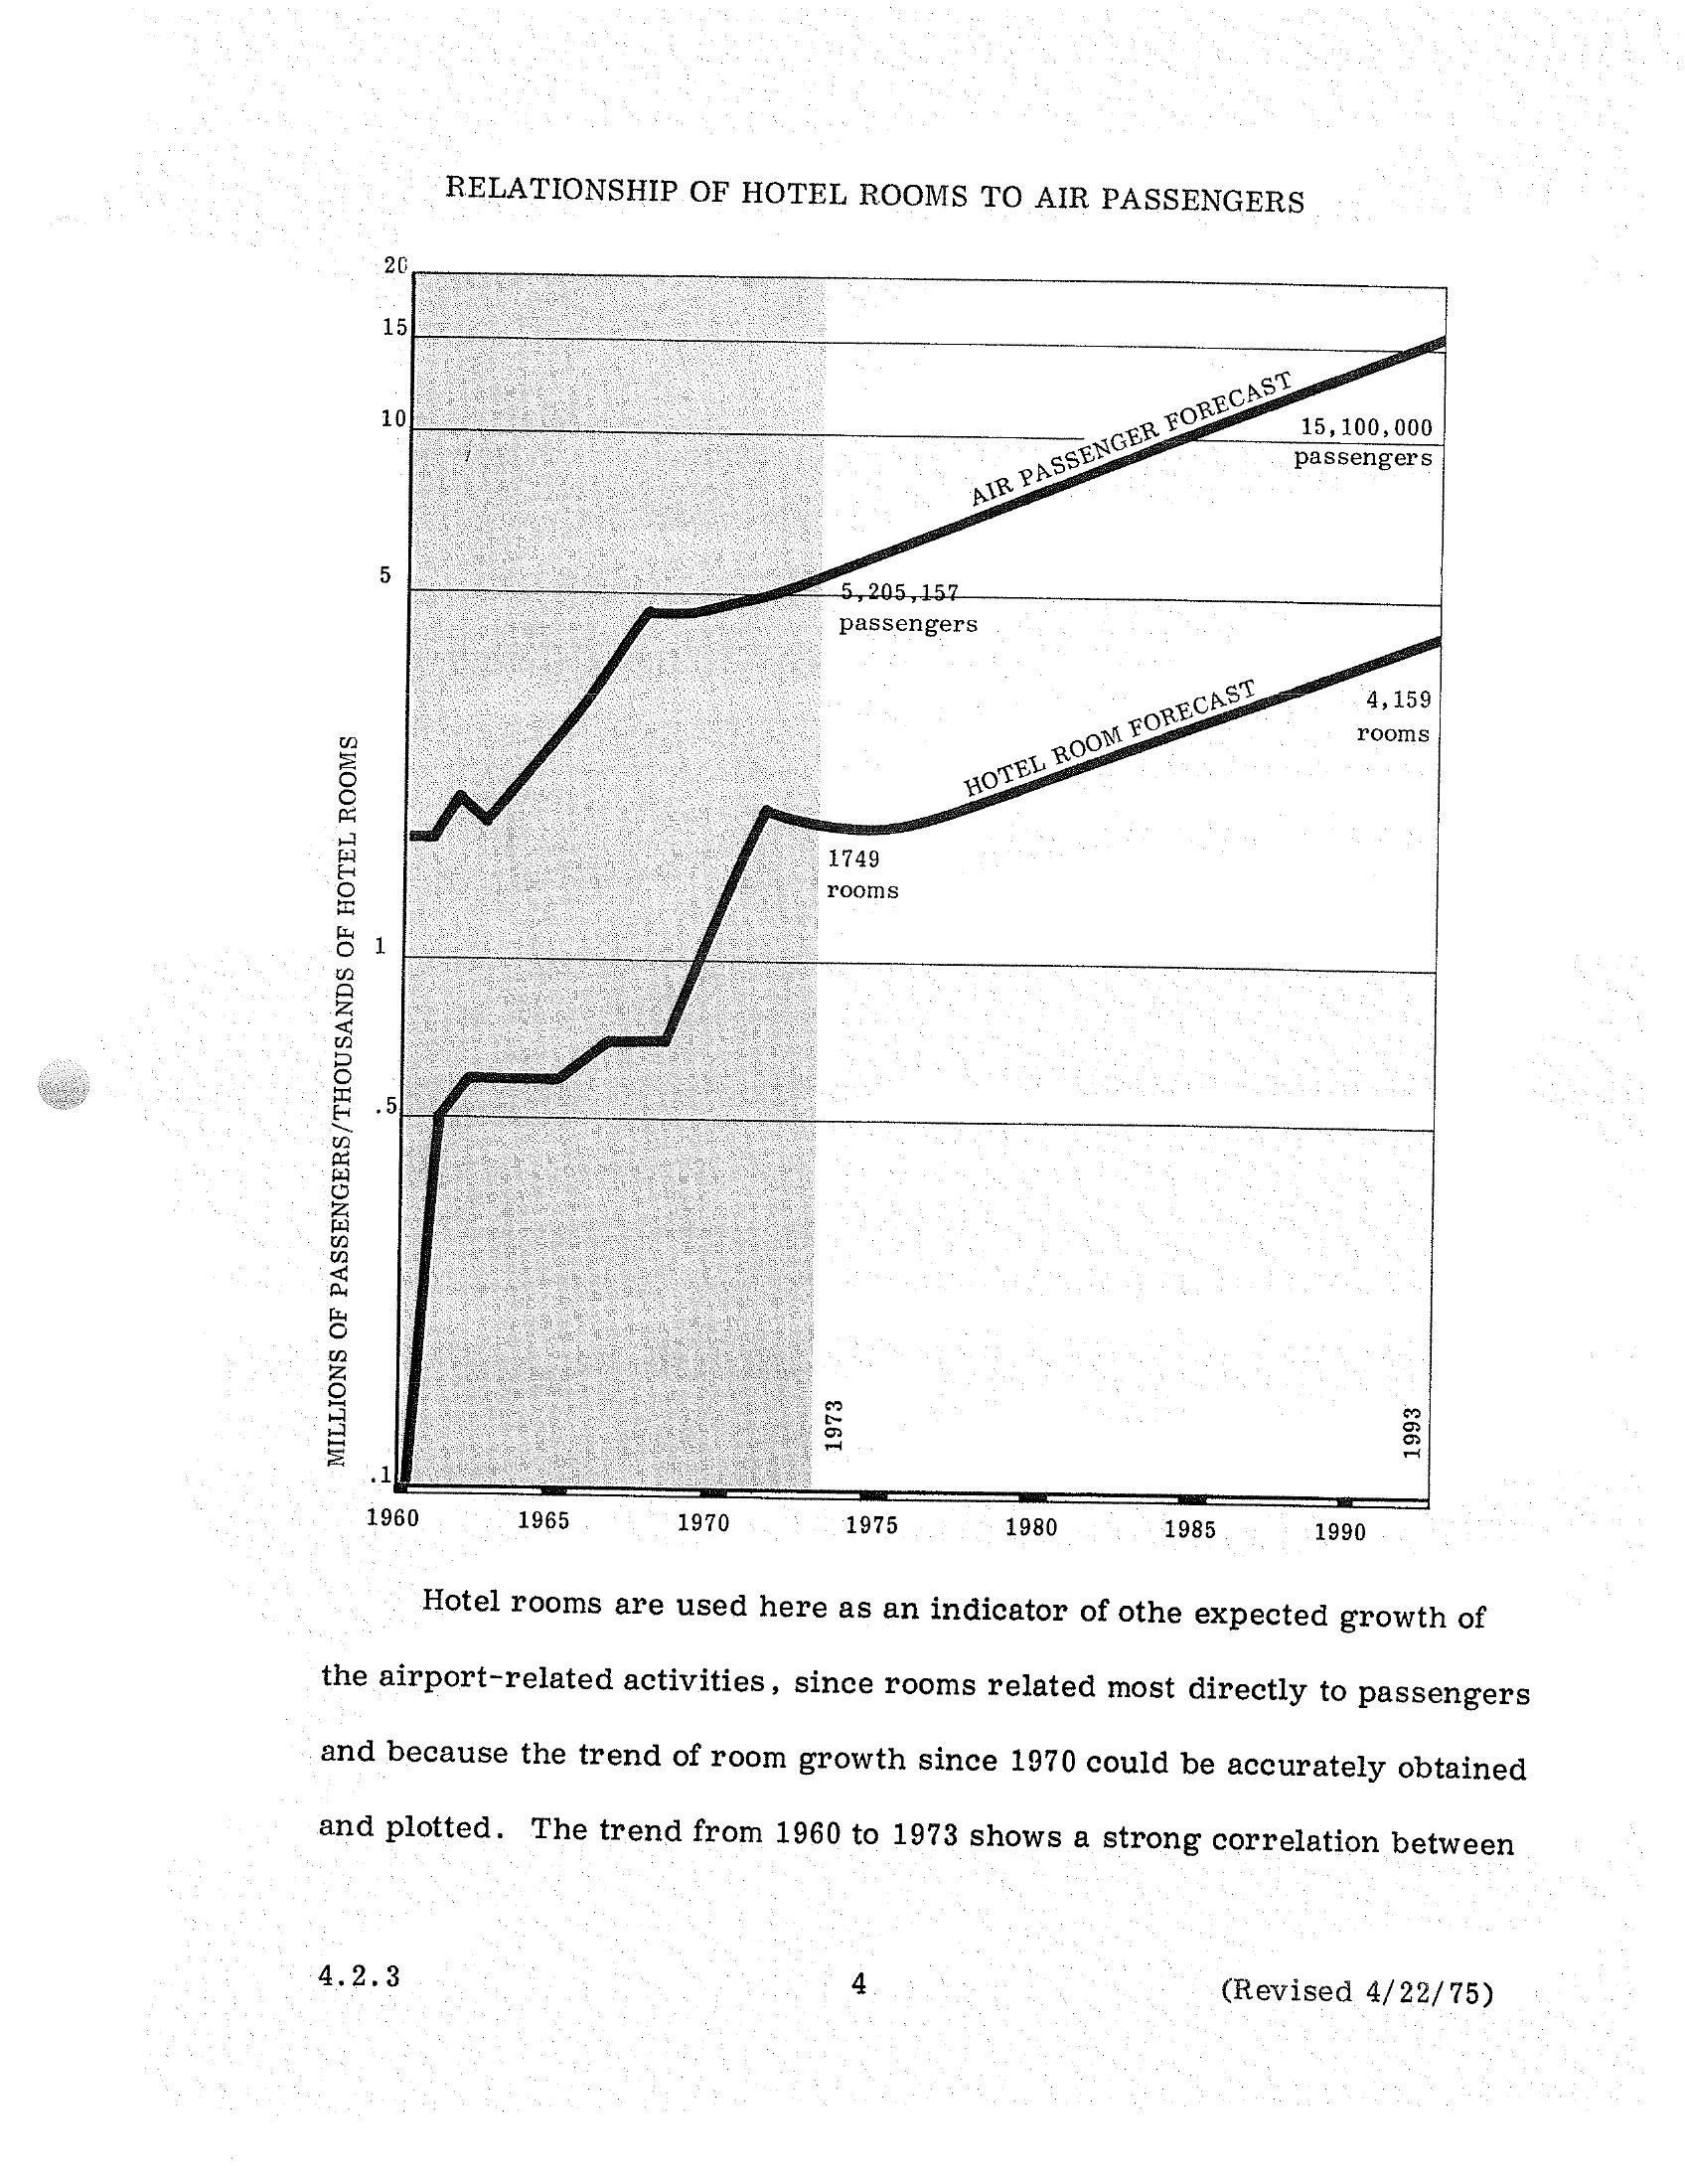
Sea-Tac Airport STCP Section 4.2.3: Air Passengers vs. Hotel Rooms Forecast, 1960–1993
A dual-axis chart from a Sea-Tac Airport planning document (revised April 22, 1975, section 4.2.3) plotting historical and forecast air passenger volumes against hotel room counts from 1960 to 1993. The chart projects growth from 5,205,157 passengers and 1,749 hotel rooms in 1973 to 15,100,000 passengers and 4,159 rooms by 1993, using hotel room growth as an indicator of airport-related activity expansion. -
 1971-01-01
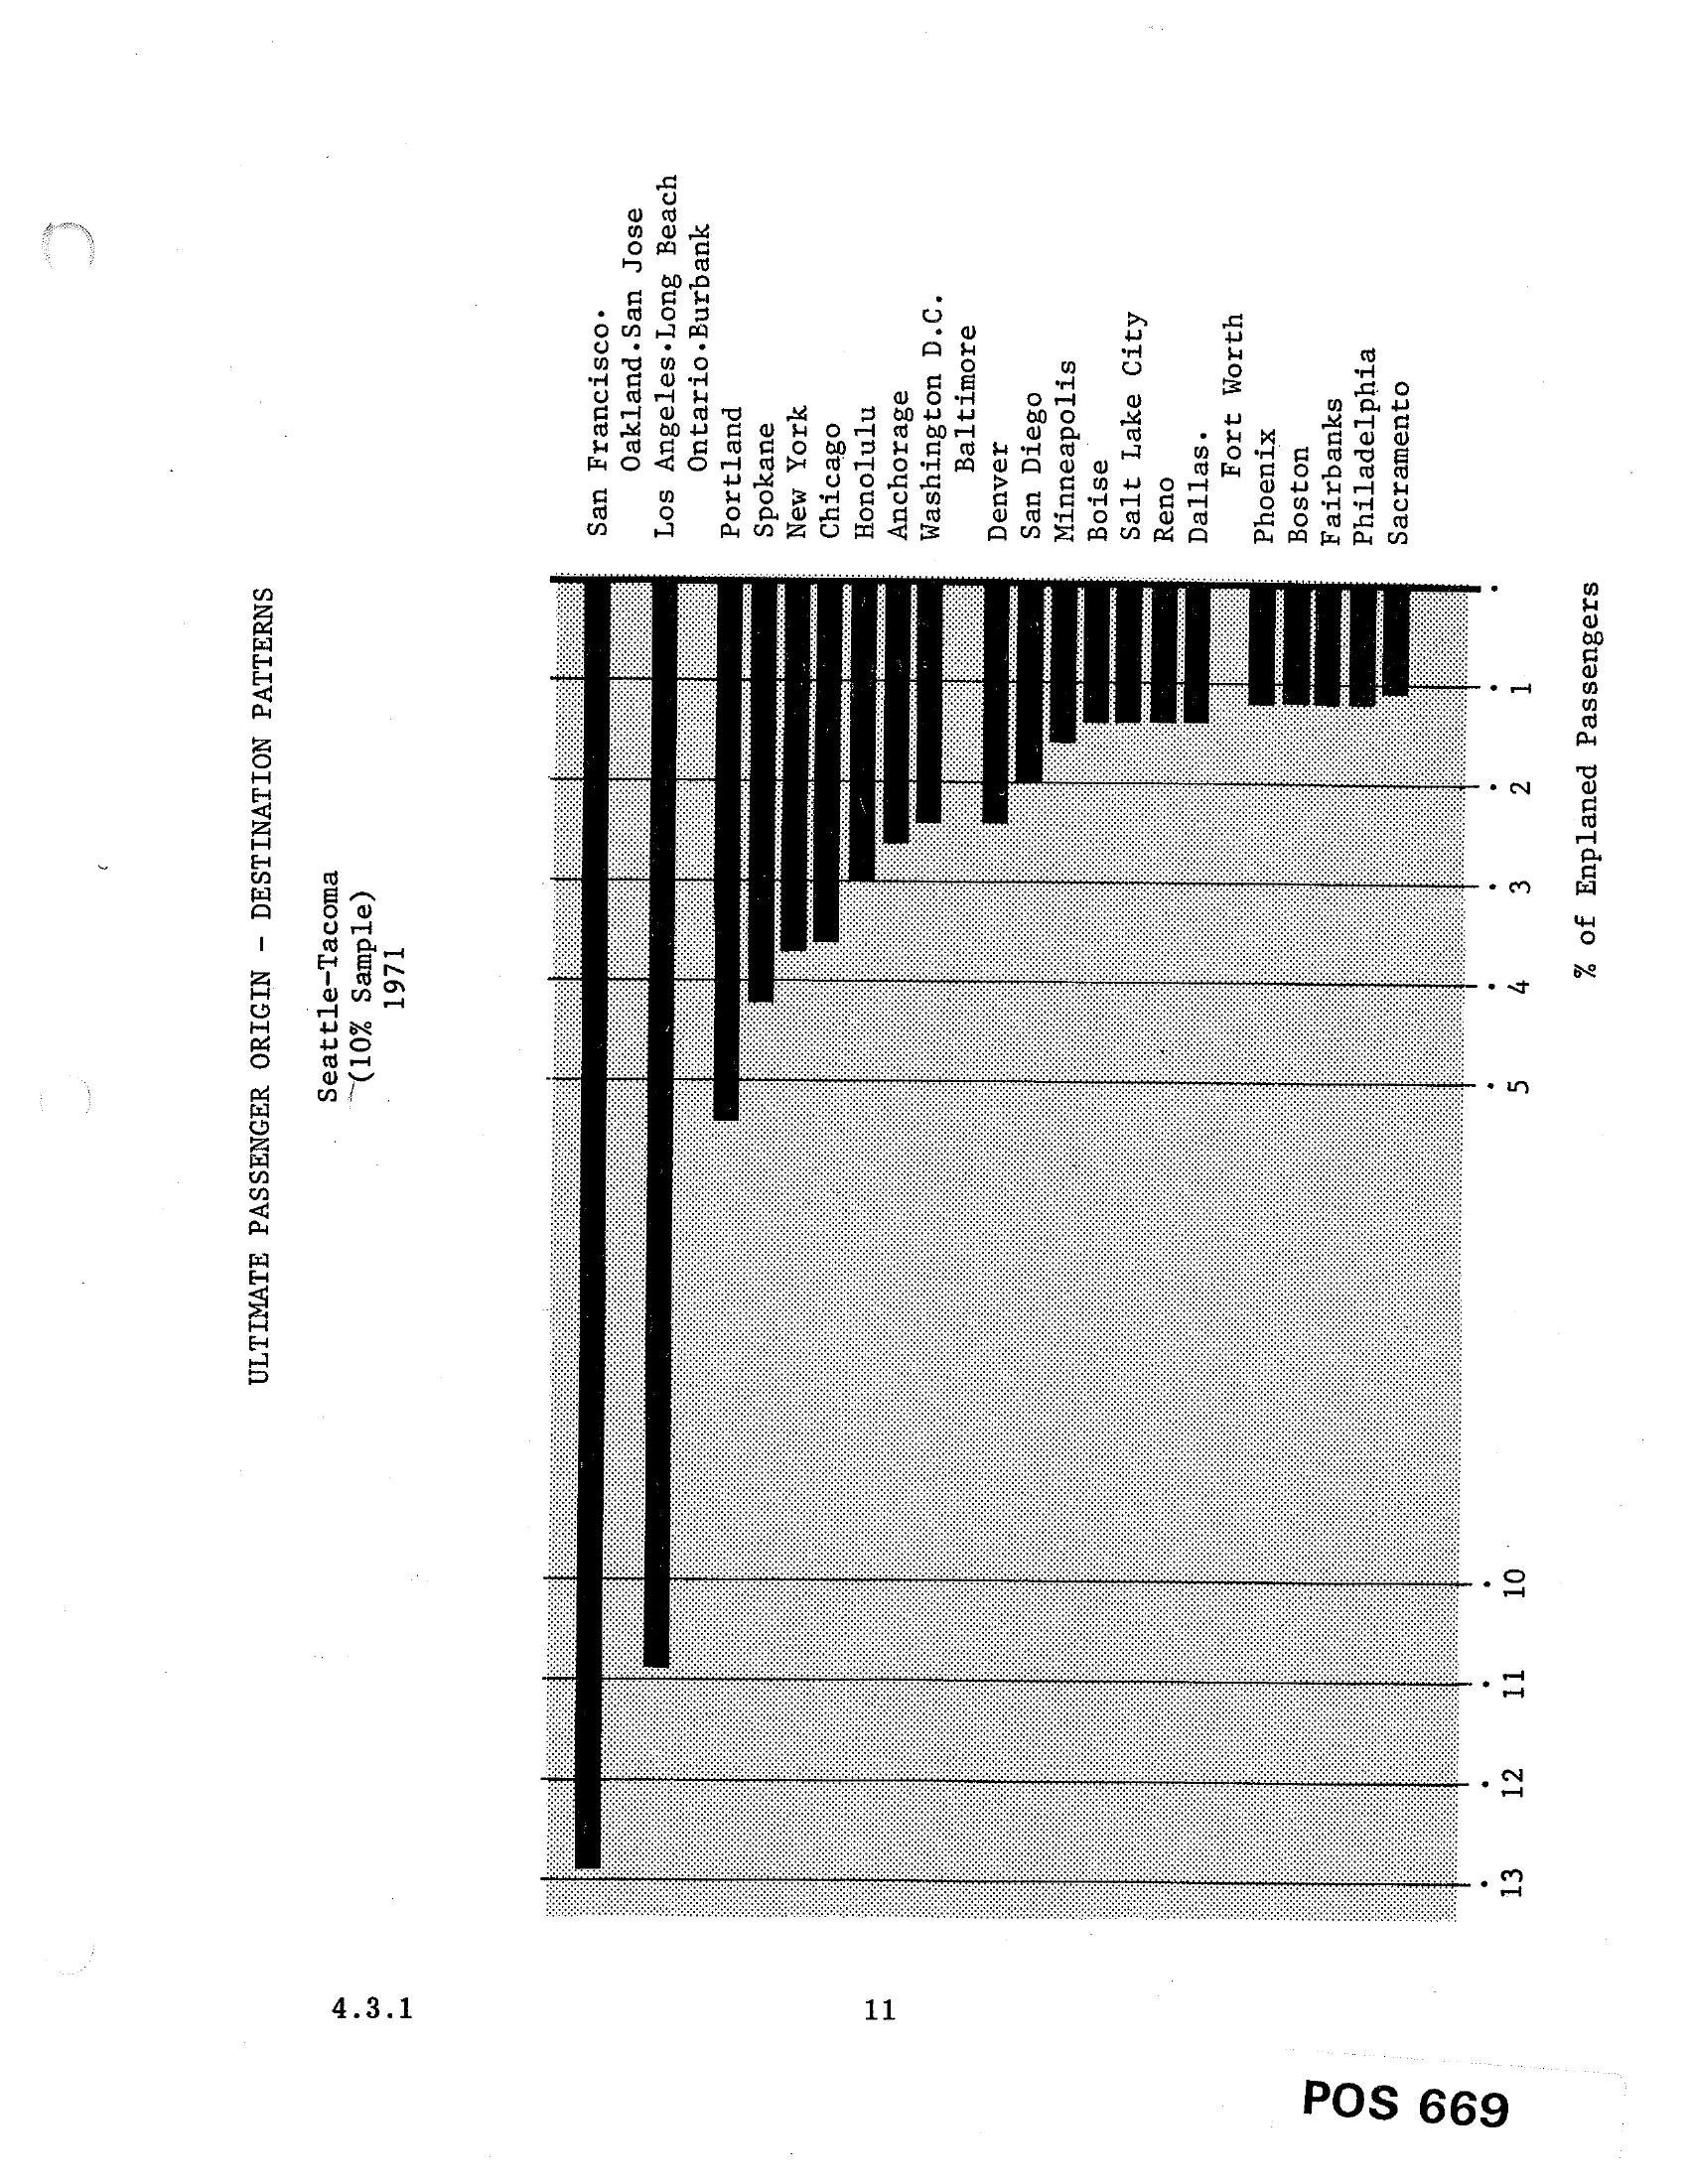
Sea-Tac Airport Passenger Origin-Destination Patterns Bar Chart (1971)
A horizontal bar chart from document POS 669 (section 4.3.1) showing the ultimate passenger origin-destination patterns for Seattle-Tacoma airport based on a 10% sample from 1971. The chart ranks destinations by percentage of enplaned passengers, with San Francisco leading at approximately 13%, followed by Oakland/San Jose, Los Angeles/Long Beach, and other cities including Honolulu, Chicago, New York, and Washington D.C.