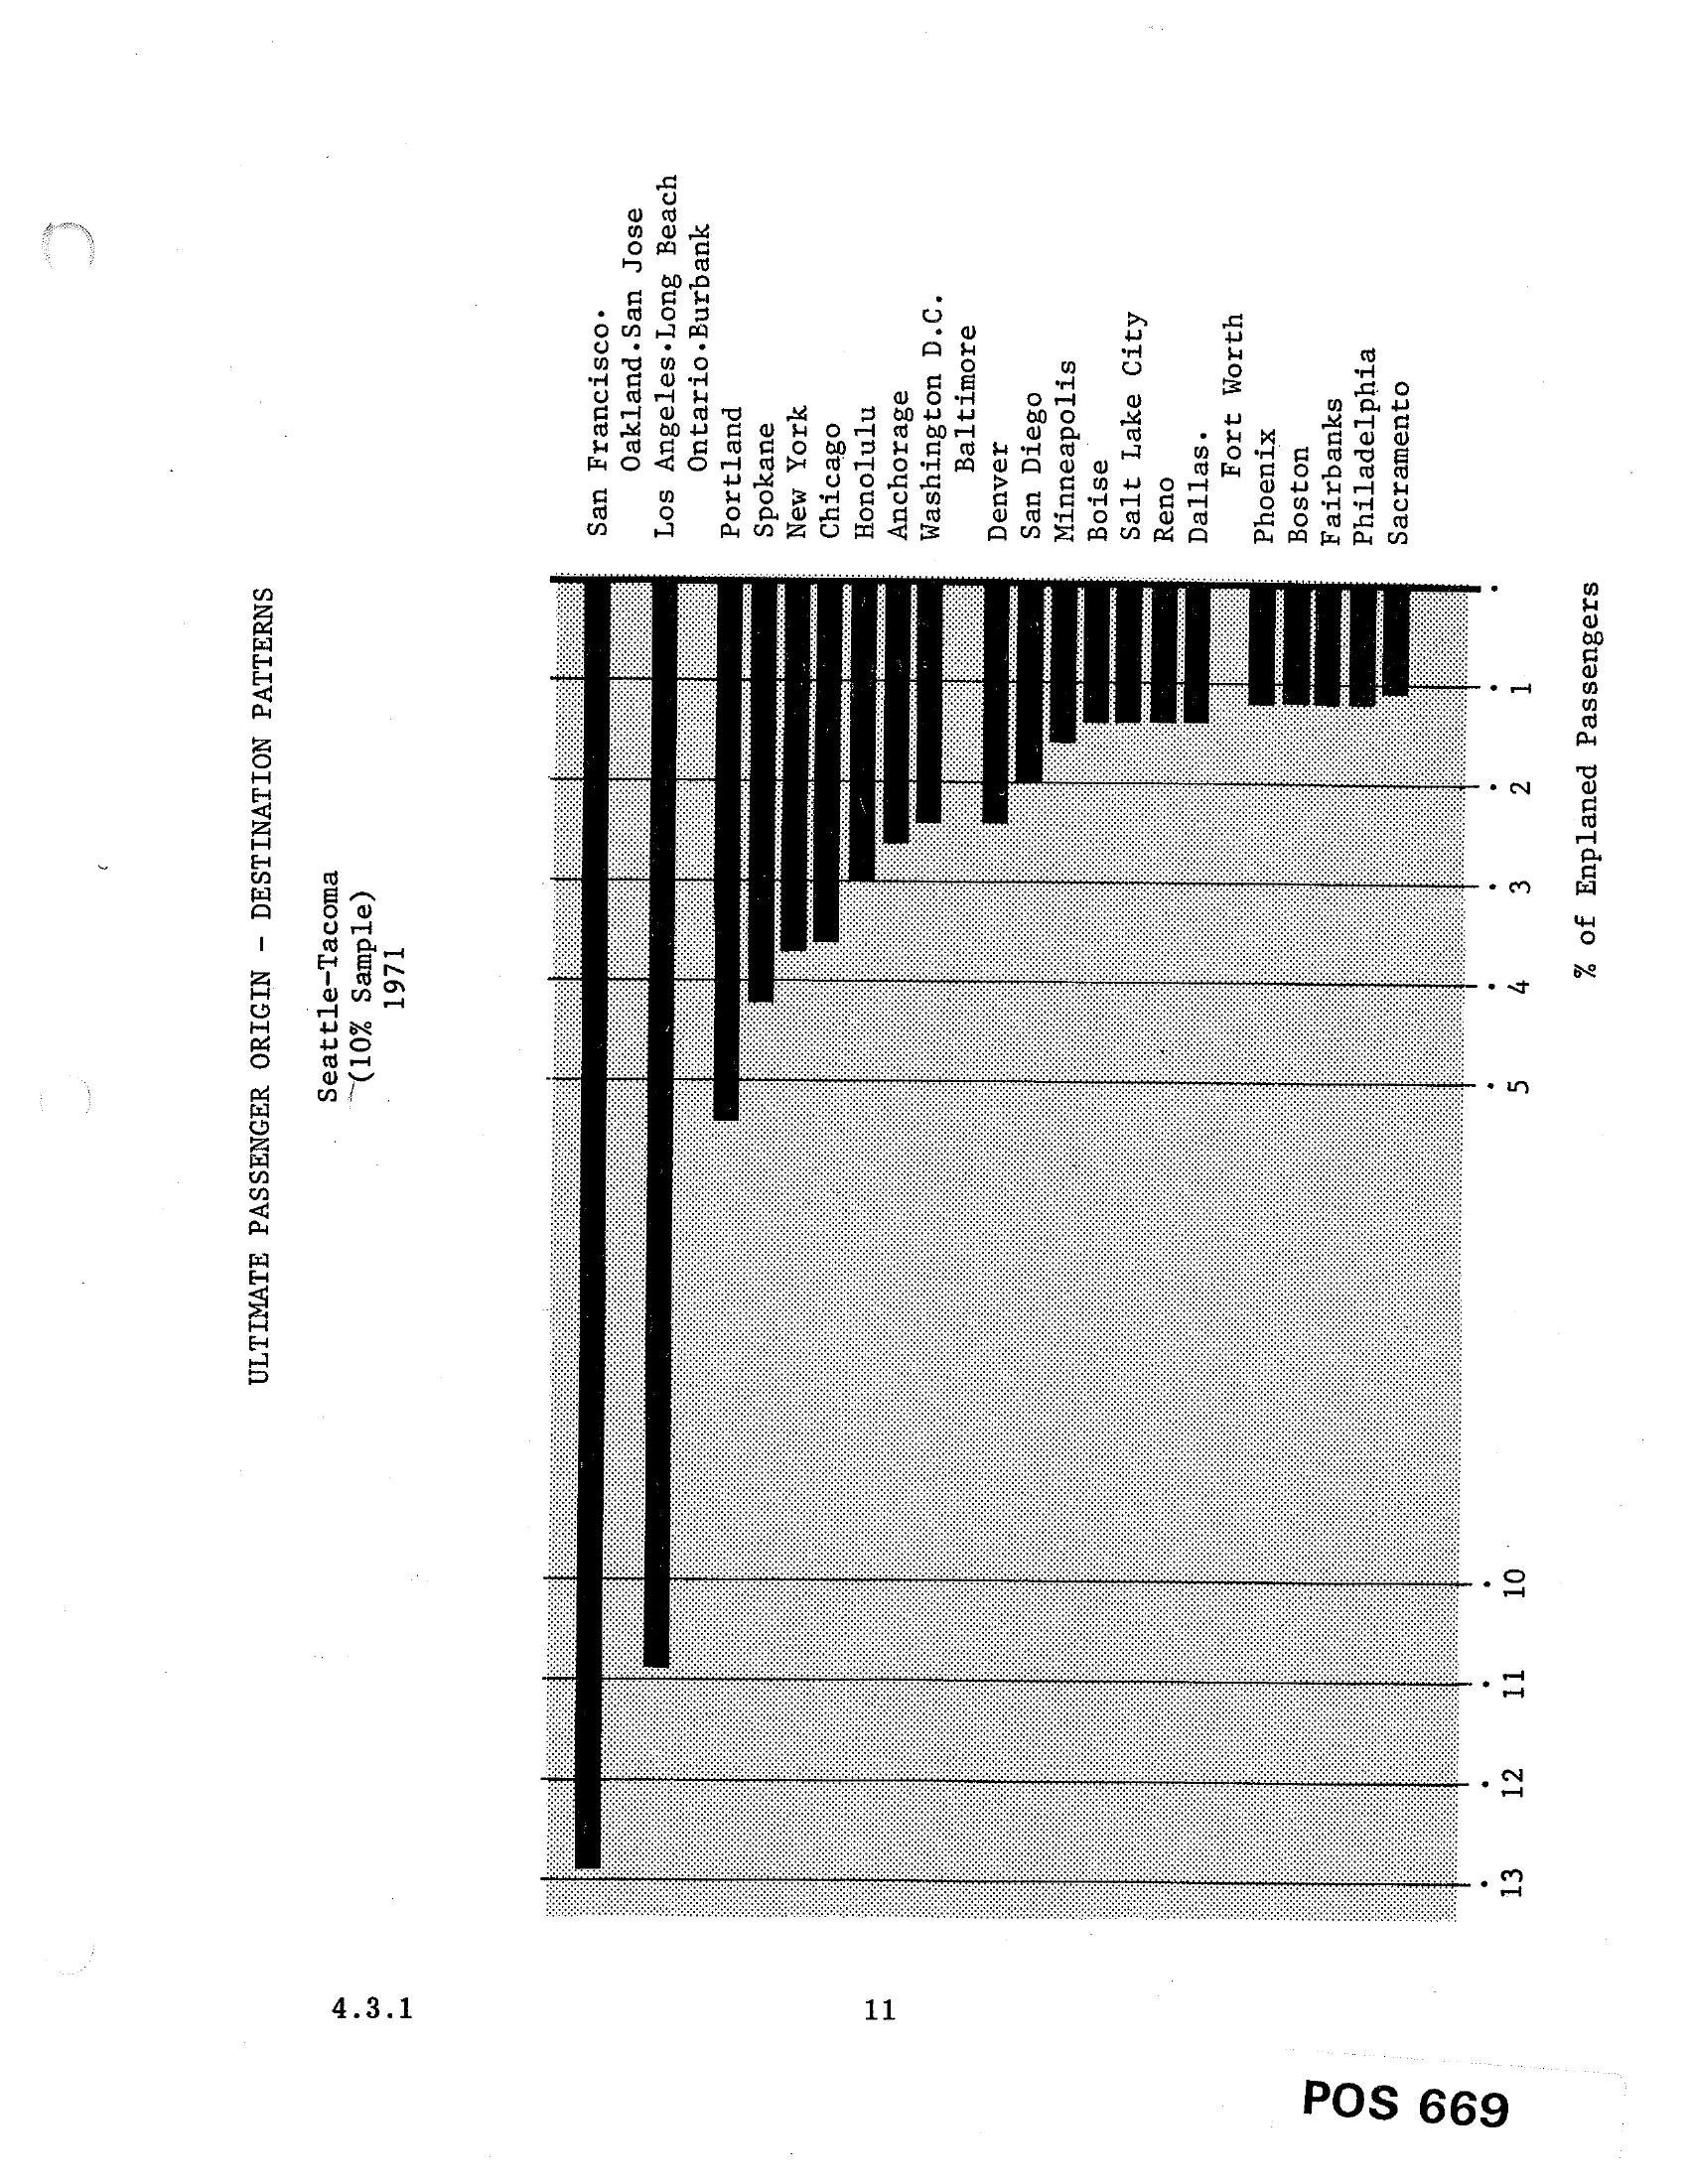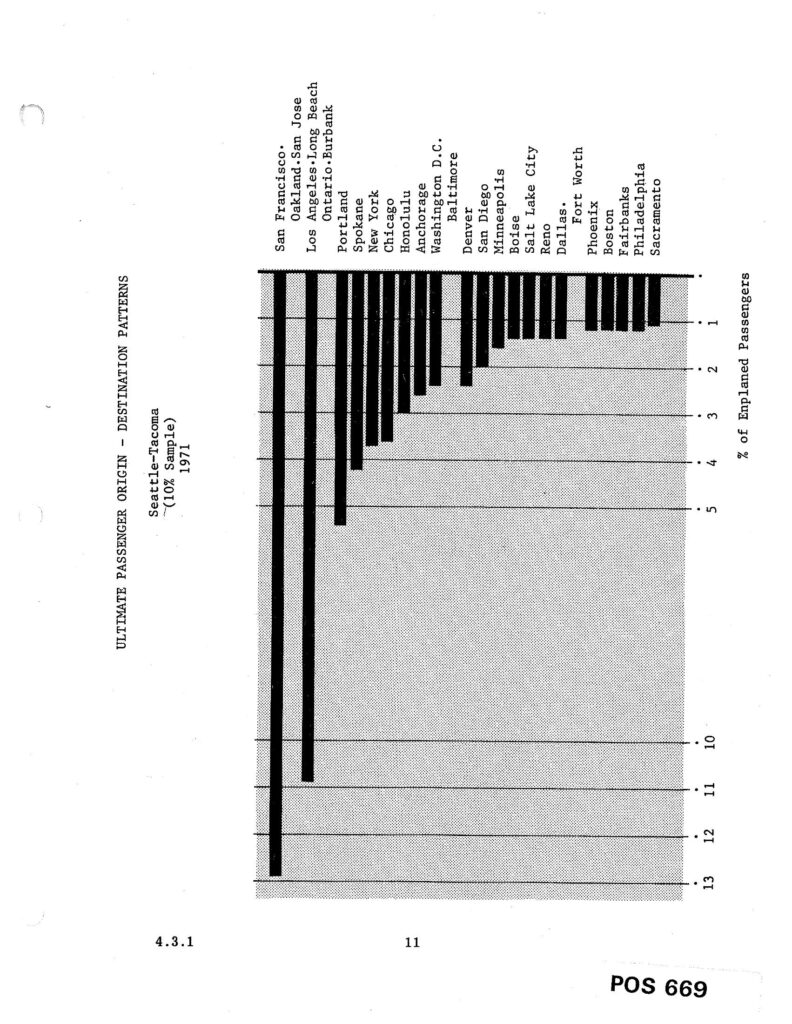
A horizontal bar chart from document POS 669 (section 4.3.1) showing the ultimate passenger origin-destination patterns for Seattle-Tacoma airport based on a 10% sample from 1971. The chart ranks destinations by percentage of enplaned passengers, with San Francisco leading at approximately 13%, followed by Oakland/San Jose, Los Angeles/Long Beach, and other cities including Honolulu, Chicago, New York, and Washington D.C.Open full document
Notes
A horizontal bar chart from document POS 669 (section 4.3.1) showing the ultimate passenger origin-destination patterns for Seattle-Tacoma airport based on a 10% sample from 1971. The chart ranks destinations by percentage of enplaned passengers, with San Francisco leading at approximately 13%, followed by Oakland/San Jose, Los Angeles/Long Beach, and other cities including Honolulu, Chicago, New York, and Washington D.C.