TagForecast(44)
-
 2025-08-12
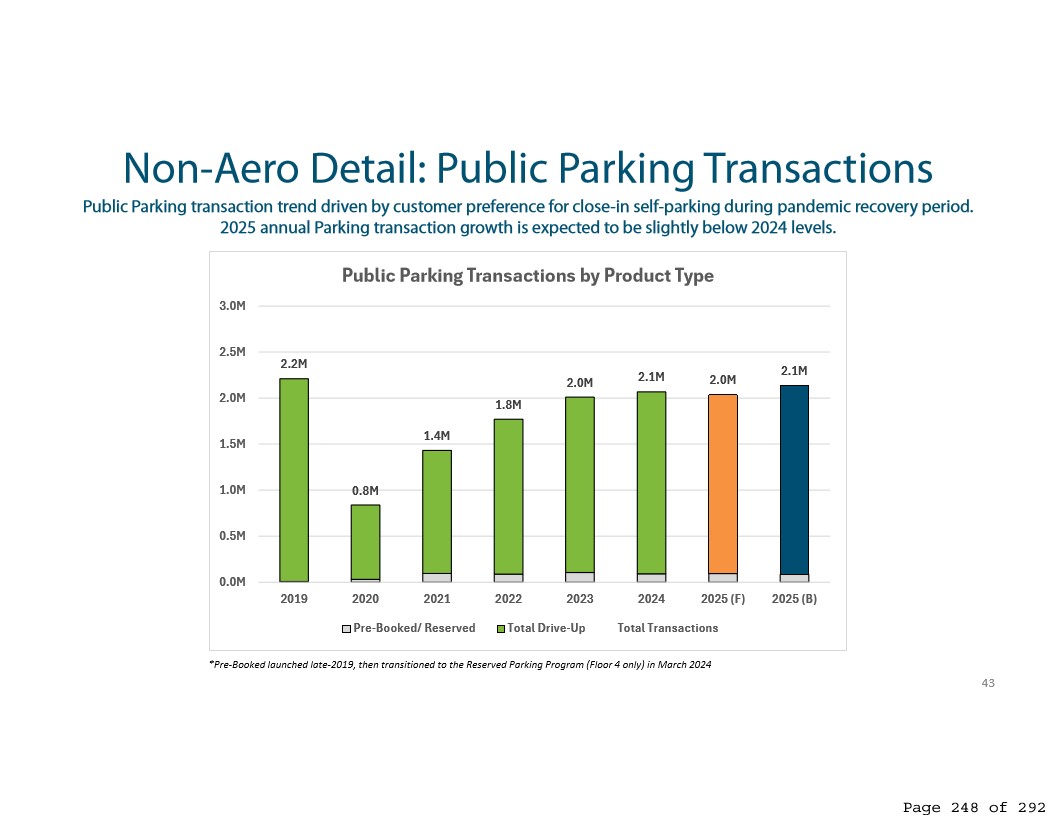
Sea-Tac Airport Public Parking Transactions by Category, 2019–2025 Forecast and Budget — RM Packet Page 248
This slide (page 248 of 292) presents public parking transaction data at Seattle-Tacoma International Airport broken down by Pre-Booked/Reserved and Total Drive-Up categories from 2019 through 2025 forecast and budget projections. Transactions dropped to 0.8M in 2020 during the pandemic, recovered to 2.1M by 2024, with 2025 annual growth expected to be slightly below 2024 levels. -
 2025-04-22
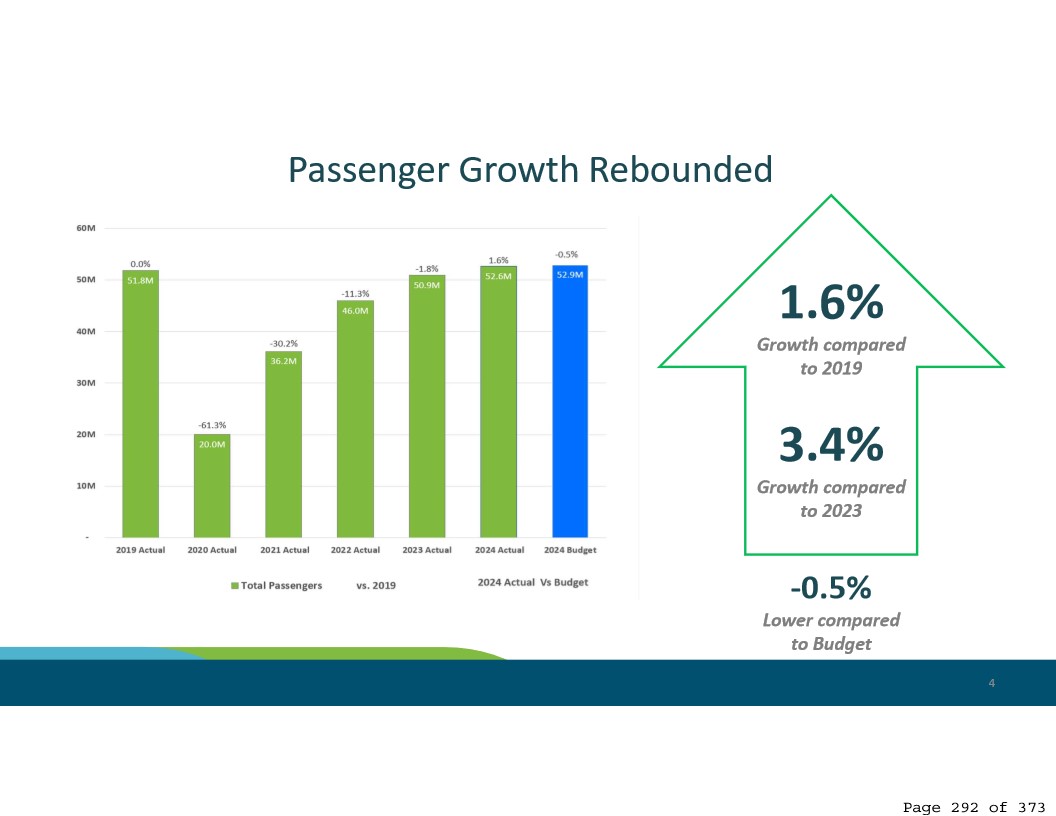
Sea-Tac Airport Passenger Growth Rebounded — 2024 Actuals vs. Budget (Page 292)
A presentation slide titled 'Passenger Growth Rebounded' showing total passenger figures from 2019 through 2024 for what is identified as Sea-Tac Airport (page 292 of 373). The 2024 actual passenger count was 52.6M, representing 1.6% growth compared to 2019 and 3.4% growth compared to 2023, but 0.5% below the 2024 budget of 52.9M. -
 2025-01-01
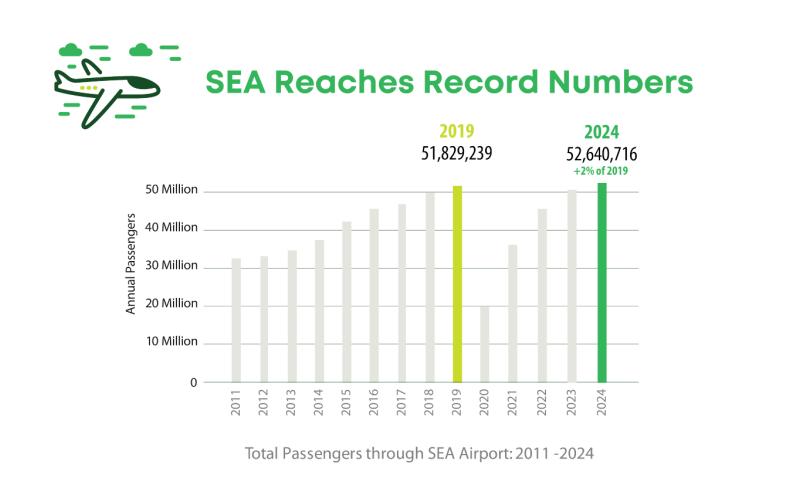
StART Update-2025 SEA Reaches Record Passenger Numbers 2019 v 2024
Bar chart published by Seattle-Tacoma International Airport (SEA) showing annual passenger counts from 2011 to 2024. The 2024 total of 52,640,716 passengers surpassed the previous record of 51,829,239 set in 2019, representing a 2% increase over the pre-pandemic peak. -

Appendix A Table 4-1 Operational Forecast
Figure 4-1 from a Seattle-Tacoma International Airport planning document shows historical and forecast total aircraft operations (in thousands) from 2011 to 2038, broken down by passenger airlines, all-cargo airlines, and other operations. The forecast, sourced from LeighFisher (June 2022, updated August 2023), projects growth from 429,000 operations in 2023 to 567,000 by 2038. -
 2024-10-08
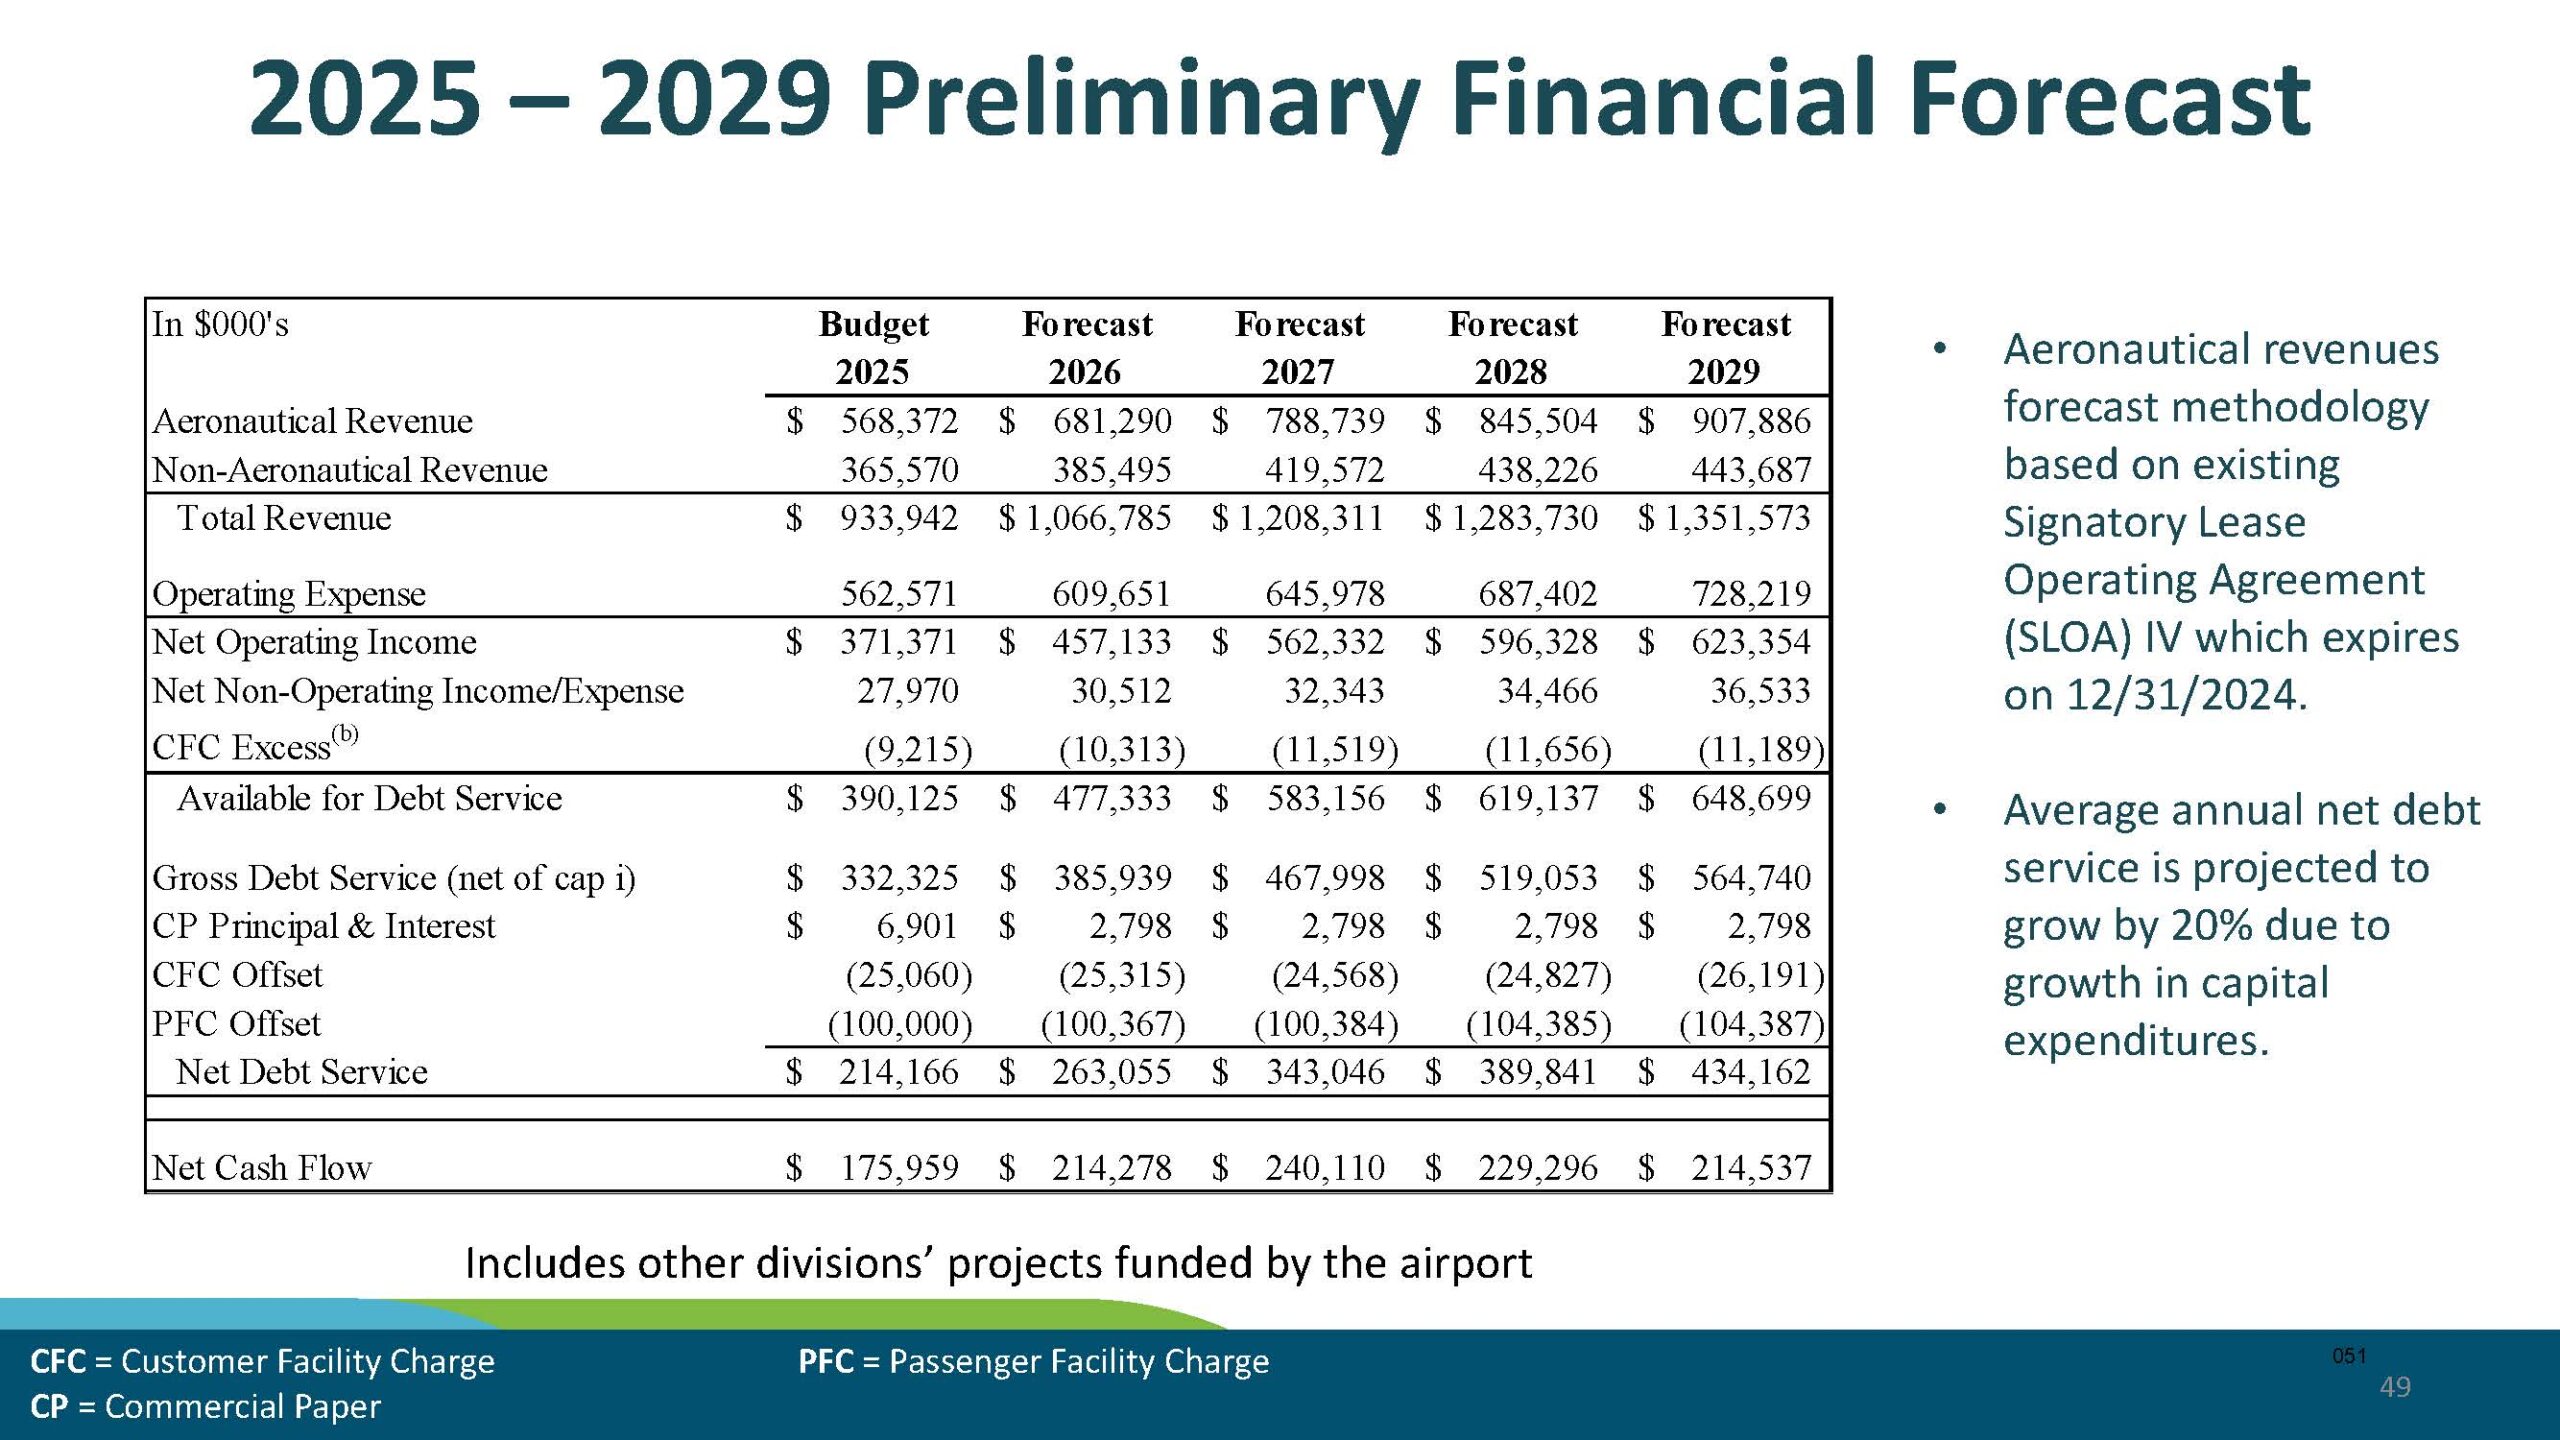
Sea-Tac Airport Aviation & Marina Budget Presentation — Financial Forecast 2025–2029 (Page 51)
A financial forecast slide for Seattle-Tacoma International Airport covering budget year 2025 and forecast years 2026–2029, showing aeronautical and non-aeronautical revenues, operating expenses, debt service, and net cash flow in thousands of dollars. Notes indicate the aeronautical revenue methodology is based on the Signatory Lease Operating Agreement (SLOA) IV expiring 12/31/2024, and average annual net debt service is projected to grow by 20% due to capital expenditure growth. -
 2024-10-08
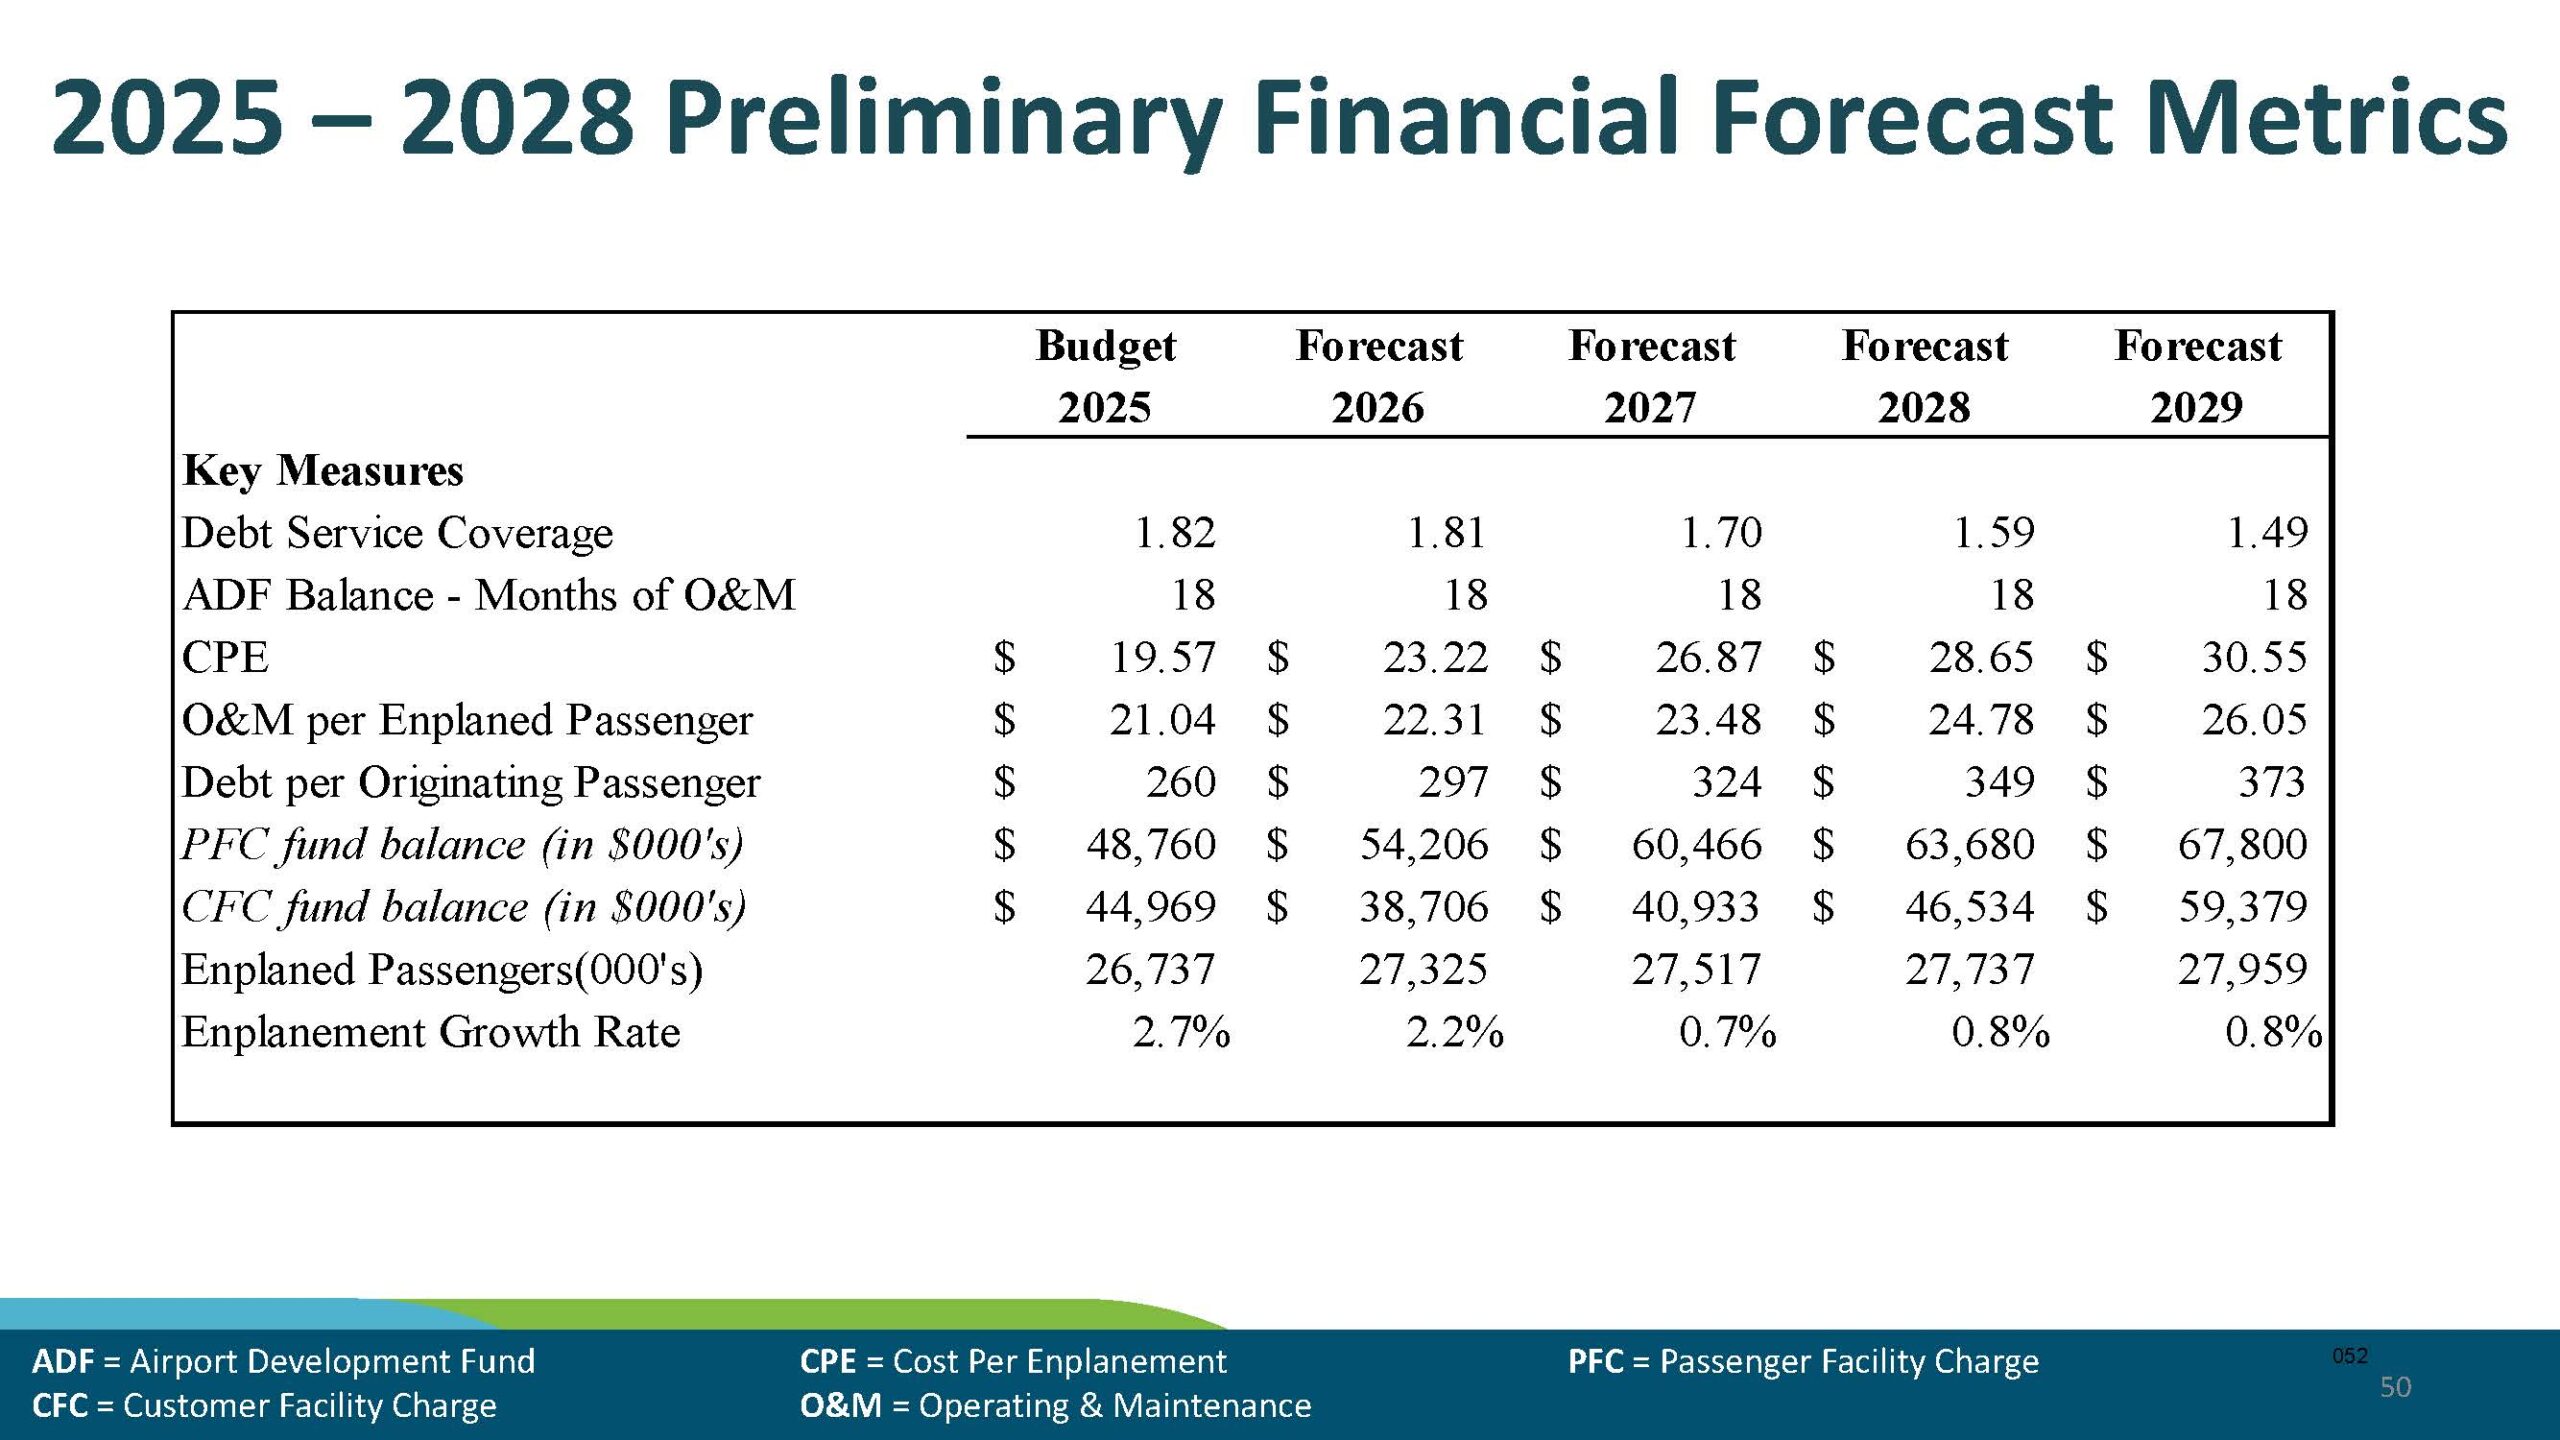
Sea-Tac Airport Financial Forecast Table: Budget 2025 Through 2029 — Debt Service Coverage, Cost Per Enplanement, and Passenger Projections (Page 52)
A financial forecast table from Seattle-Tacoma International Airport covering Budget 2025 through Forecast 2029, displaying key measures including Debt Service Coverage (declining from 1.82 to 1.49), Cost Per Enplanement (rising from $19.57 to $30.55), O&M per Enplaned Passenger, Debt per Originating Passenger, PFC and CFC fund balances, and enplaned passenger projections reaching approximately 27.9 million by 2029 with an enplanement growth rate of 0.8%. -
 2024-05-22
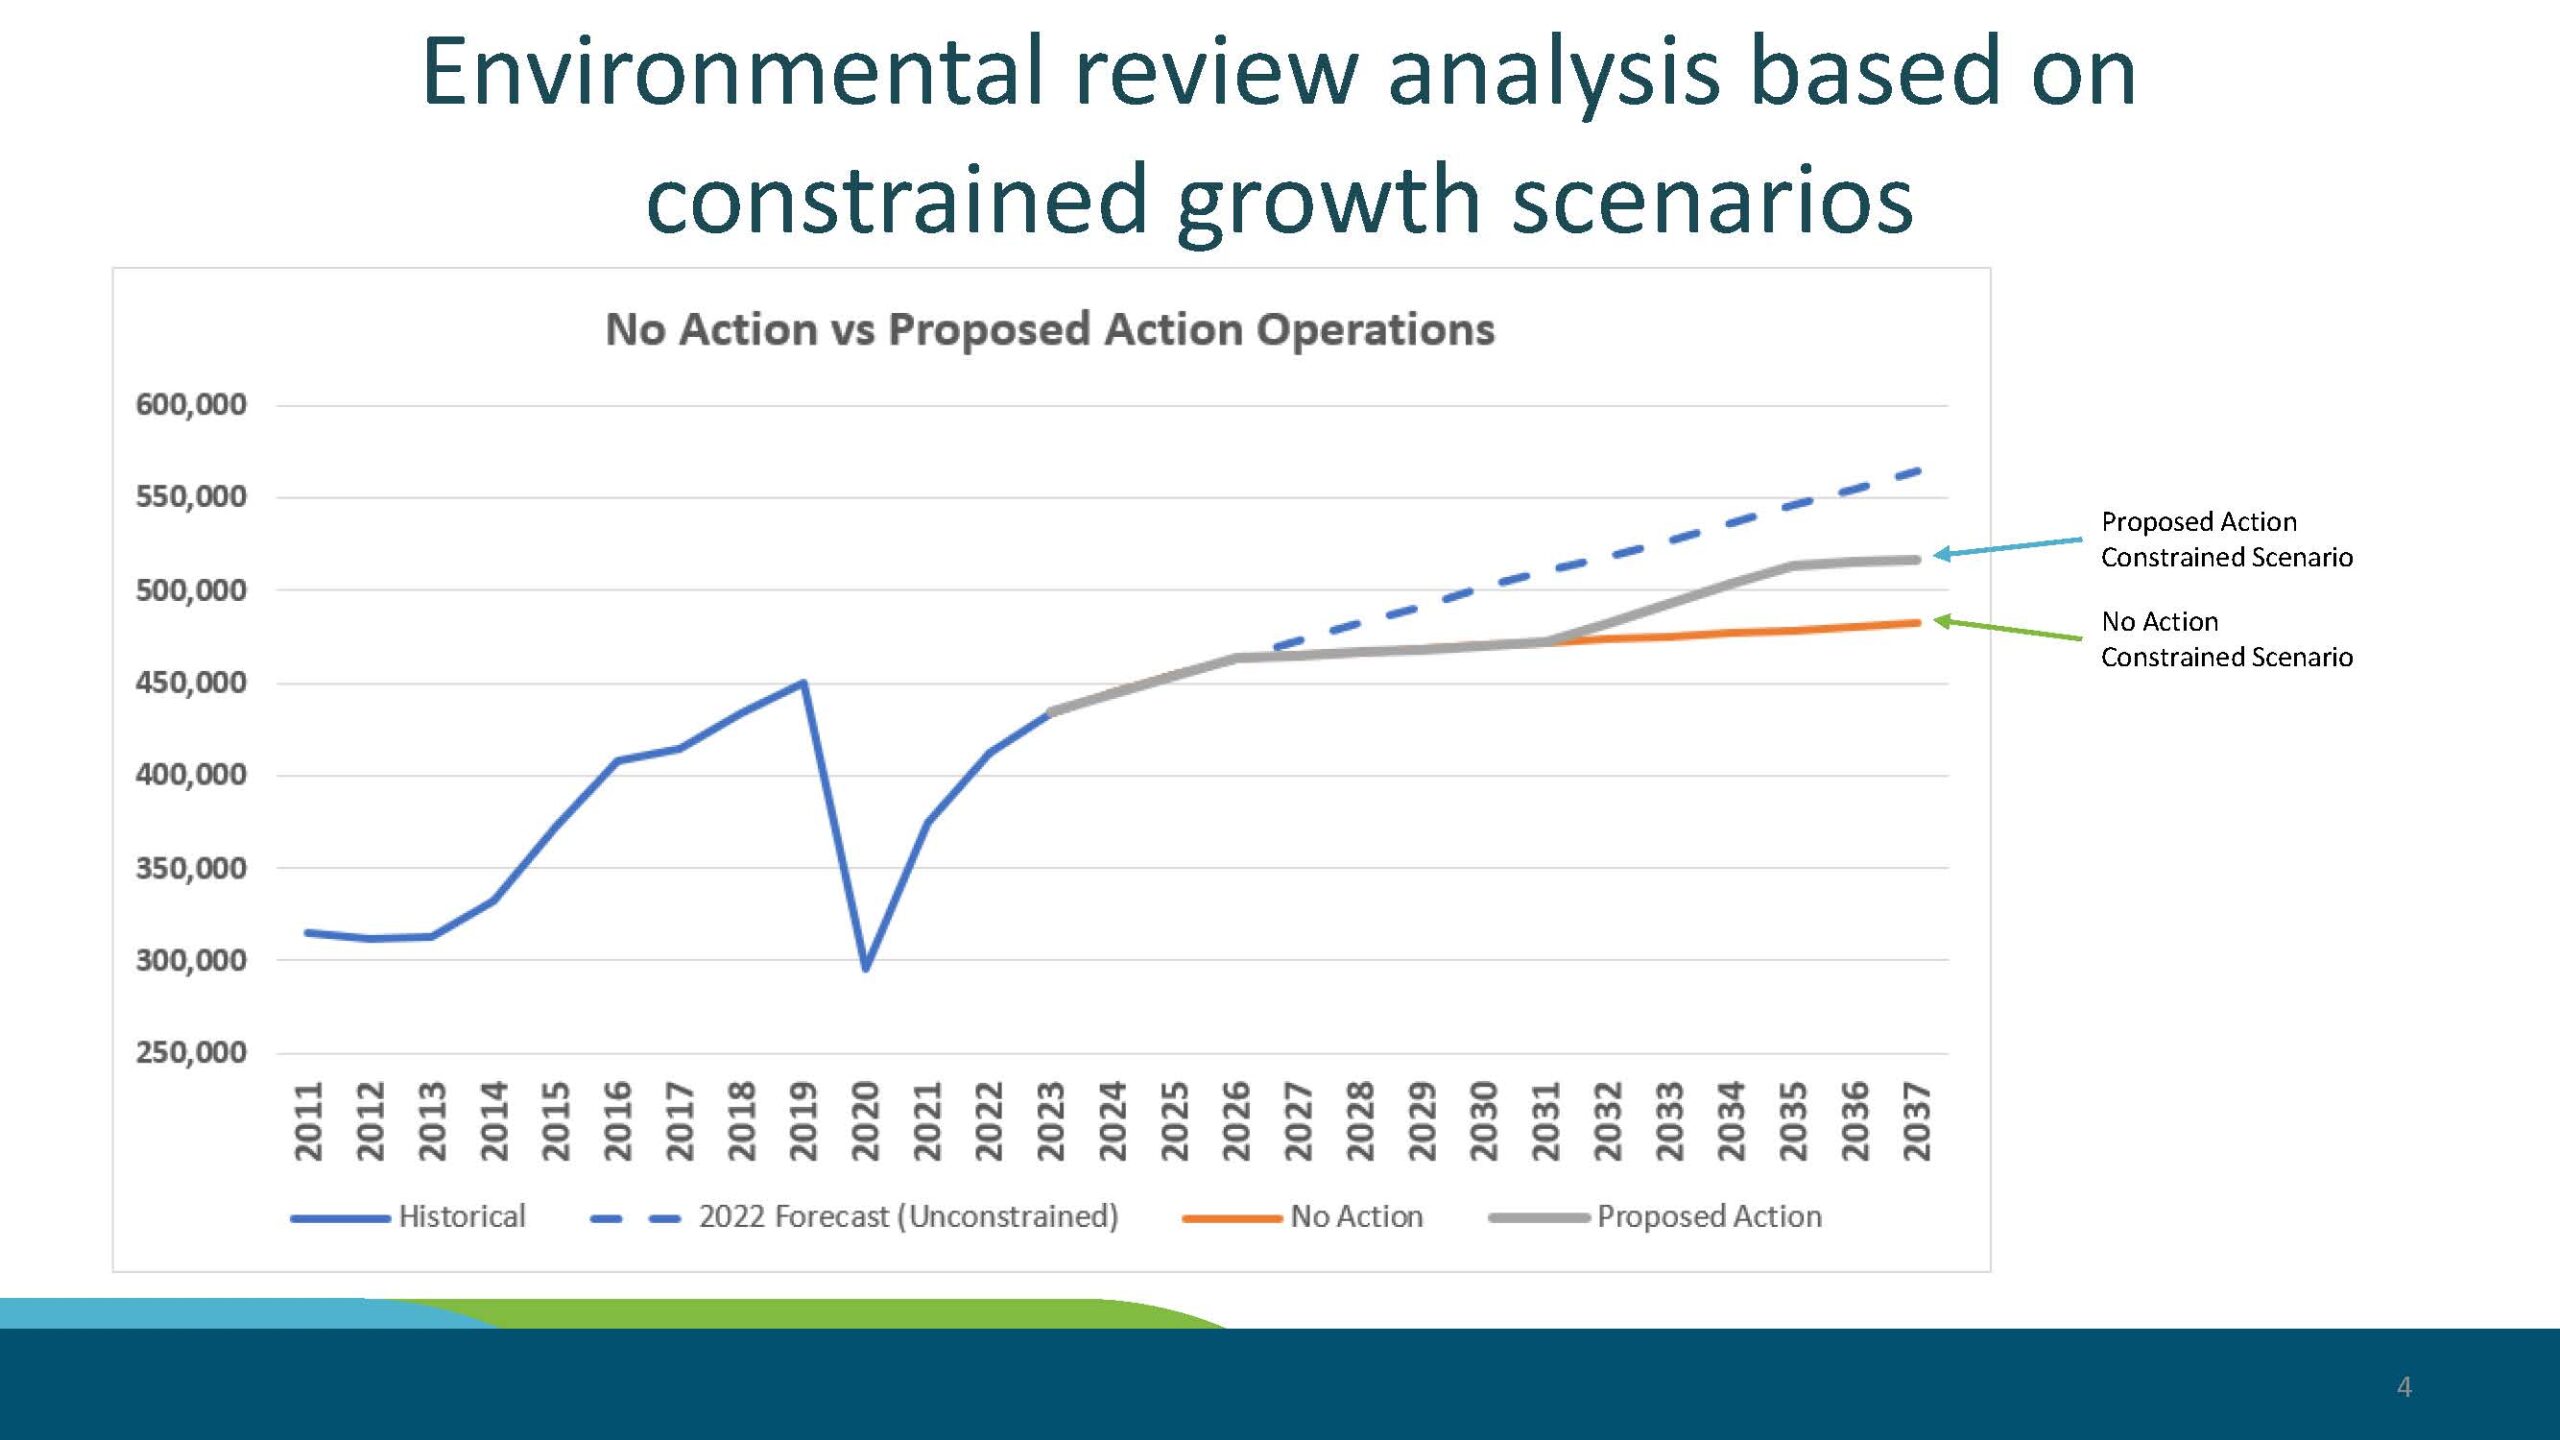
Highline Forum SAMP NTP Environmental Review Overview — Slide 4 (May 2024)
A presentation slide titled 'Environmental review analysis based on constrained growth scenarios' shows a line chart comparing historical operations data (2011–2020), a 2022 unconstrained forecast, and two constrained growth scenarios—No Action and Proposed Action—projected through 2037. The Proposed Action constrained scenario reaches approximately 515,000 operations by 2037, while the No Action constrained scenario plateaus near 480,000, both falling well below the unconstrained 2022 forecast of approximately 560,000. -
 2024-05-22
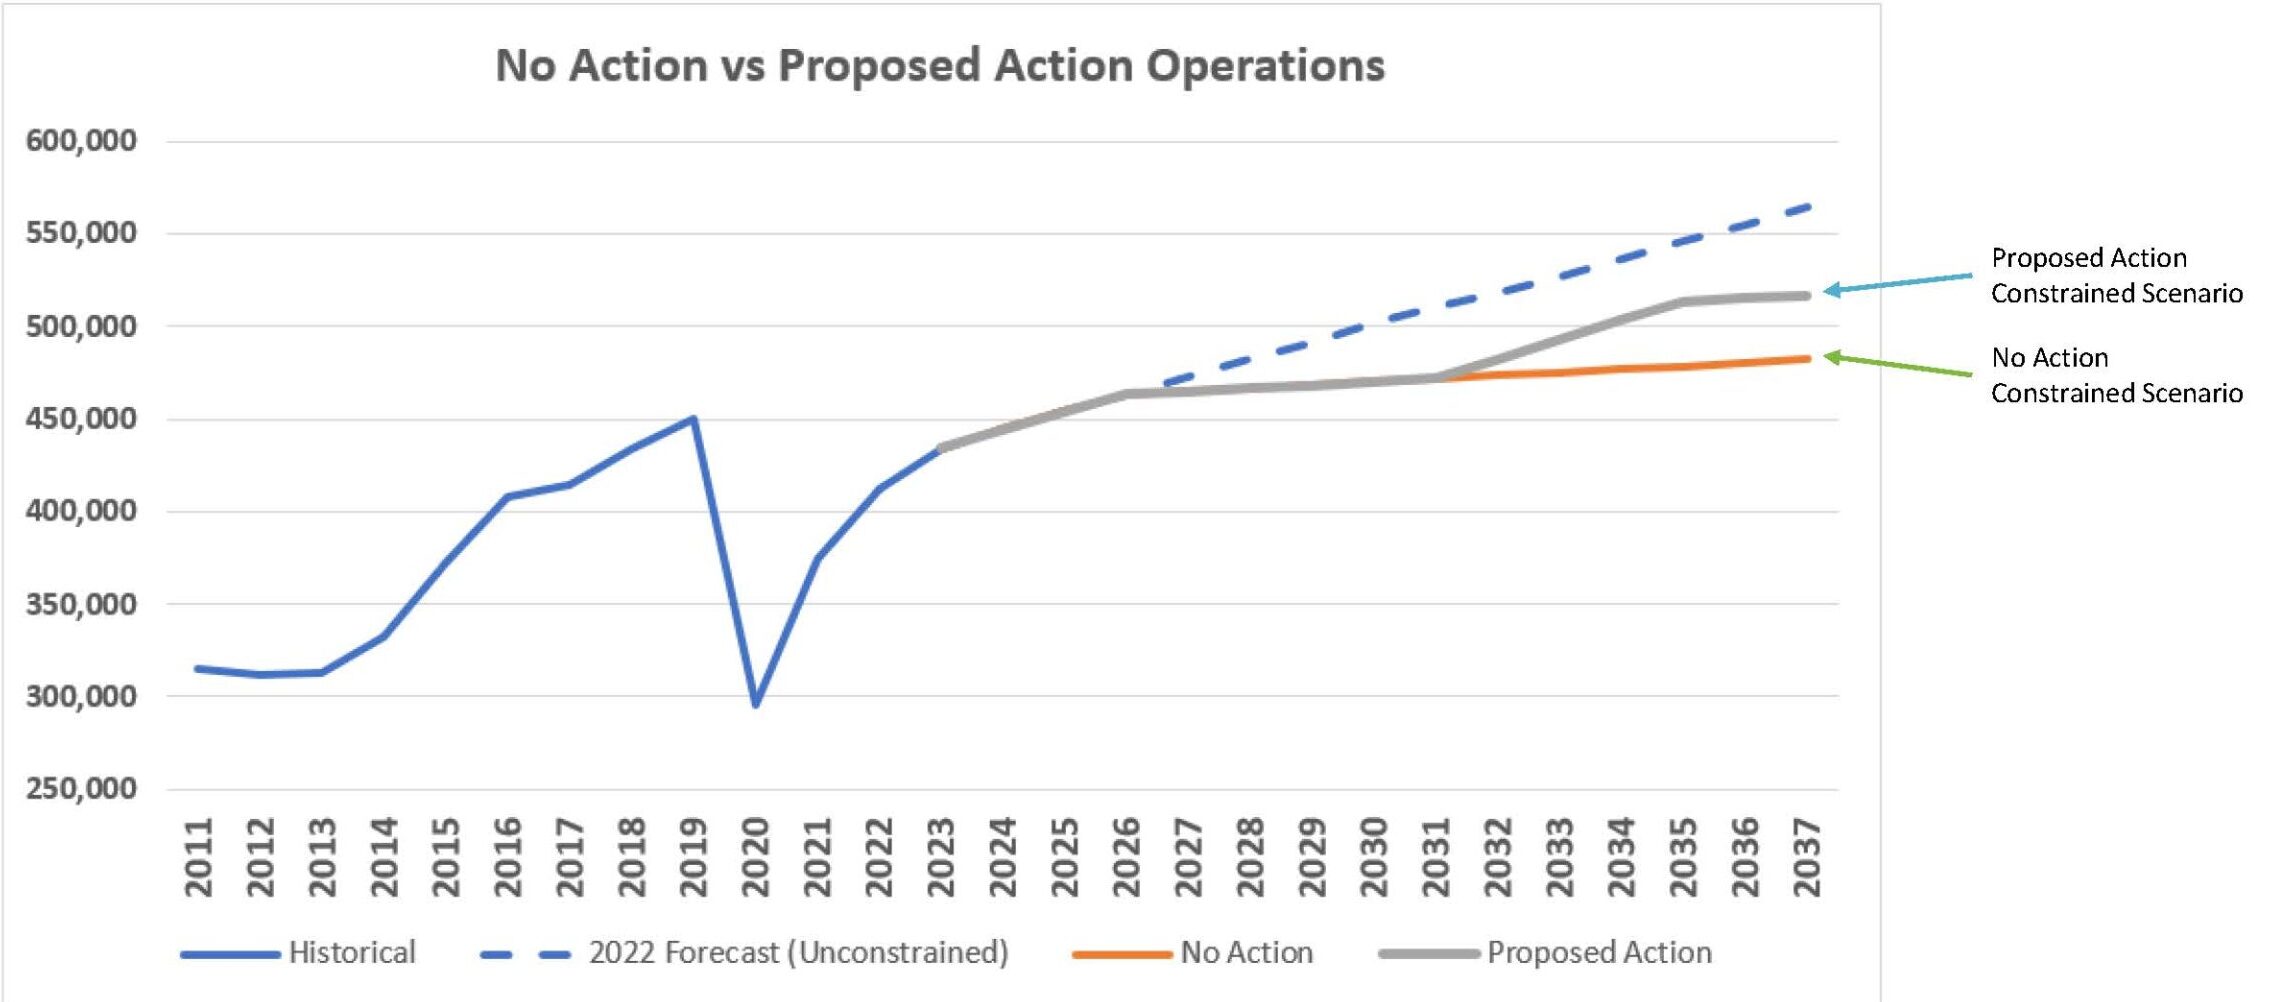
SAMP NTP Environmental Review Overview — Aircraft Operations Forecast Chart (Page 4), May 2024
A line graph comparing historical aircraft operations data (2011–2022) with forecast scenarios through 2037, including an unconstrained 2022 forecast, a No Action constrained scenario, and a Proposed Action constrained scenario. The chart shows operations declining sharply in 2020 (likely due to COVID-19) and recovering, with the Proposed Action scenario reaching approximately 520,000 operations and the No Action scenario capping near 485,000 operations by 2037. -
 2023-10-10
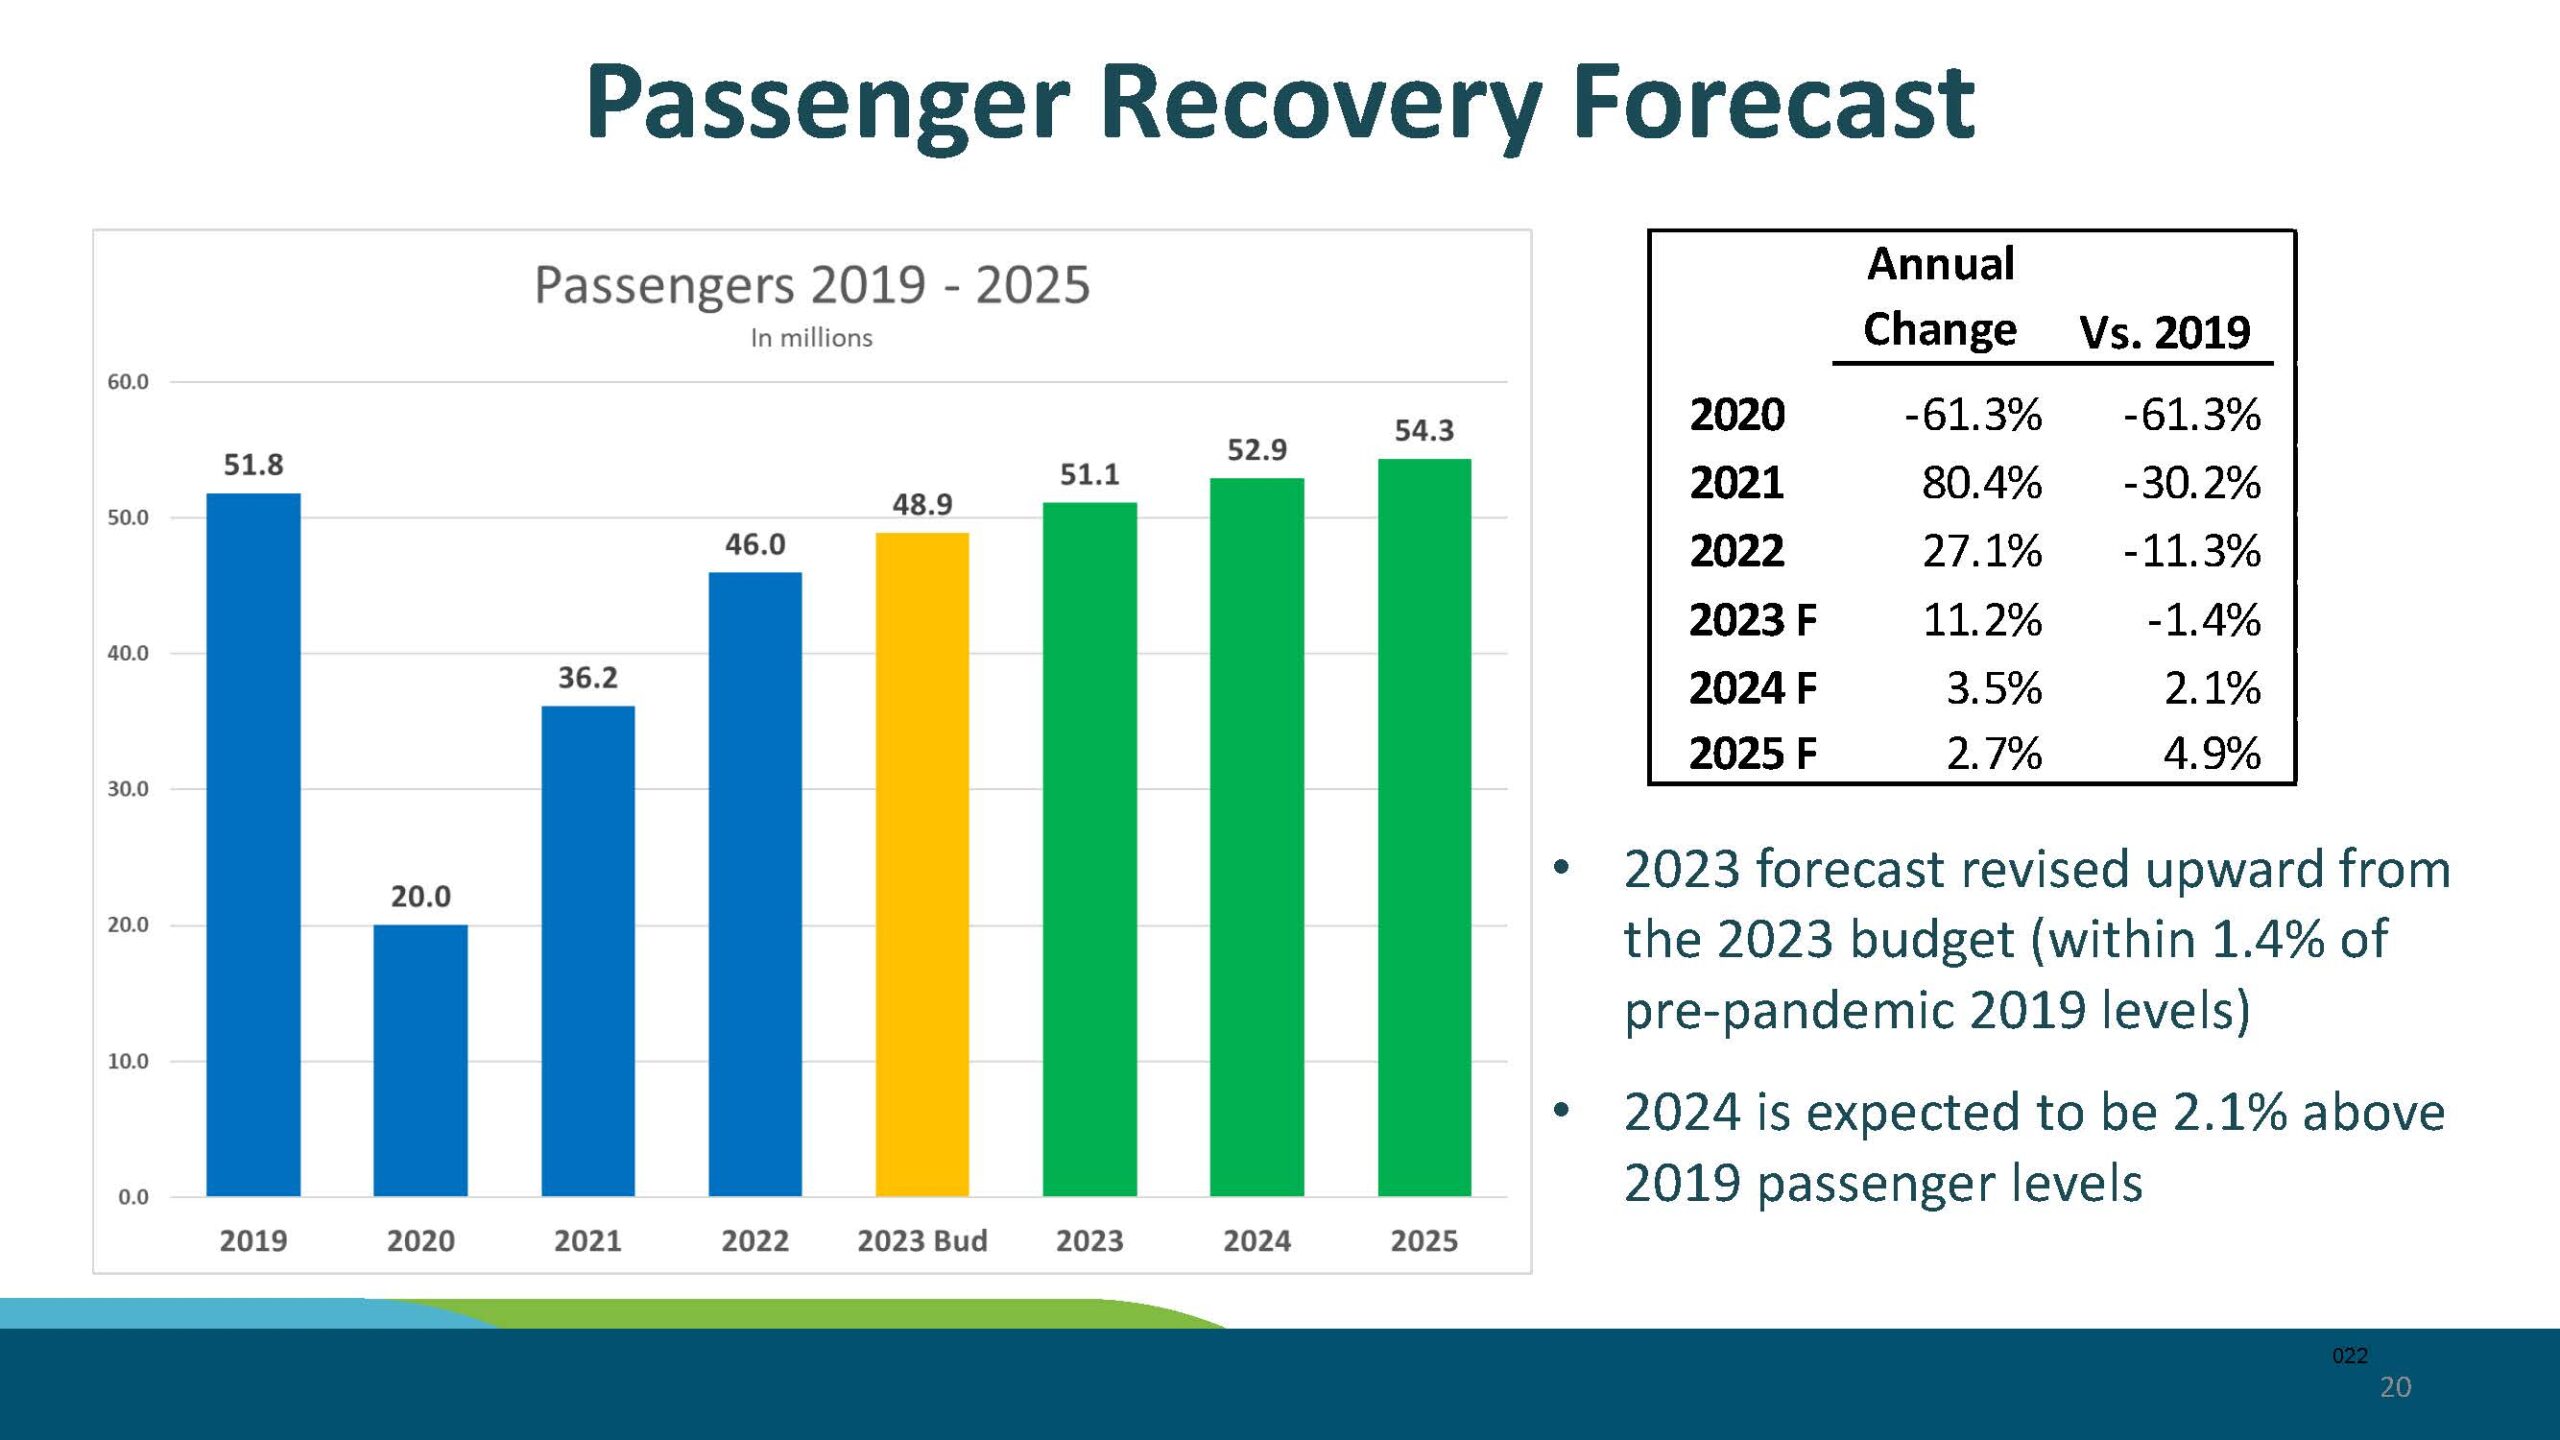
Sea-Tac Airport Passenger Volume Data and Forecast 2019–2025
A slide from a Sea-Tac Airport presentation showing passenger volume data from 2019 to 2025 (in millions), including actual figures and forecasts. The chart shows a COVID-19-related drop to 20.0 million passengers in 2020 (-61.3% vs. 2019) with projected recovery to 54.3 million by 2025, exceeding pre-pandemic 2019 levels of 51.8 million by 4.9%. -
 2023-09-01
Aviation Activity Forecast Update: Seattle-Tacoma International Airport (2023)
This technical memorandum, prepared by Leigh Fisher for the Port of Seattle in September 2023, presents an updated aviation activity forecast for Seattle-Tacoma International Airport. It includes constrained operating growth scenarios (COGS), FAA approval documentation, and airside modeling data used to support environmental review planning. The forecast serves as a foundational planning tool for understanding future airport capacity and operational assumptions.