TagFlight Tracks(58)
-
Flow and Flight Tracks
A set of daily tracks from March 1 to March 18, 2018, giving a representation of North Flow and South Flow departure and arrivals. To make sense of these we suggest reading our article on runways and flow. People who complain about the flight concentration immediately notice the pattern to ‘the funnel’, ie. the points -
 2018-09-24
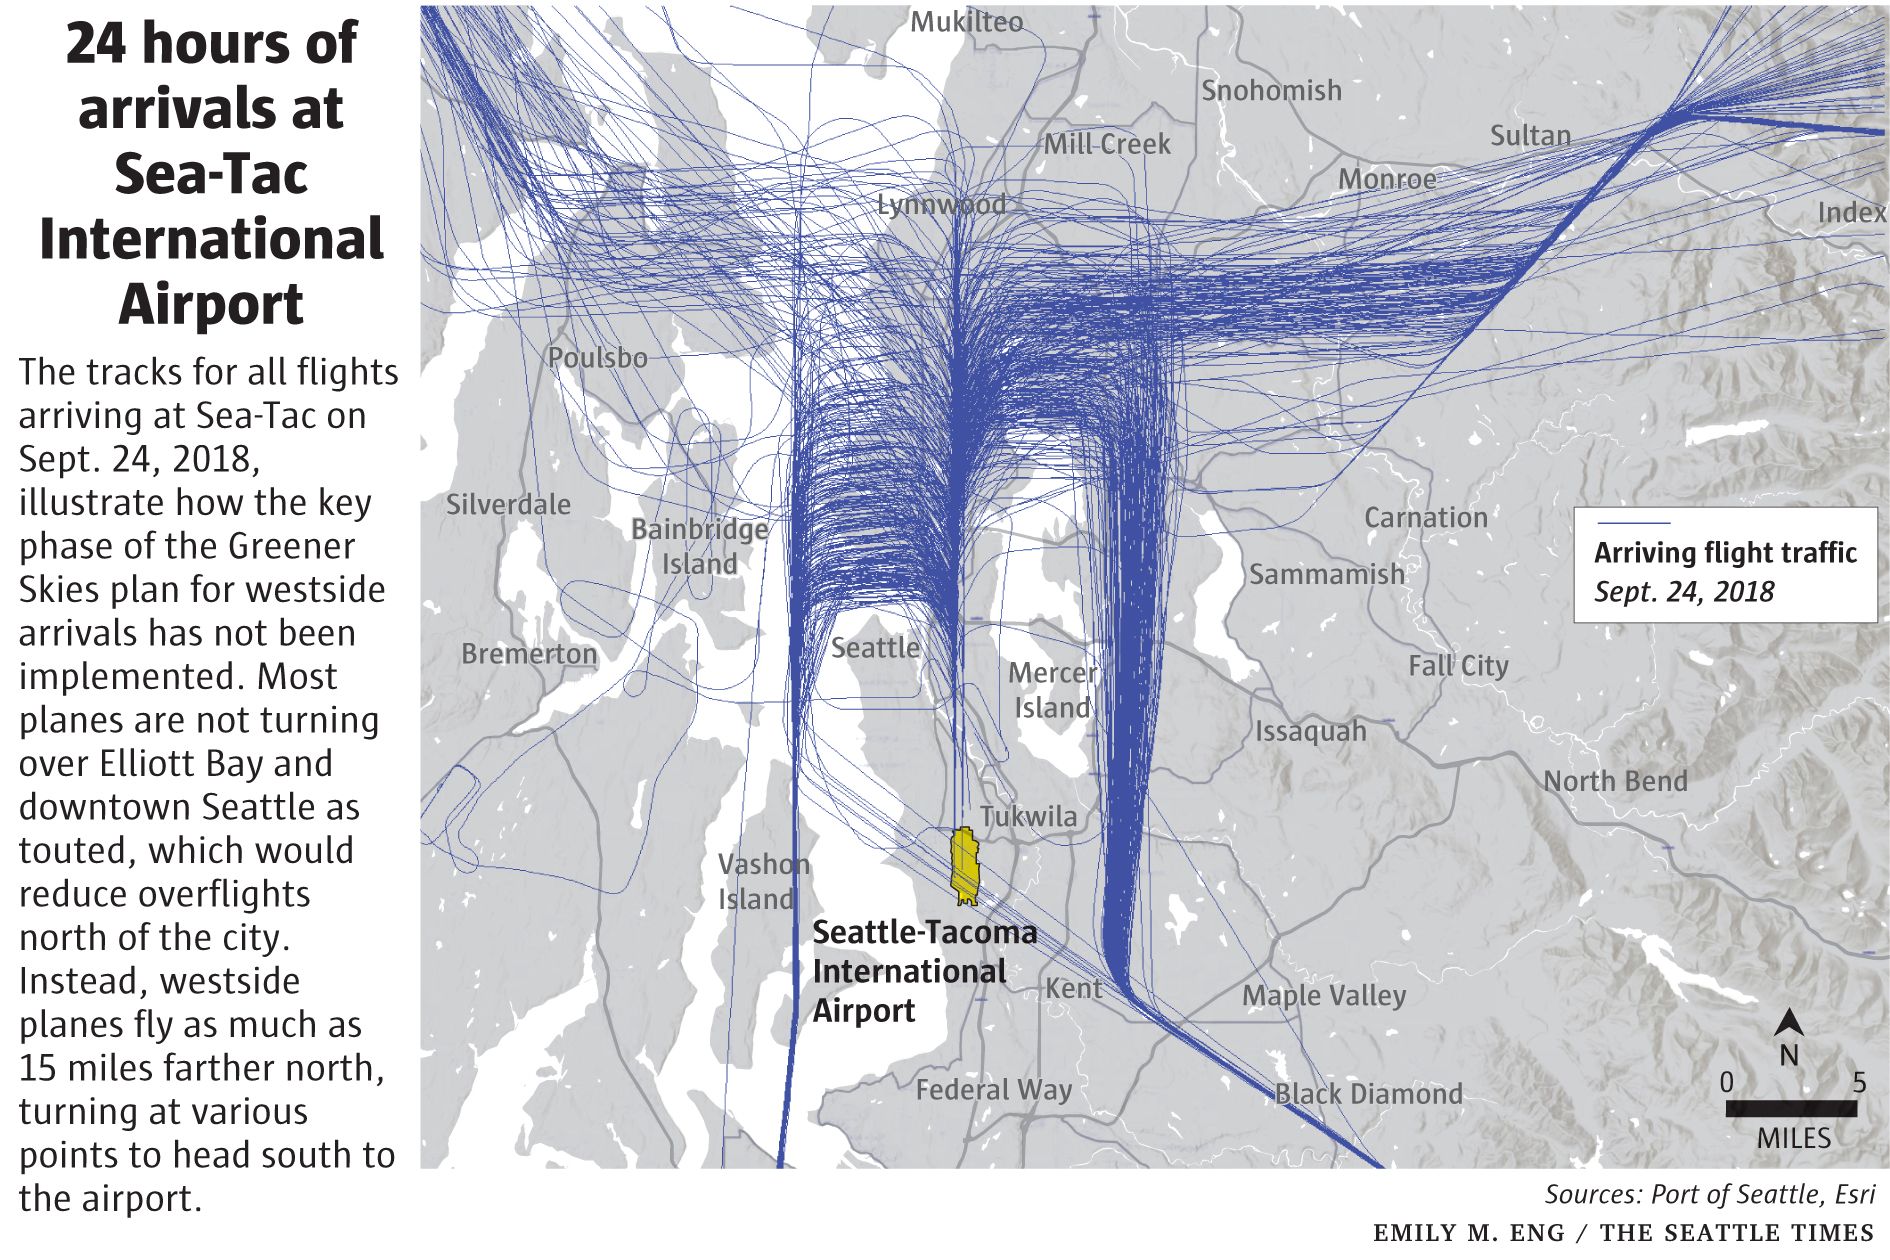
Seattle Times 24 hours of arrivals at Sea-Tac Greener Skies not implemented on west side of zipper merge
A flight-track map published by The Seattle Times (graphic by Emily M. Eng, sources: Port of Seattle and Esri) showing all arriving flights at Seattle-Tacoma International Airport on September 24, 2018. The graphic illustrates that the Greener Skies plan's westside-arrival procedure had not been implemented as designed, with planes flying up to 15 miles farther north than intended rather than turning over Elliott Bay and downtown Seattle. -
 2018-03-01
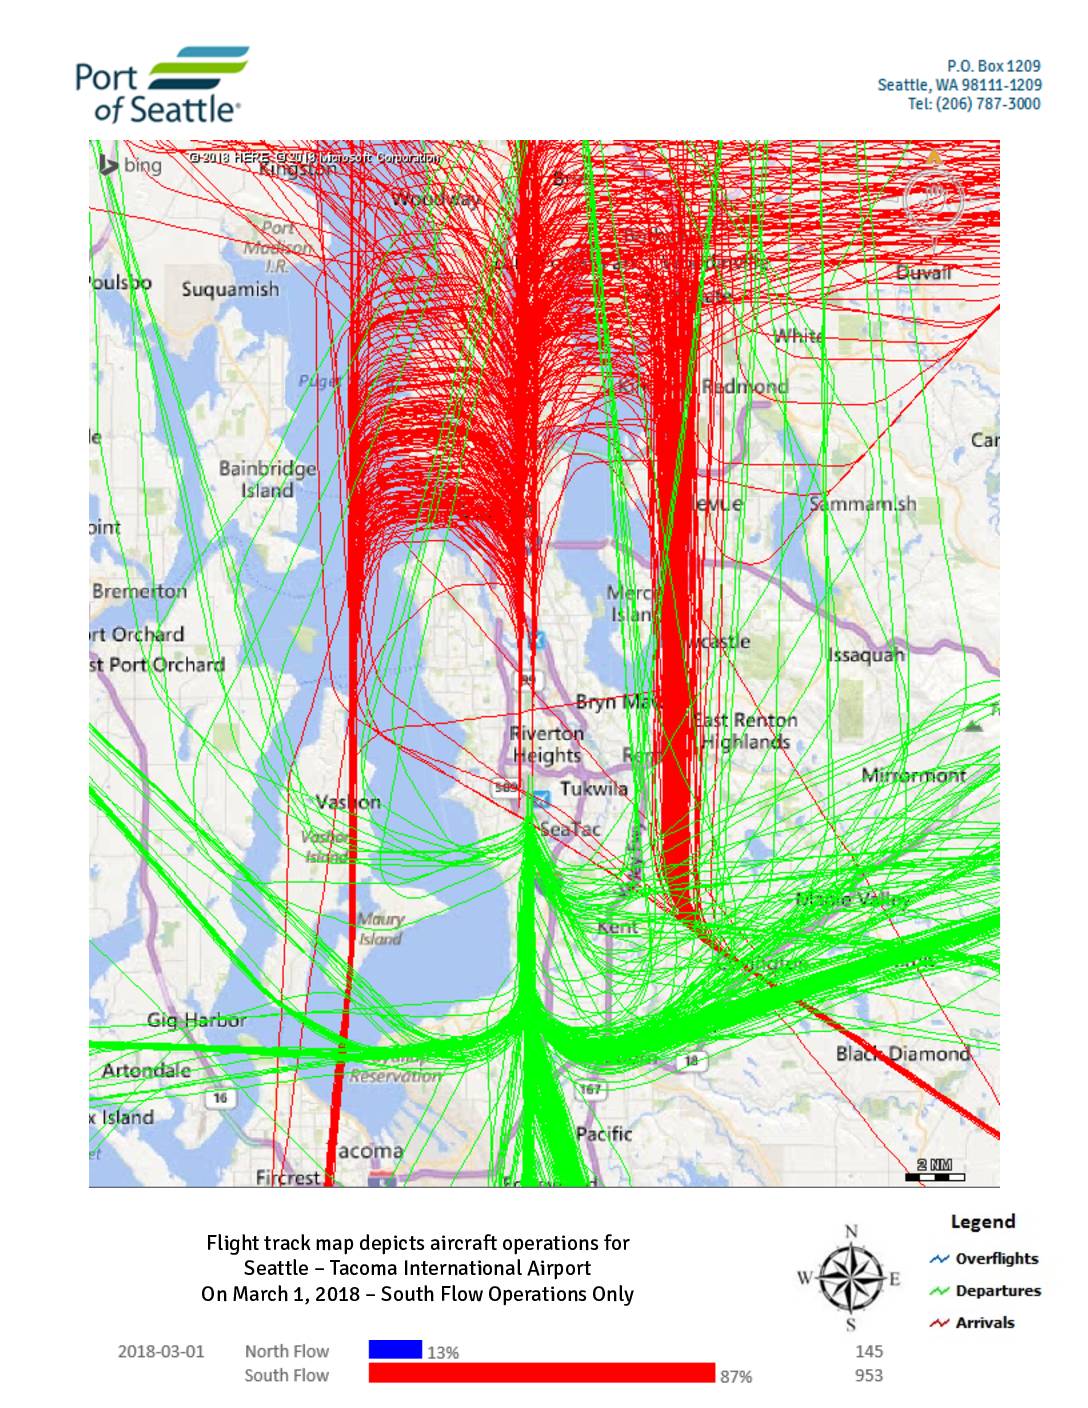
Flight track map depicts aircraft operations for Seattle – Tacoma International Airport on March 1-2, 2018
These flight track maps from the Port of Seattle show aircraft arrival, departure, and overflight paths at Seattle-Tacoma International Airport on March 1–2, 2018. On March 1, the airport operated predominantly in South Flow (87% of operations, 953 flights), with a brief period of North Flow (13%, 145 flights); on March 2, all 1,118 operations were conducted entirely in South Flow. The maps illustrate how flight corridors shift direction depending on the flow configuration, affecting which surrounding communities—such as those north of the airport near Shoreline and Mountlake Terrace versus those to the south near Auburn and Pacific—experience the greatest noise exposure. -
 2018-03-01
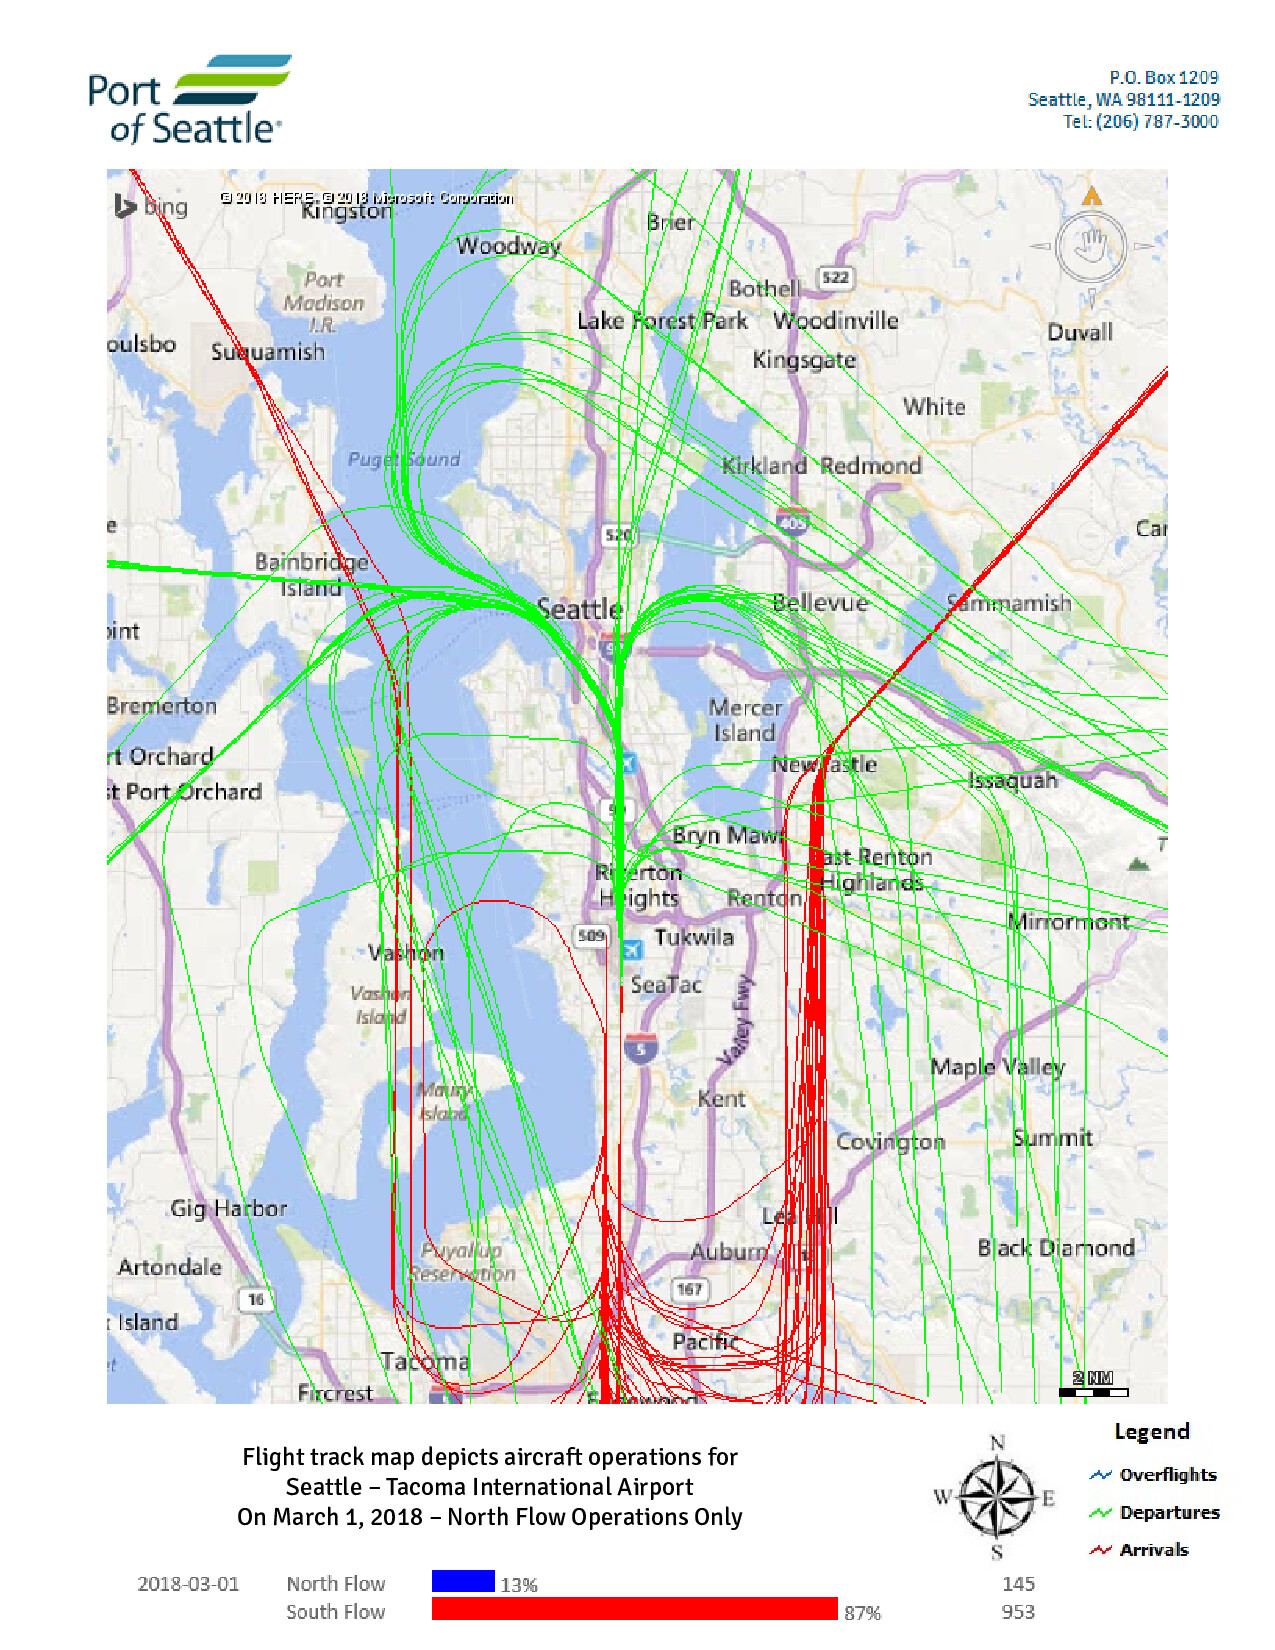
Sea-Tac Airport Daily Flight Track Map by Flow — North Flow Operations, March 1, 2018
Port of Seattle flight track map showing aircraft operations at Seattle-Tacoma International Airport on March 1, 2018, depicting North Flow operations only. The map displays overflights (blue), departures (green), and arrivals (red), with data indicating North Flow accounted for 13% of operations (145 flights) and South Flow 87% (953 flights) on that date. -
 2018-01-24
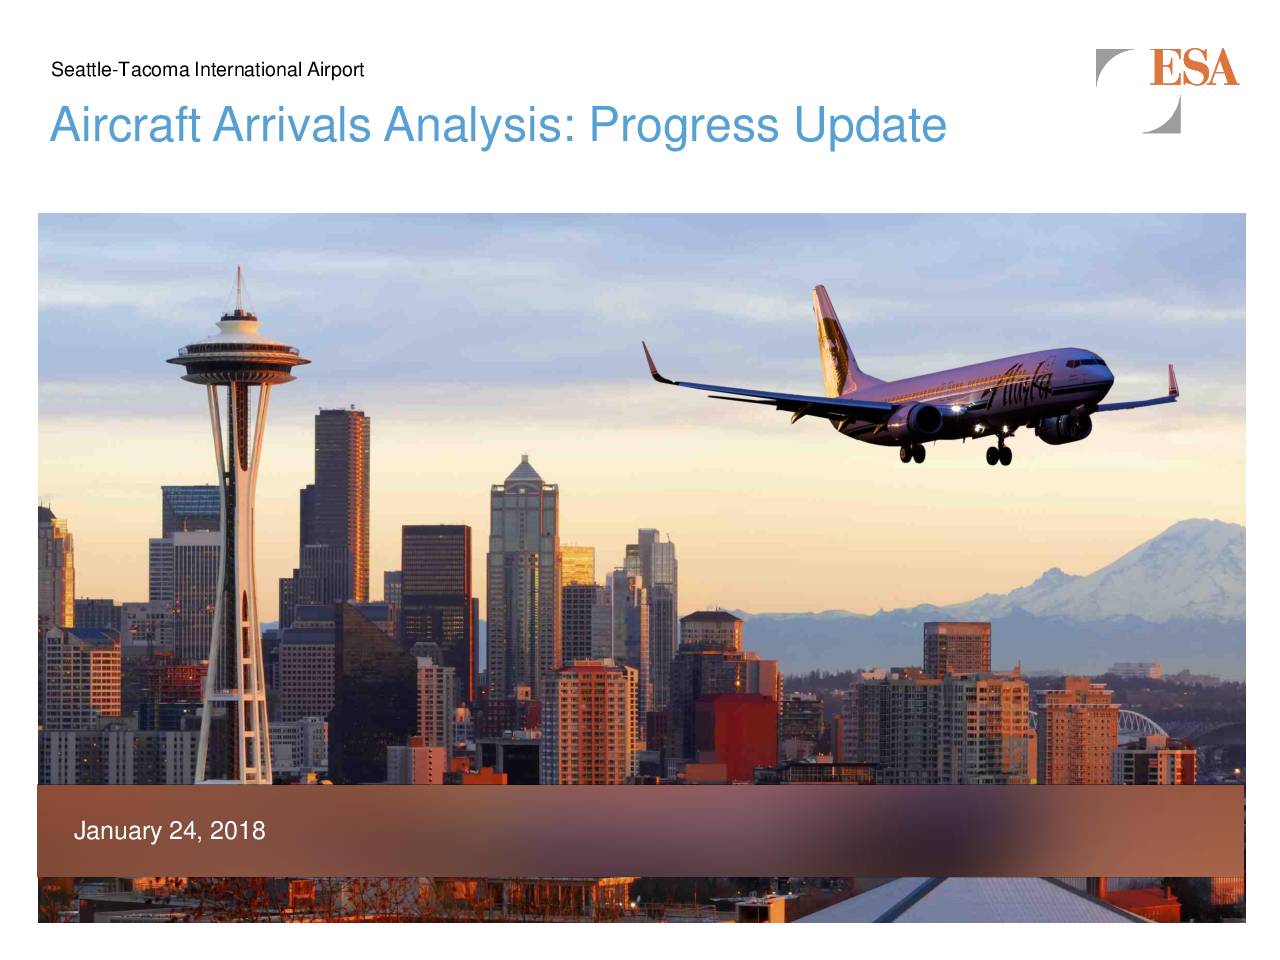
Aircraft arrivals analysis: Progress update
This January 2018 progress update from ESA presents an analysis of aircraft arrivals at Seattle-Tacoma International Airport (SEA), examining whether notable changes occurred between 2013, 2015, and 2017. The study uses radar flight track data from July and December of each year to compare fleet mix, runway usage, and aircraft altitudes at six nautical miles from the airport. Key questions addressed include whether arrival numbers increased, whether traffic flow patterns shifted between north and south flow, and whether arriving aircraft were flying at different altitudes over the study period. -
 2018-01-01
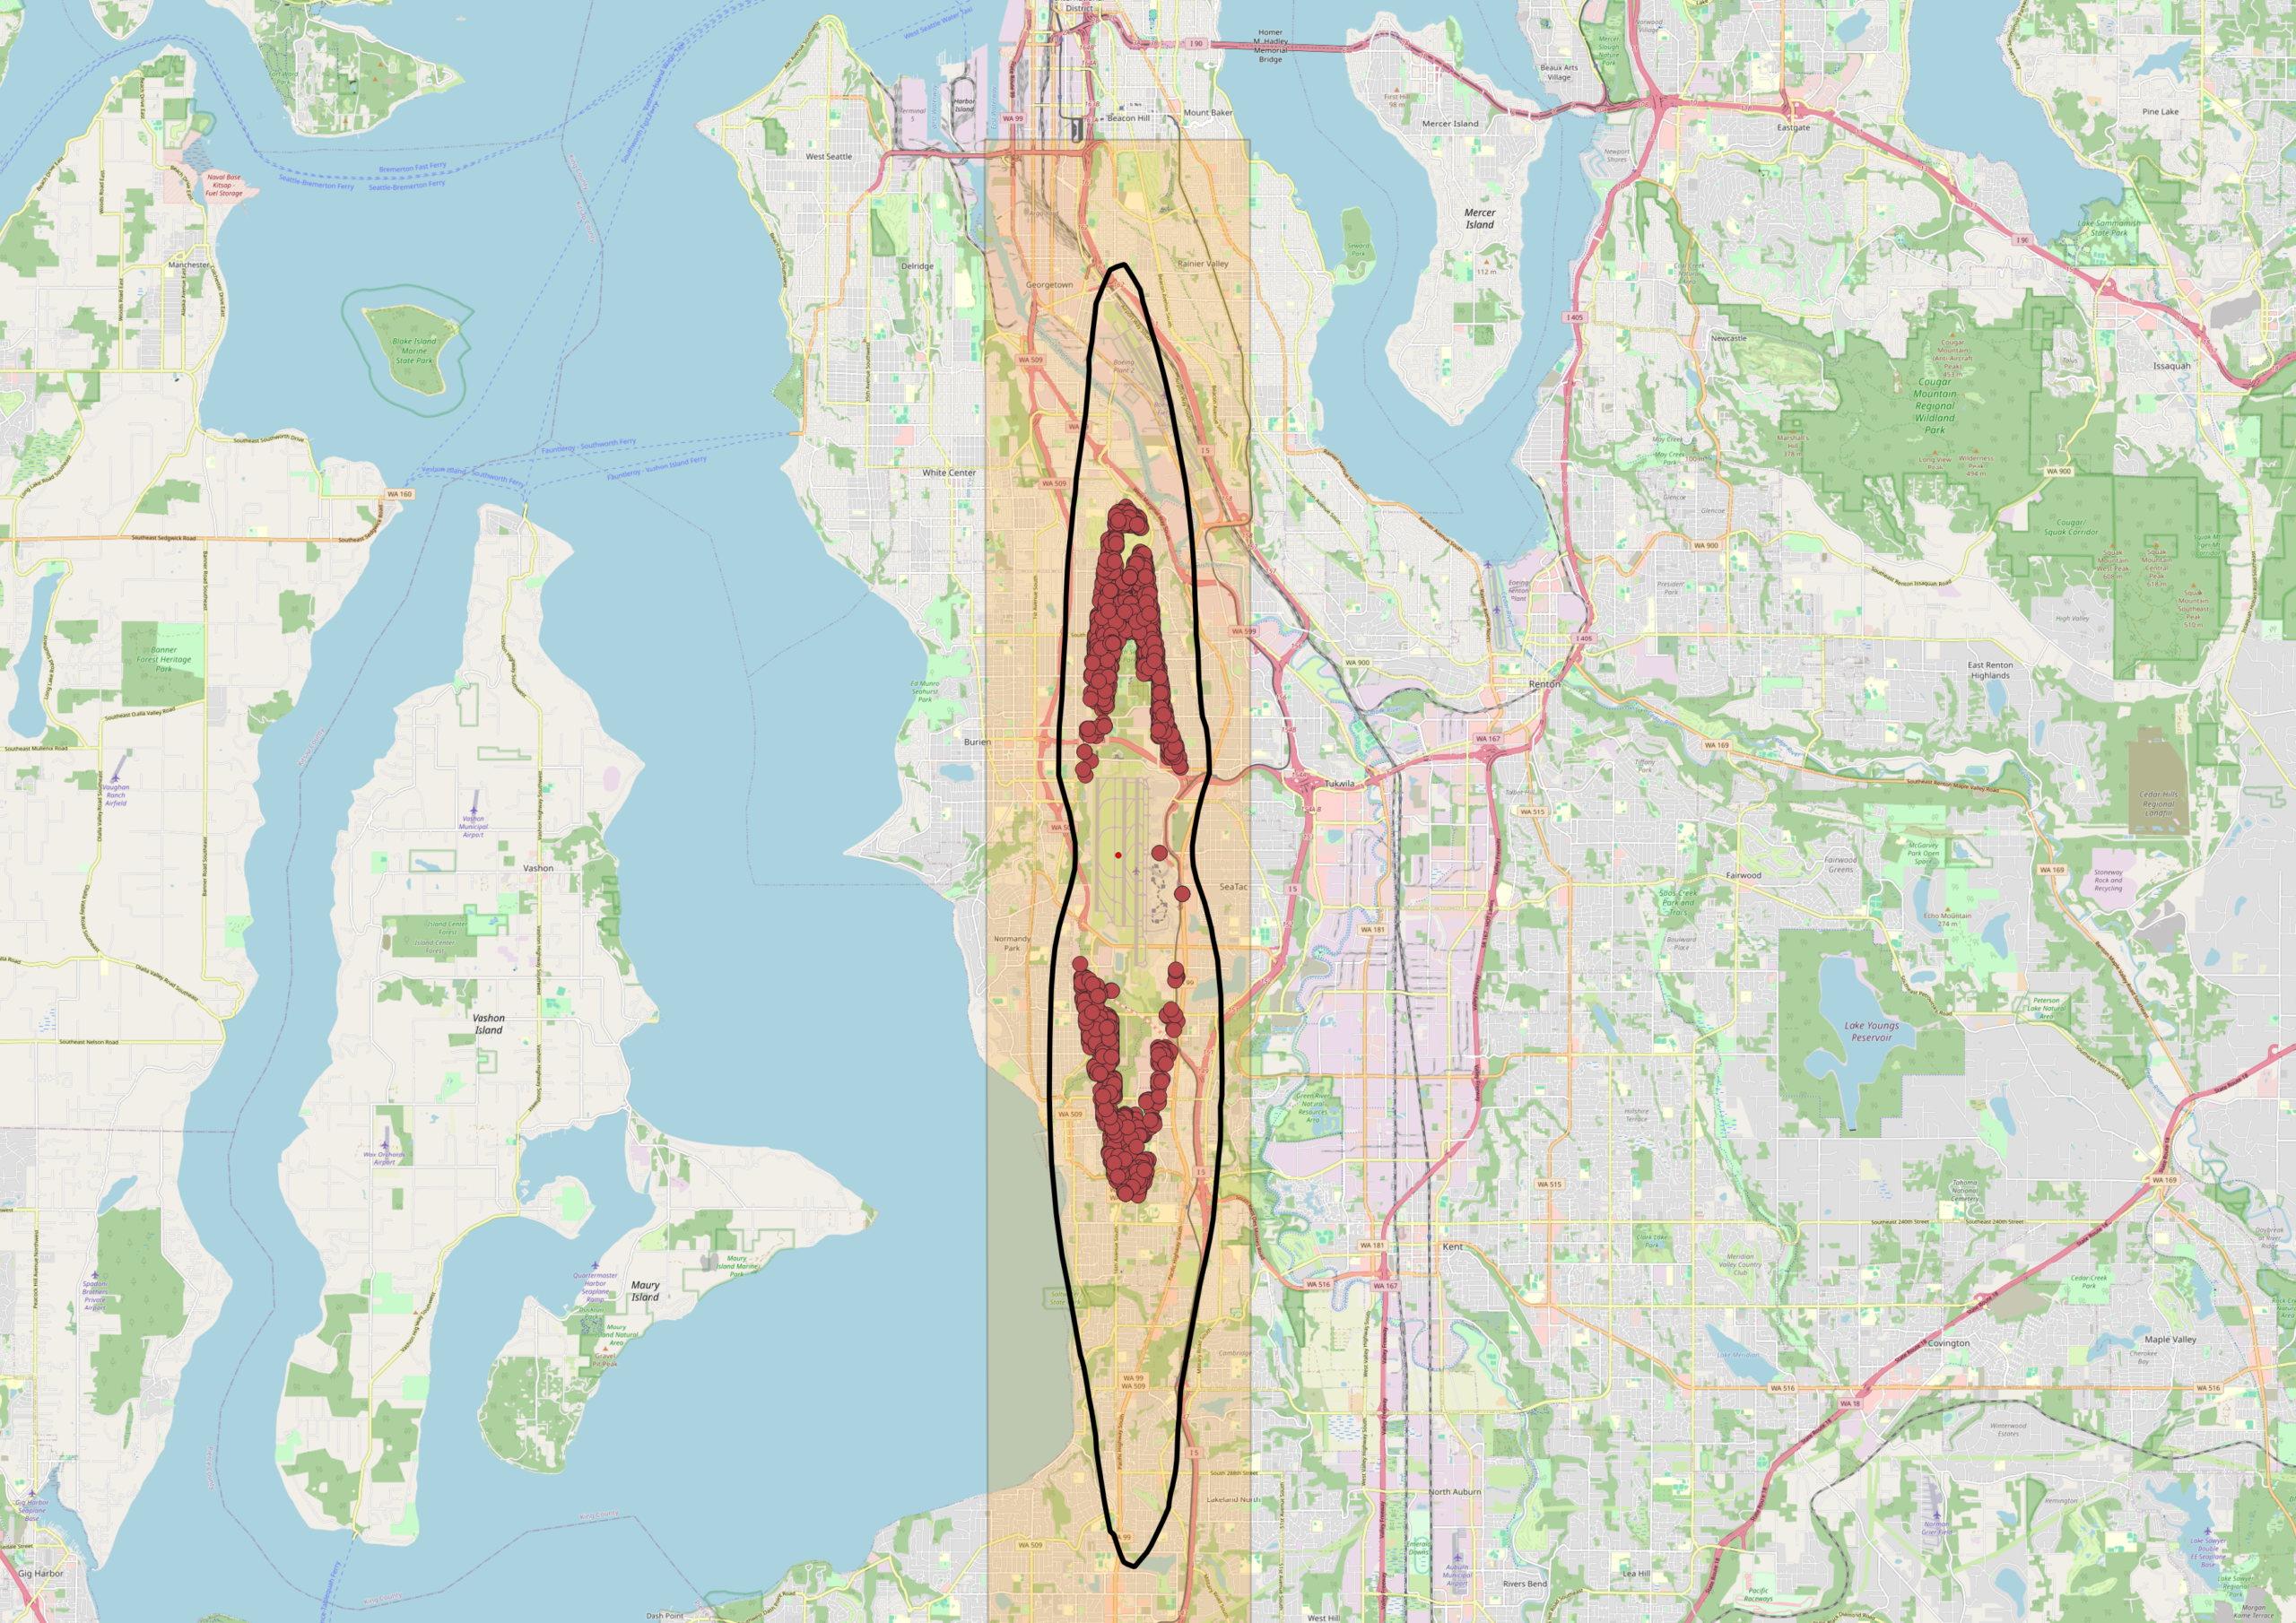
Sea-Tac Airport DNL 65 Noise Contour Map with 2018 Noise Complaints — Burien, White Center, and Tukwila
An OpenStreetMap-based map of the Seattle–Tacoma area showing Sea-Tac Airport's flight corridor, marked with a highlighted orange corridor zone and a black oval outline indicating the primary noise impact area. Red dot clusters represent noise complaints or flight track incidents concentrated over the Burien, White Center, and Tukwila neighborhoods south of Seattle, with a secondary cluster further south near Federal Way. -
 2018-01-01
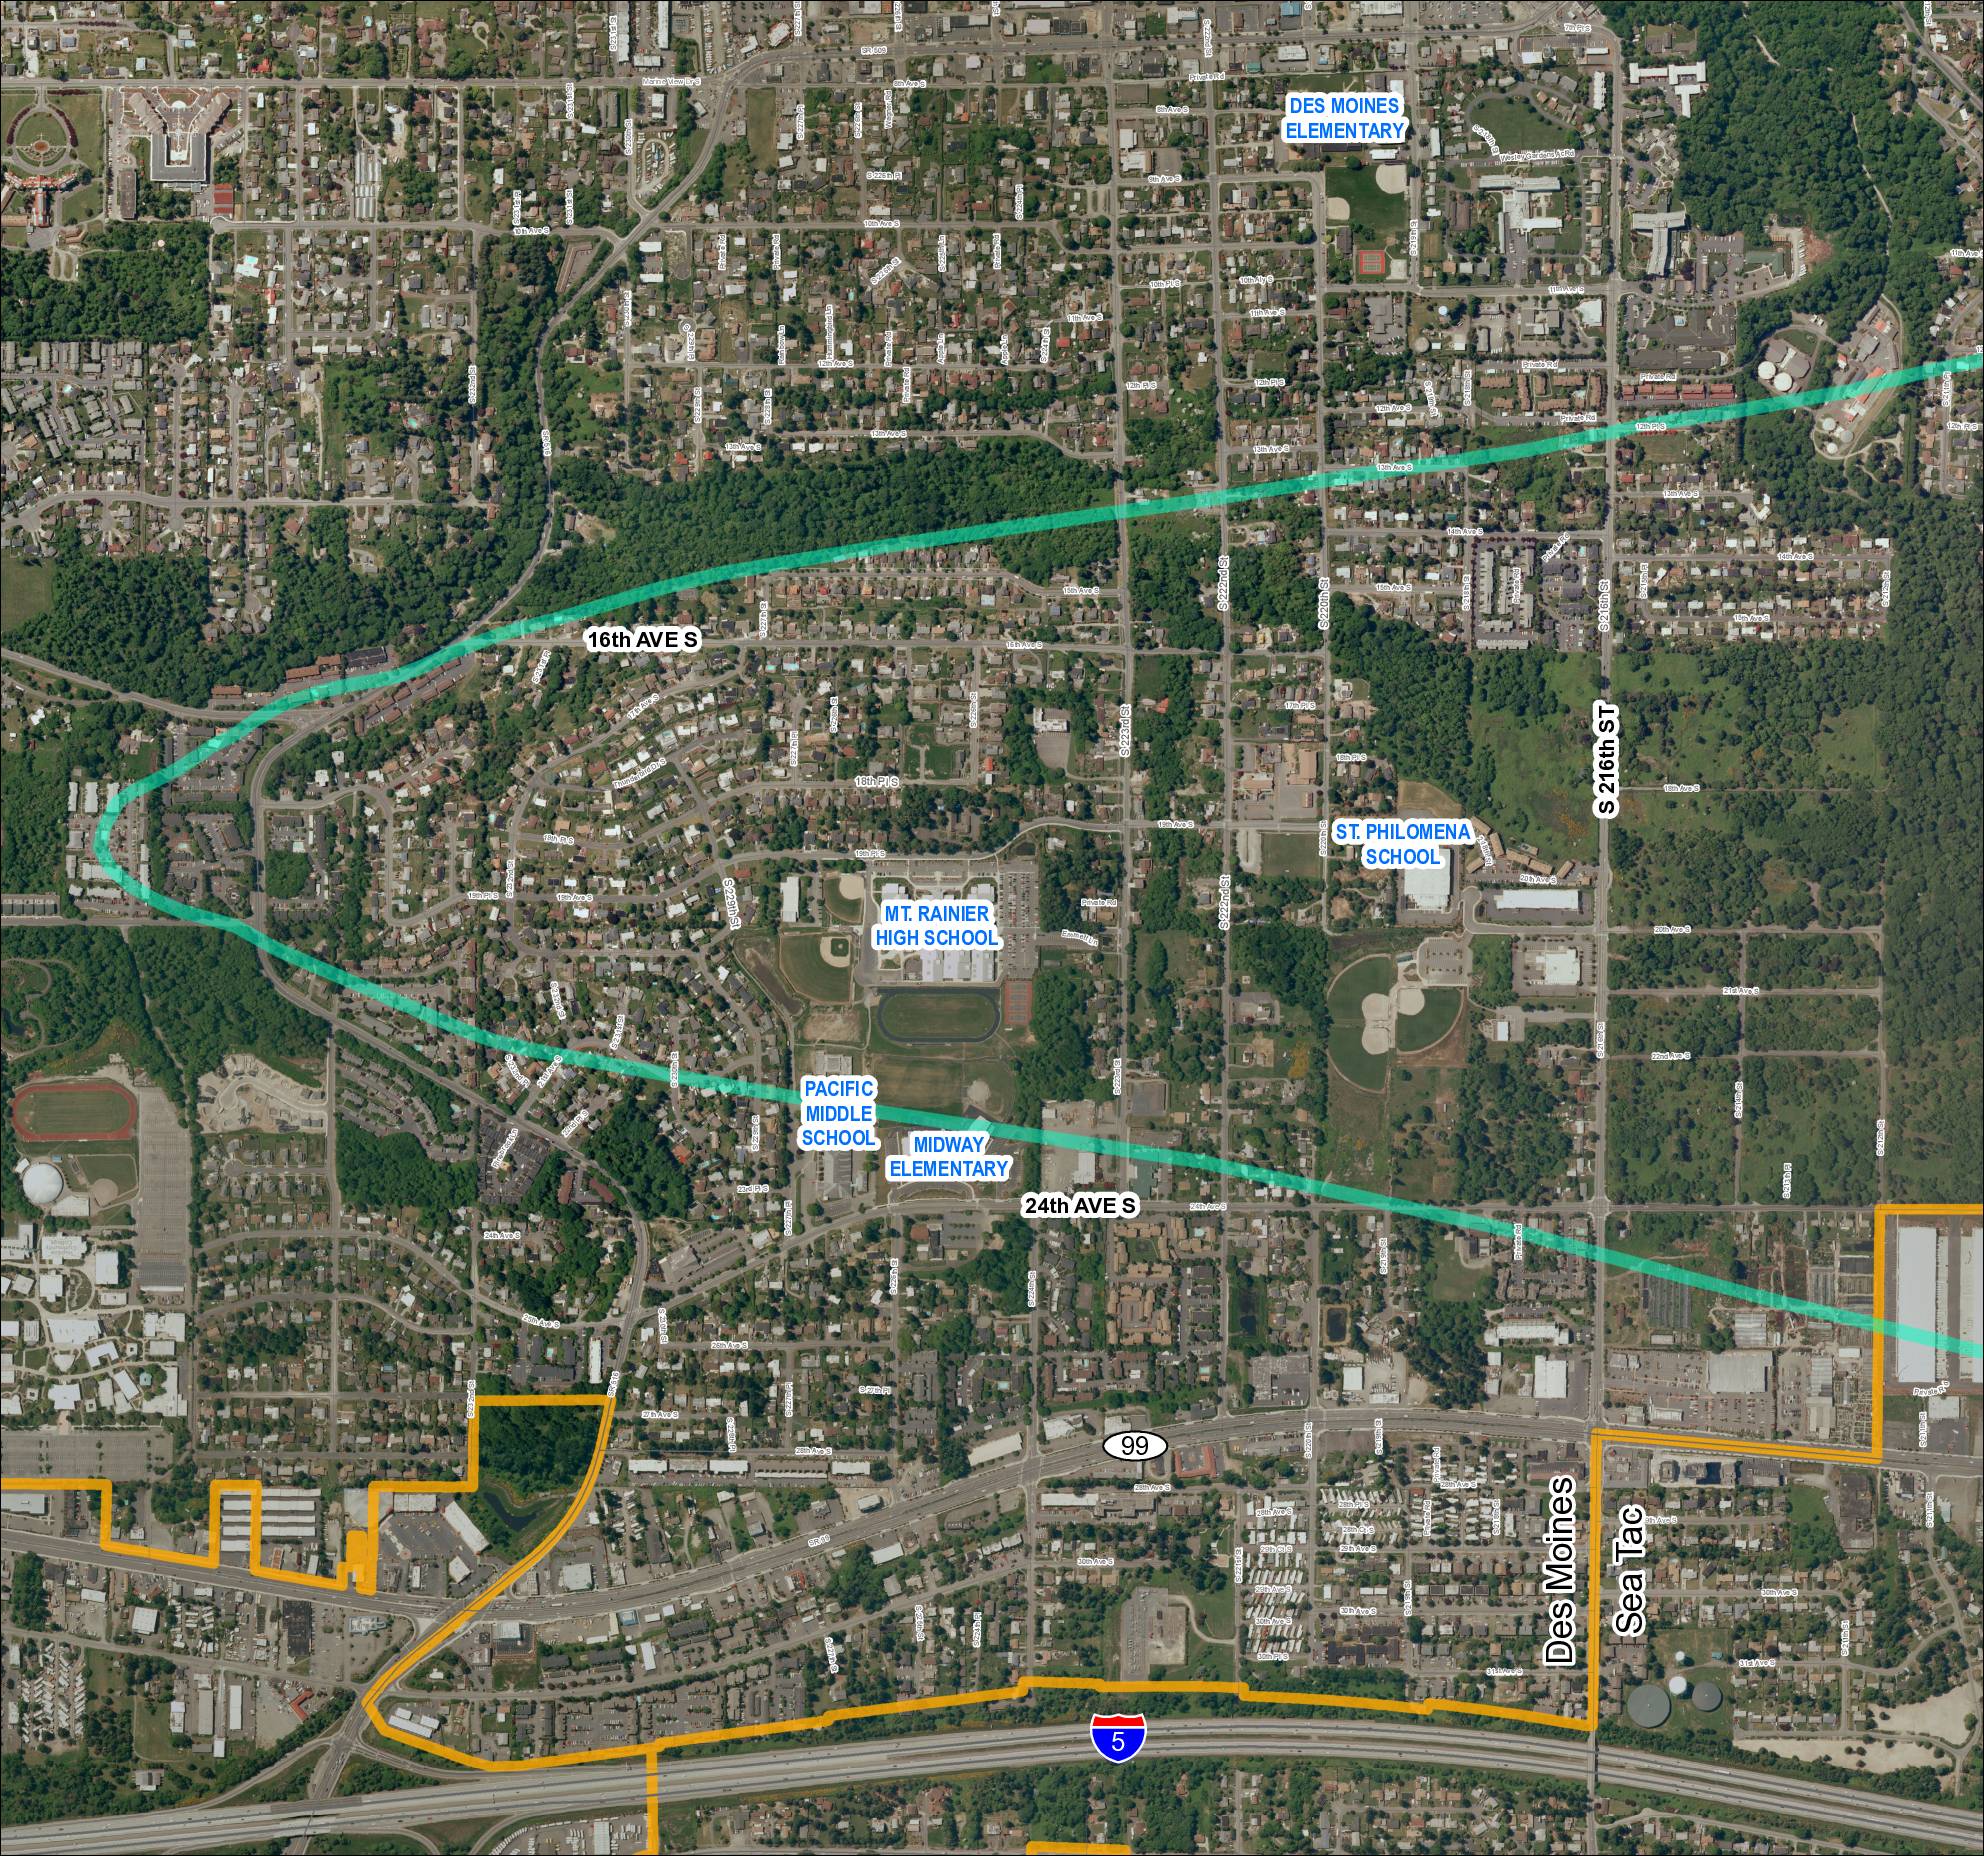
Grid 1: Des Moines and Sea-Tac Area Schools and Flight Corridor Map (2018)
This map shows the Des Moines and SeaTac area of Washington State, highlighting a noise impact corridor (shown in teal) that sweeps across the region near Sea-Tac Airport. The corridor passes over several schools including Mt. Rainier High School, Pacific Middle School, Midway Elementary, St. Philomena School, and Des Moines Elementary, indicating these institutions fall within the airport's noise-affected zone. A separate boundary (shown in orange) outlines what appears to be an airport-related land use or acquisition area in the southern portion of the map near Interstate 5. -
 2006-05-24
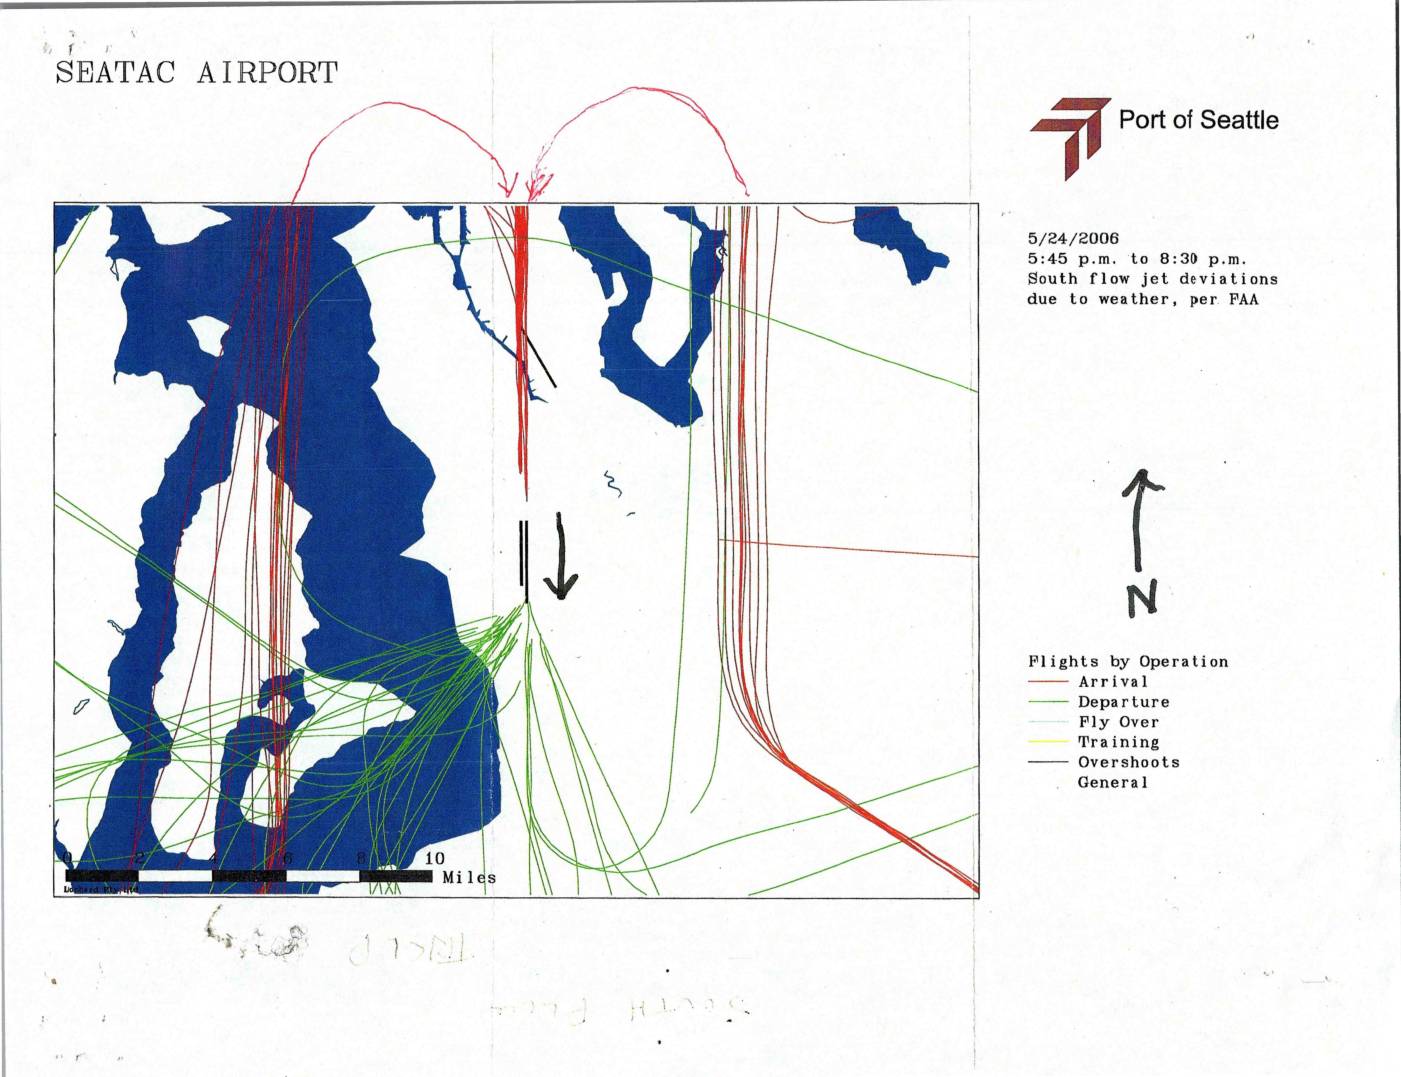
Sea-Tac Airport Flight Track Map: South Flow Jet Deviations Due to Weather, May 24, 2006
This Port of Seattle document shows a flight-track map of Seattle-Tacoma (Sea-Tac) Airport activity on May 24, 2006, between 5:45 p.m. and 8:30 p.m. During this period, south-flow jet aircraft deviated from their standard routes due to weather conditions, as confirmed by the FAA. The map distinguishes arrivals, departures, fly-overs, training flights, and overshoots by color, illustrating how unusual flight paths spread noise impacts across a wider area of the surrounding region. -
 2002-07-01
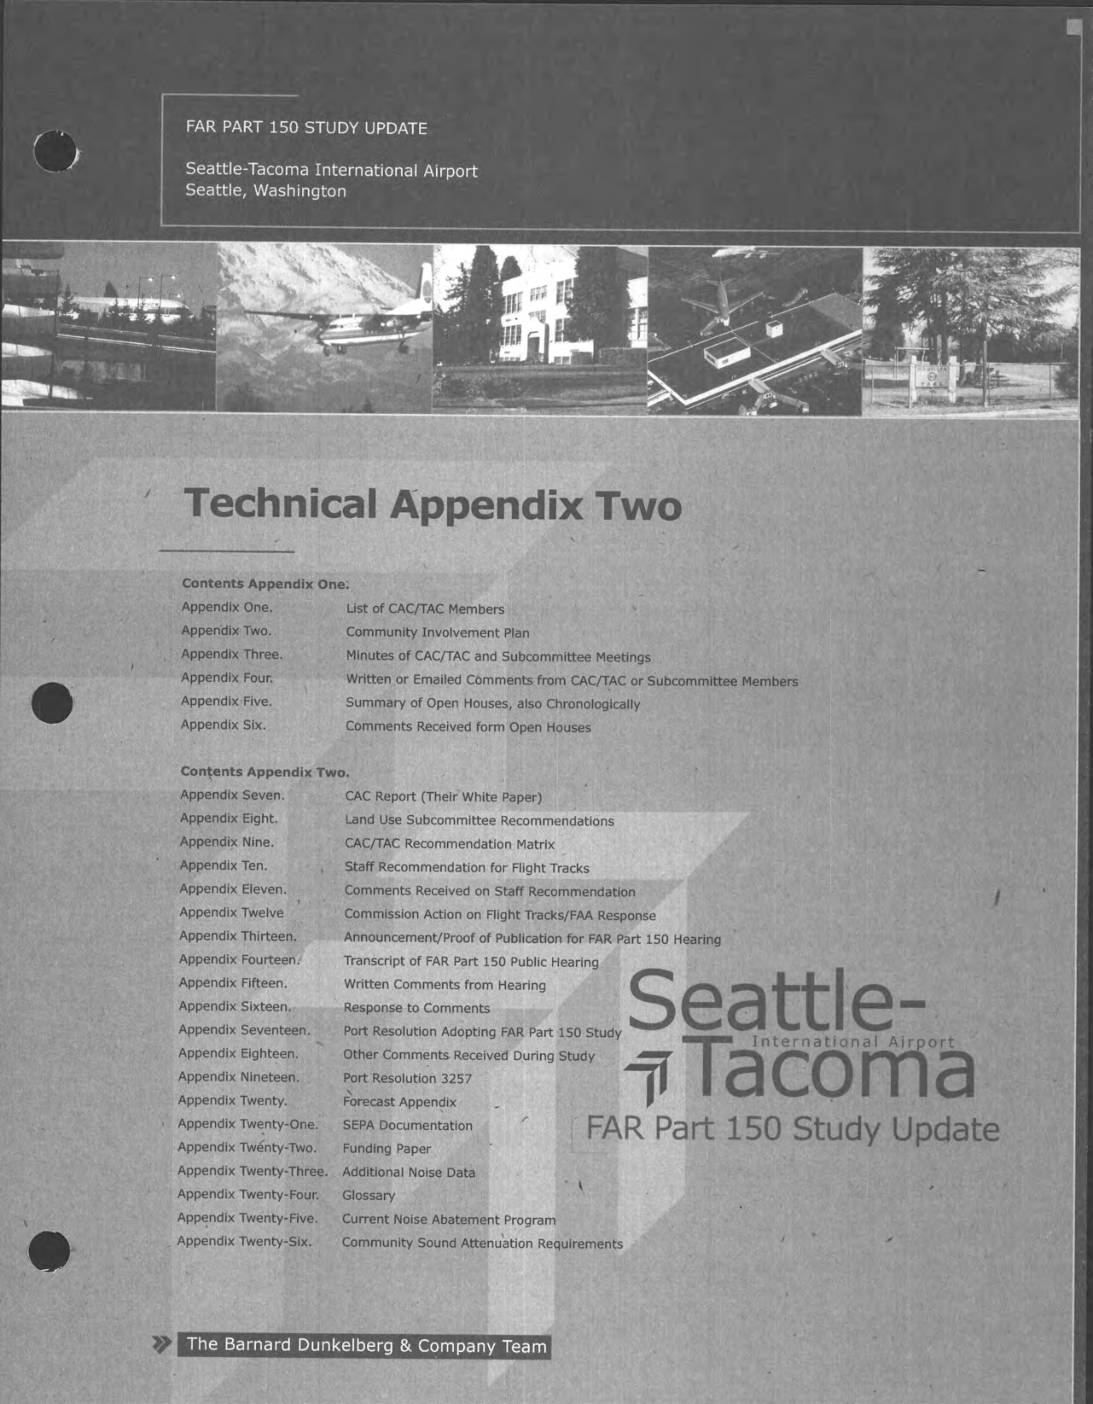
Seattle-Tacoma International Airport FAR Part 150 Study Update: Technical Appendix Two, Final Report, July 2002
This document is the Final Report (July 2002) of the FAR Part 150 Study Update for Seattle-Tacoma International Airport, a federally guided process to assess and manage aircraft noise impacts on surrounding communities. Technical Appendix Two (Appendices 7–26) compiles key study materials including community advisory committee reports, land use recommendations, flight track analyses, public hearing transcripts, noise data, and Port of Seattle resolutions. The report represents the culmination of extensive community involvement and technical review aimed at updating the airport's noise abatement and sound attenuation programs. -
 2000-04-13
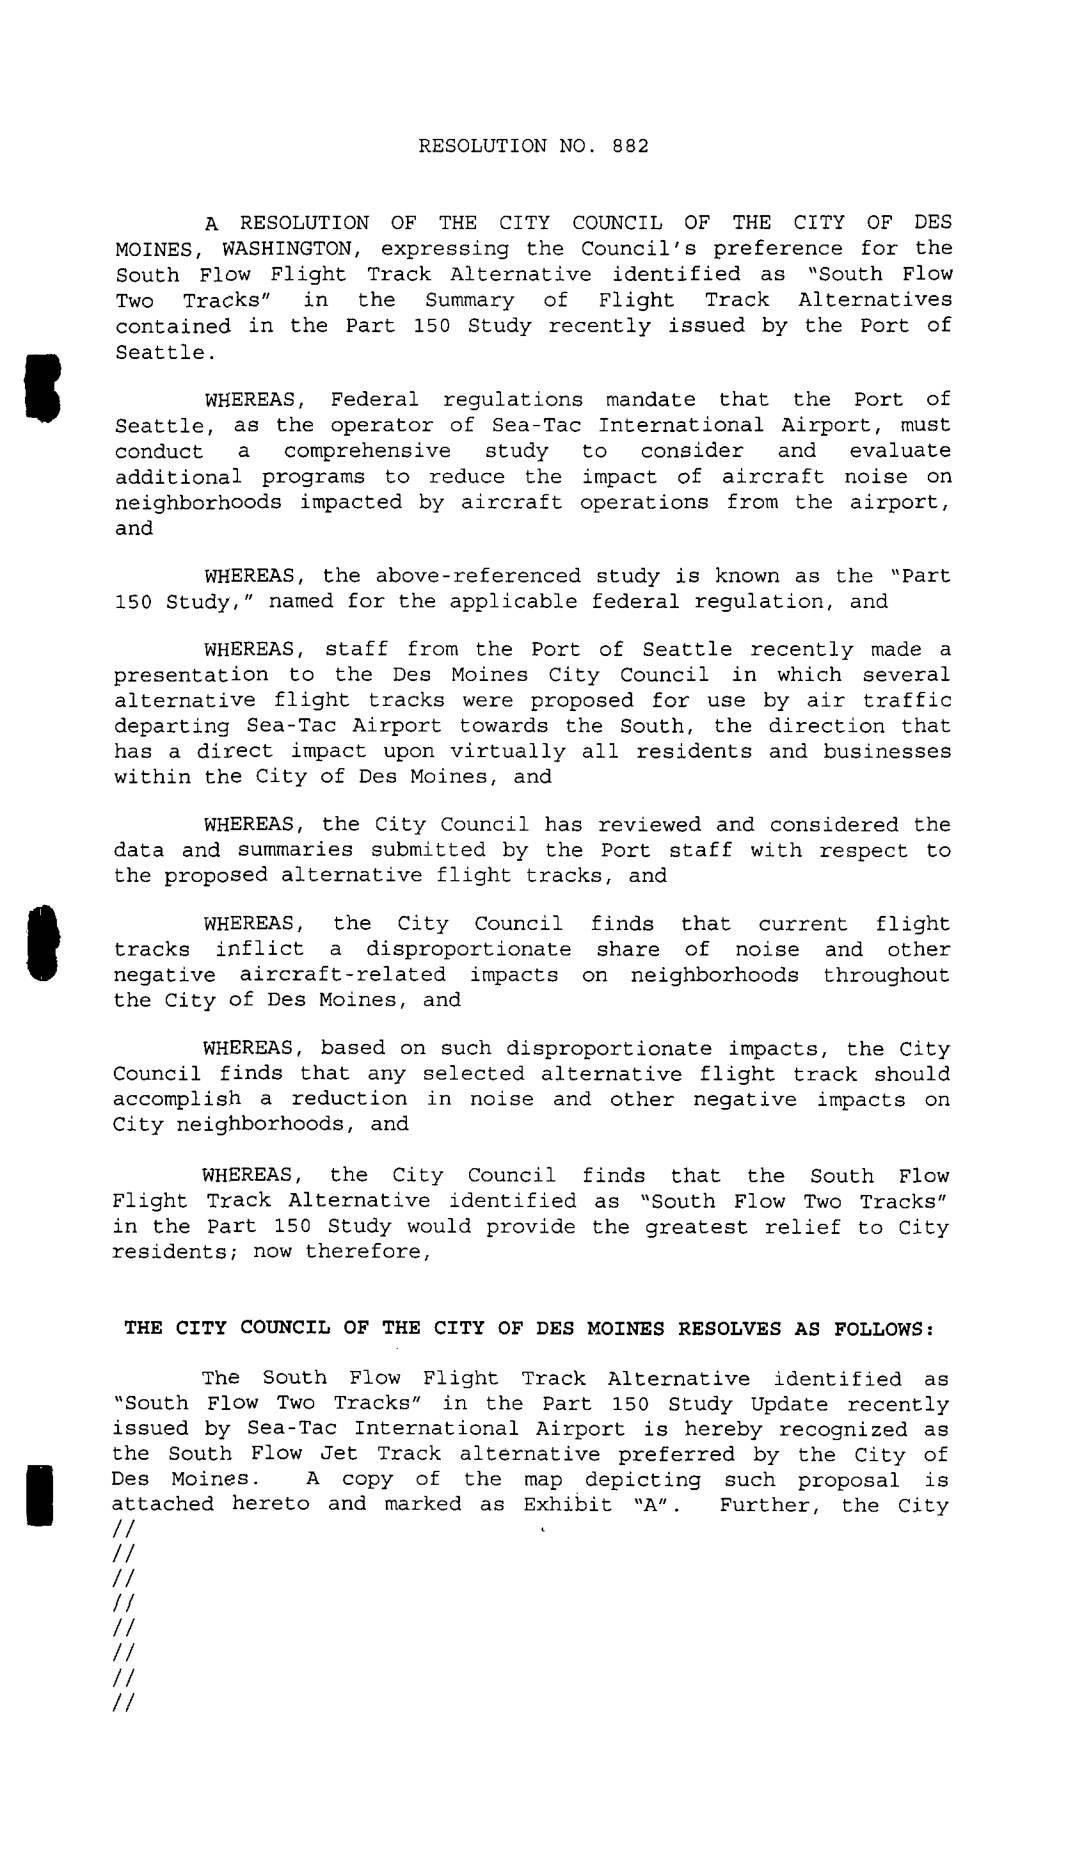
Resolution No. 882: Expressing the Council’s preference for the South Flow Two Tracks flight track alternative
In April 2000, the Des Moines, Washington City Council adopted Resolution No. 882, formally expressing its preference for the 'South Flow Two Tracks' flight path alternative proposed in the Port of Seattle's Part 150 Study. The Council found that existing flight tracks placed a disproportionate share of aircraft noise on Des Moines residents and businesses, and determined that the two-track alternative would provide the greatest noise relief. The City Manager was directed to submit the resolution to the Port of Seattle as the city's official position on southbound departure routes from Sea-Tac International Airport.