TagFlight Tracks(58)
-
18-120 DailyFTMbyFlow_Page_09
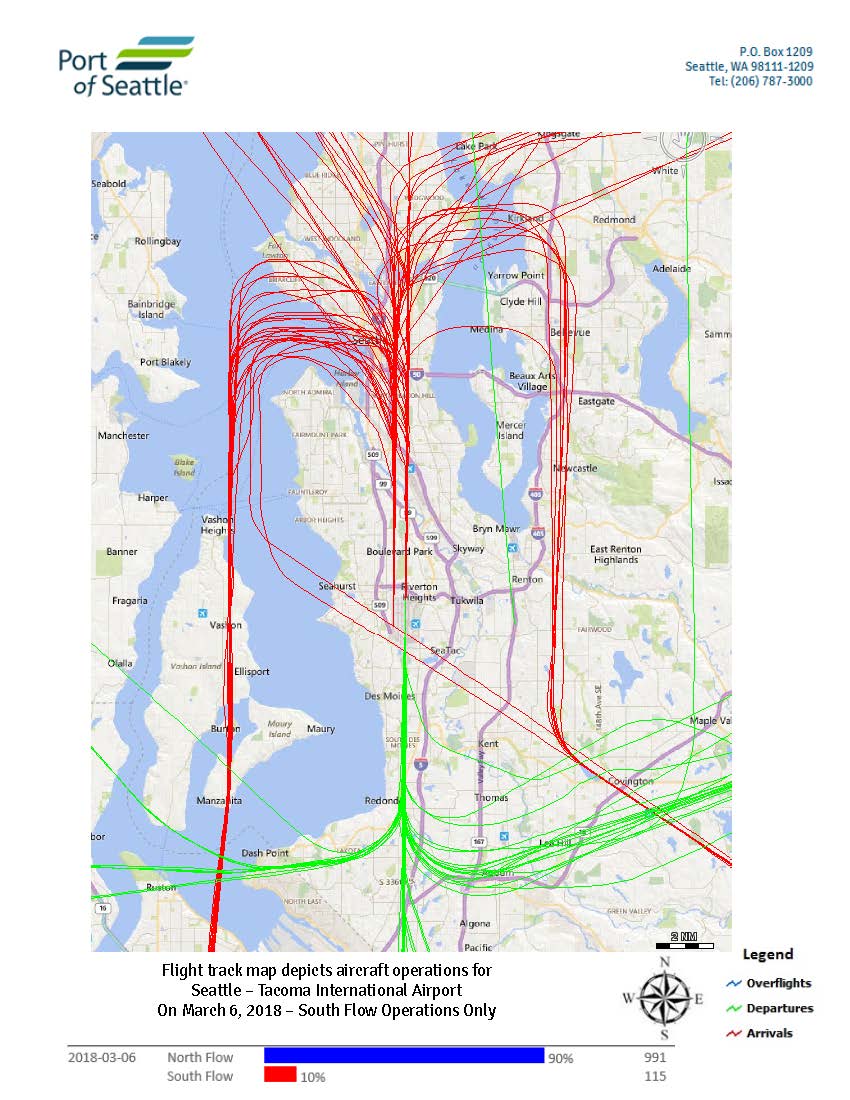
Port of Seattle flight track map depicting aircraft operations at Seattle-Tacoma International Airport on March 6, 2018, showing South Flow operations only. The map indicates arrivals (red), departures (green), and overflights (blue), with South Flow comprising 10% (115 operations) and North Flow comprising 90% (991 operations) of that day's traffic. -
18-120 DailyFTMbyFlow_Page_08
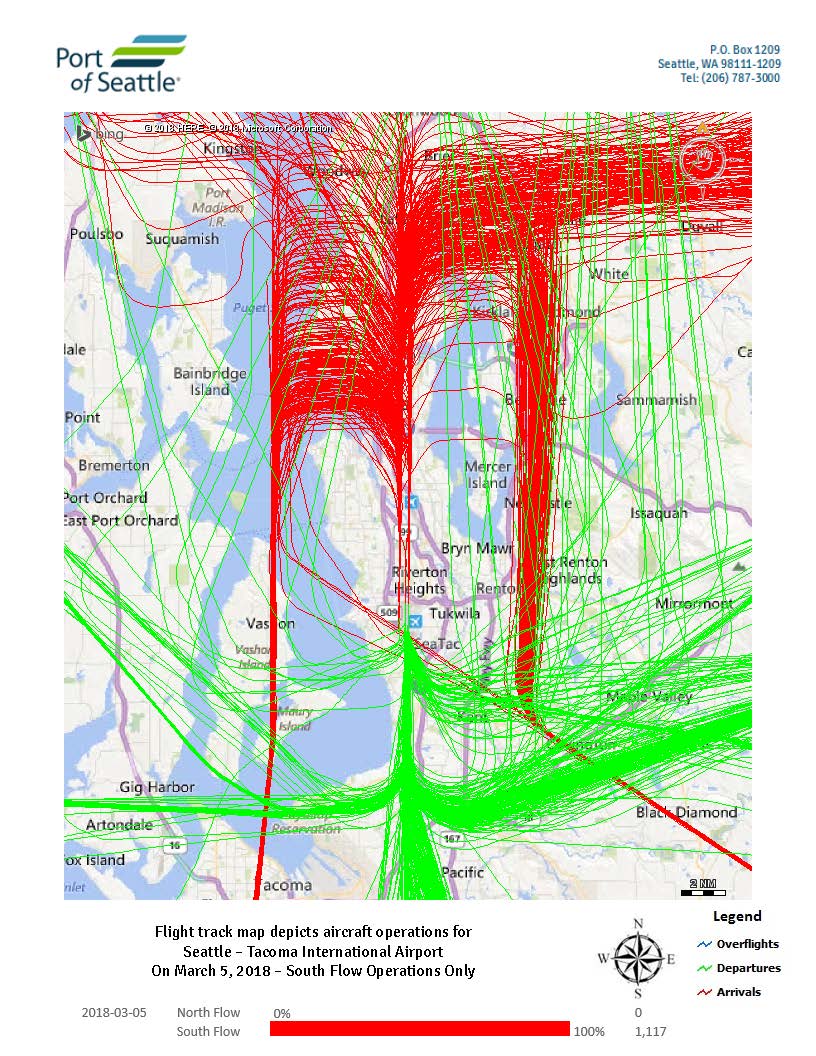
Flight track map produced by the Port of Seattle depicting all aircraft operations at Seattle-Tacoma International Airport on March 5, 2018, during South Flow operations only (1,117 total operations, 100% South Flow). The map shows arrival tracks in red and departure tracks in green overlaid on a Bing/HERE base map of the greater Seattle-Tacoma region. -
18-120 DailyFTMbyFlow_Page_13
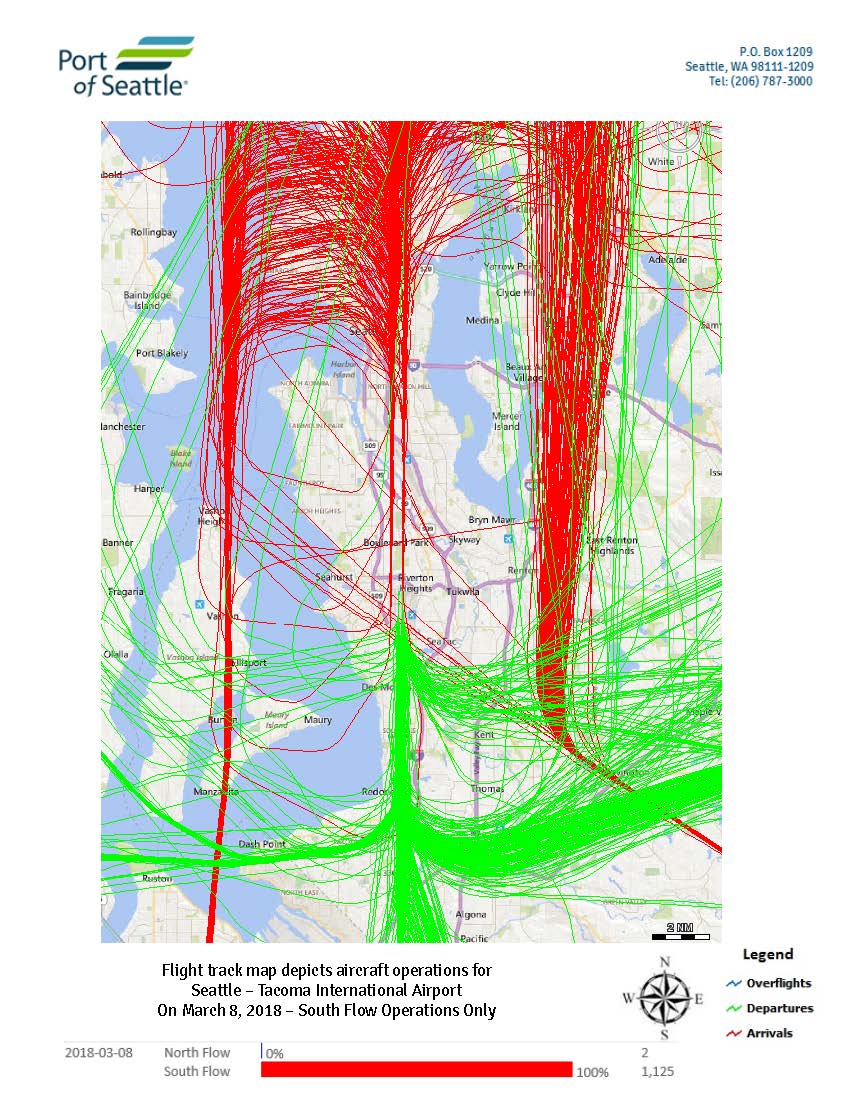
Flight track map produced by the Port of Seattle depicting aircraft operations at Seattle-Tacoma International Airport on March 8, 2018, showing South Flow Operations Only (100%, 1,125 operations) with zero North Flow operations. The map distinguishes arrivals (red), departures (green), and overflights (blue) over the greater Seattle-Tacoma area. -
18-120 DailyFTMbyFlow_Page_12
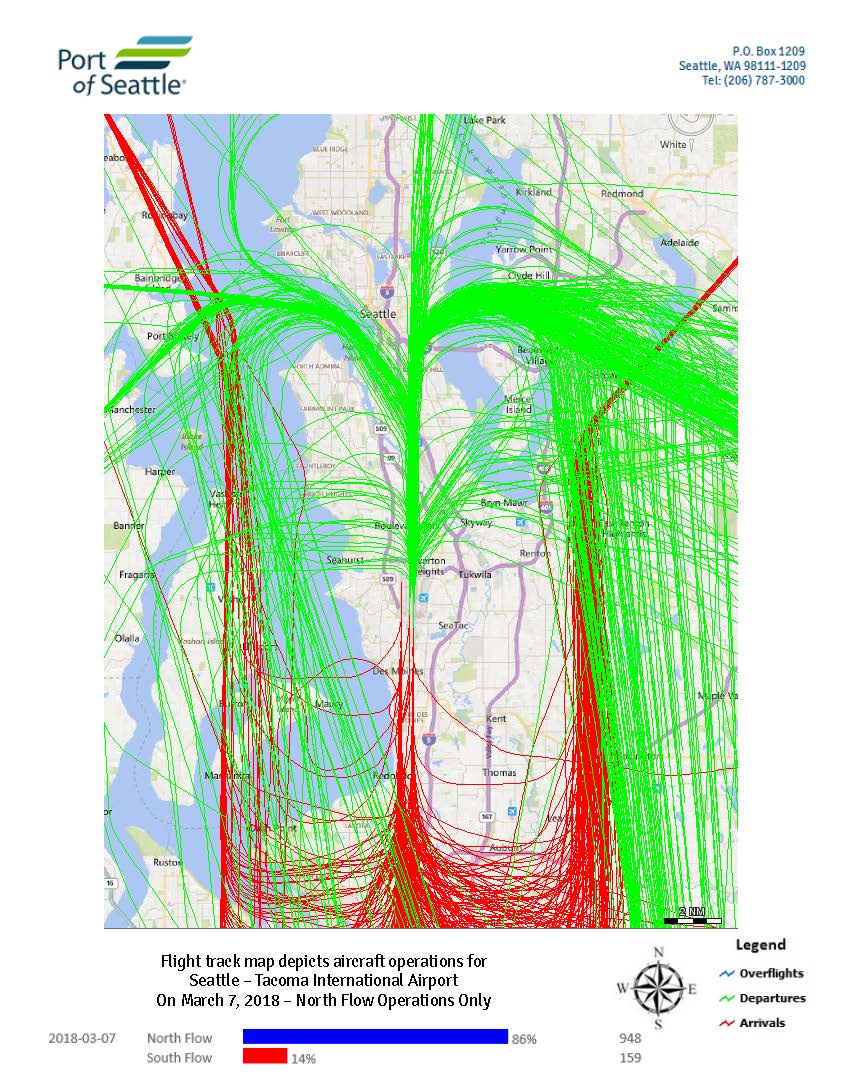
Port of Seattle flight track map depicting aircraft operations at Seattle-Tacoma International Airport on March 7, 2018, showing North Flow Operations only. Green lines indicate departures, red lines indicate arrivals, and blue lines indicate overflights; North Flow accounted for 86% of operations (948 flights) and South Flow 14% (159 flights). -
18-120 DailyFTMbyFlow_Page_11
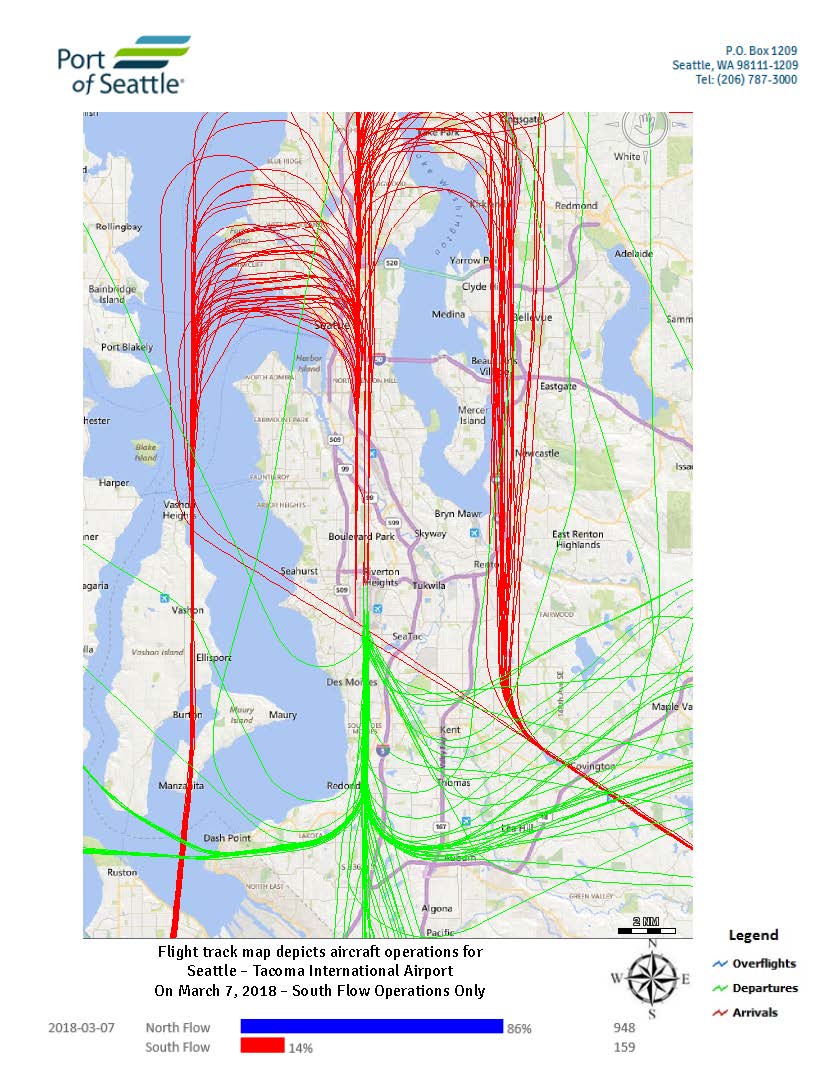
Port of Seattle flight track map depicting aircraft operations at Seattle-Tacoma International Airport on March 7, 2018, showing South Flow operations only. On that date, North Flow accounted for 86% of operations (948 flights) and South Flow 14% (159 flights), with arrival tracks shown in red, departures in green, and overflights in blue. -
SR-509 surplus-cropped
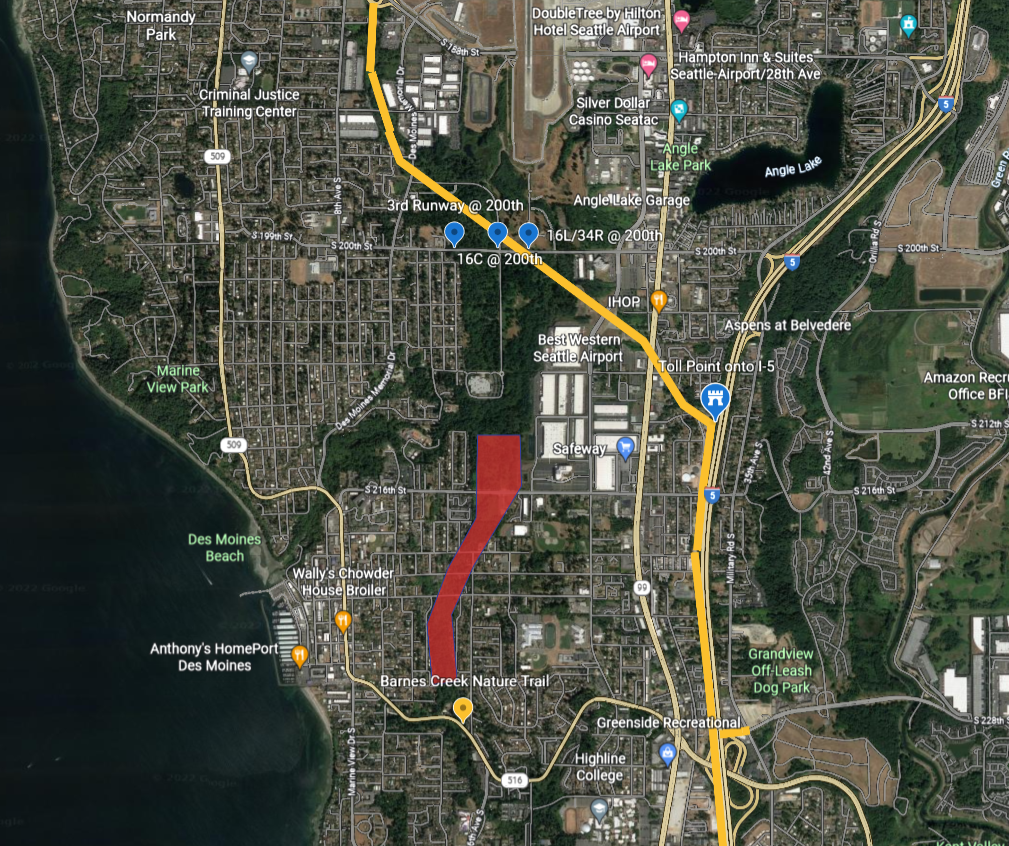
Satellite map of the Des Moines/SeaTac area south of Seattle showing marked approach corridors for Sea-Tac Airport runways 16C, 16L/34R, and the 3rd Runway at S 200th Street. A red polygon highlights a noise-impact or study zone extending southward through residential Des Moines roughly between S 216th Street and S 228th Street, near Barnes Creek Nature Trail and Des Moines Beach. -
 2022-07-14
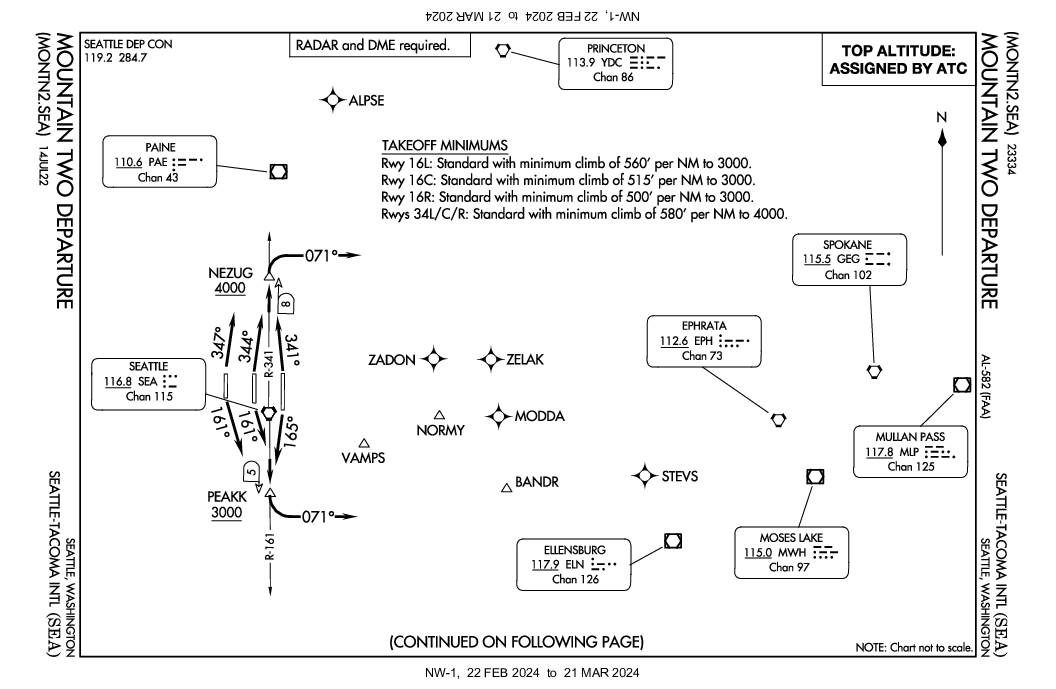
Mountain Two Departure (MONTN2.SEA) — Seattle-Tacoma International Airport Standard Instrument Departure
The Mountain Two Departure (MONTN2.SEA) is an instrument departure procedure for Seattle-Tacoma International Airport (SEA) that provides pilots with specific climb and routing instructions based on which runway they are using. Departing aircraft must meet minimum climb gradients ranging from 500 to 580 feet per nautical mile depending on the runway, and are directed to fly specific headings before turning eastbound on a 071° heading toward fixes like PEAKK or NEZUG. The procedure requires radar and DME equipment, with top altitude assigned by ATC and a lost communications protocol directing pilots to proceed direct to the SEA VORTAC at 4,000 feet. -
 2022-05-26
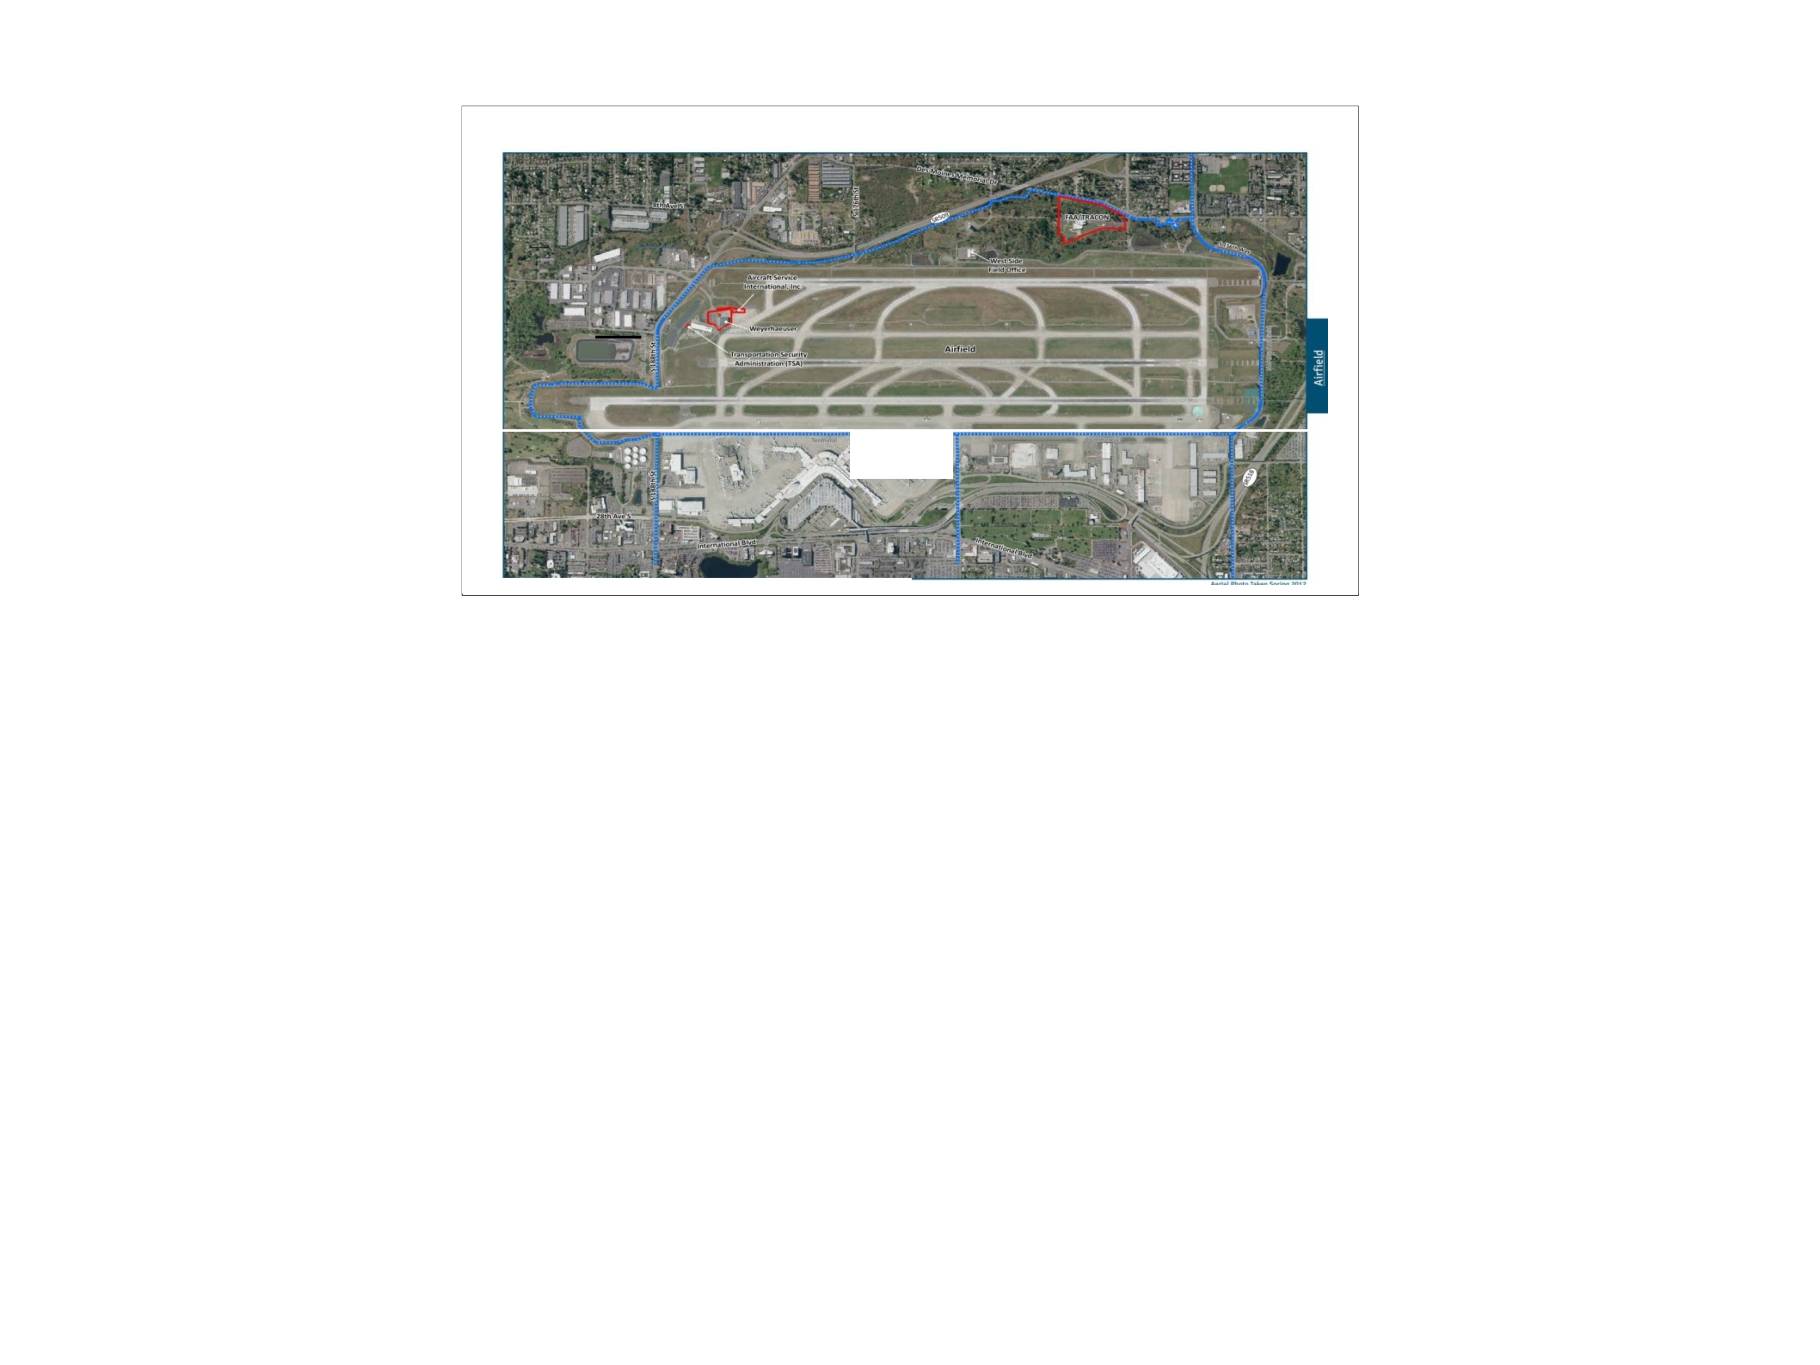
Air Quality Monitoring (AQM) Presentation: Sea-Tac Airport Flight Tracks and Airfield Overview
This document contains airfield mapping and flight-track data related to Seattle-Tacoma International Airport (Sea-Tac), showing Port of Seattle lease boundaries, zone match lines, and recorded aircraft flight paths in the surrounding region. It includes a radar playback capture from August 14, 2019, depicting a FedEx 397 missed approach and an Alaska 807 departure with a non-standard turn at approximately 2,130 feet MSL. The materials appear to be part of an airport noise or operations review archive documenting aircraft movement patterns around Sea-Tac. -
 2021-03-24
Public comment on flight path dispersion for Sea-Tac Airport departures, Highline Forum meeting
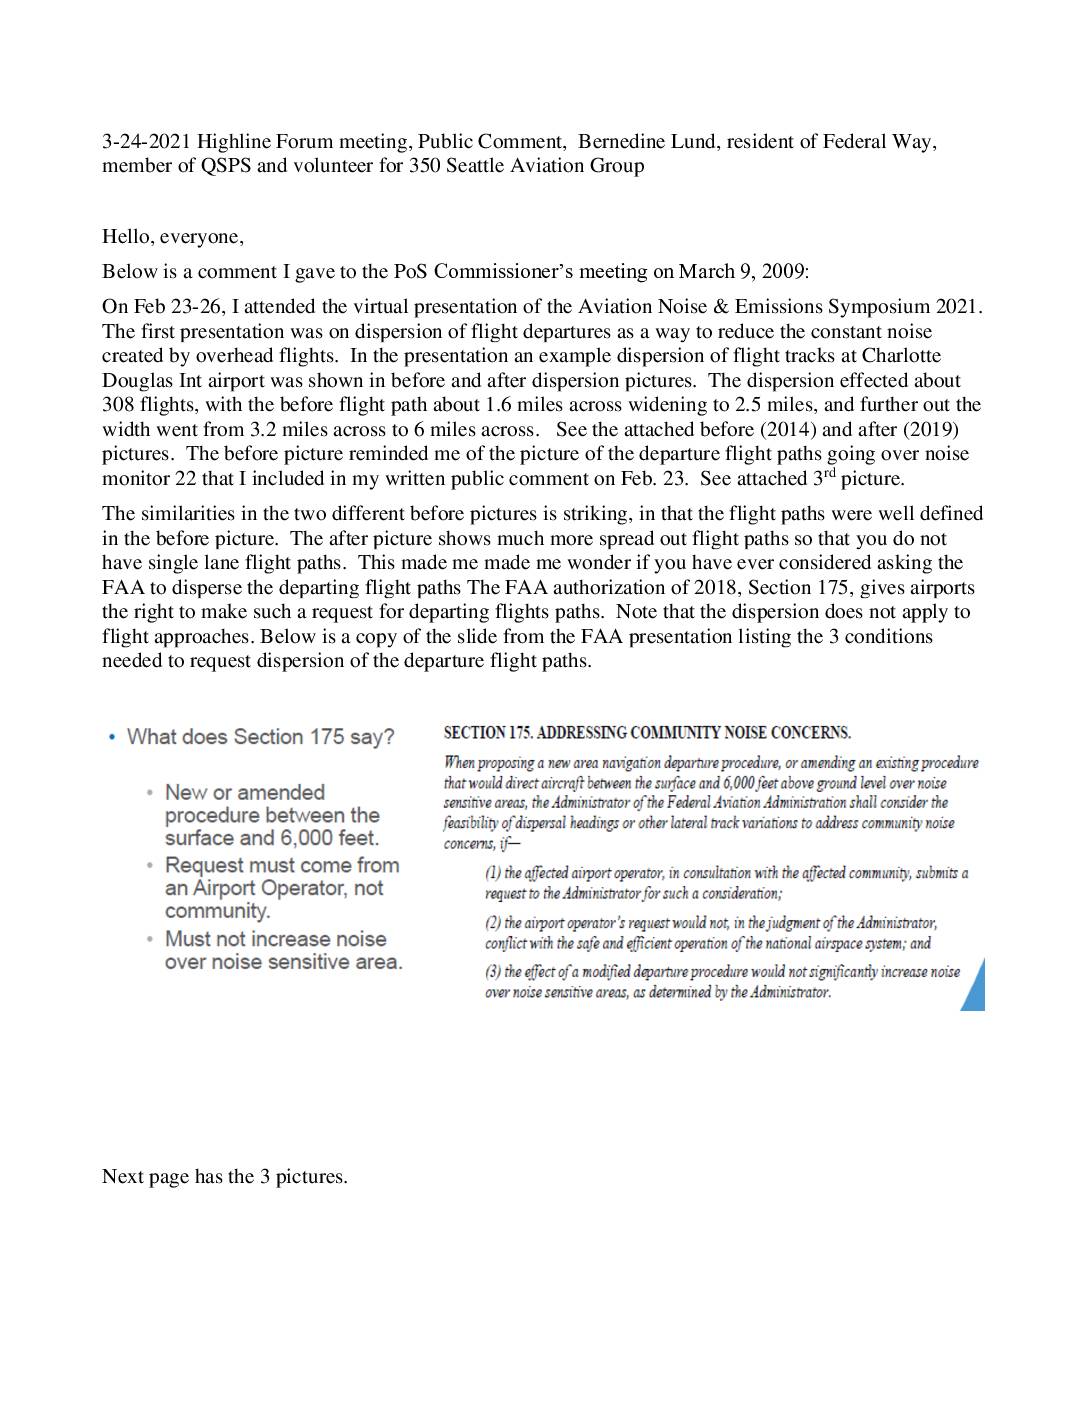
In a March 2021 public comment to the Highline Forum, Federal Way resident Bernedine Lund urged Sea-Tac Airport officials to request that the FAA disperse departure flight paths to reduce concentrated aircraft noise over residential areas. Drawing on examples from the 2021 Aviation Noise & Emissions Symposium, she highlighted how Charlotte Douglas International Airport successfully spread departure tracks from a 1.6-mile-wide corridor to 2.5 miles, and noted that similar tightly clustered flight paths exist over Federal Way. She pointed to FAA Reauthorization Act of 2018, Section 175, which allows airport operators—in consultation with affected communities—to formally request dispersal of departure procedures between the surface and 6,000 feet, provided the change does not increase noise over sensitive areas. -
 2020-10-27
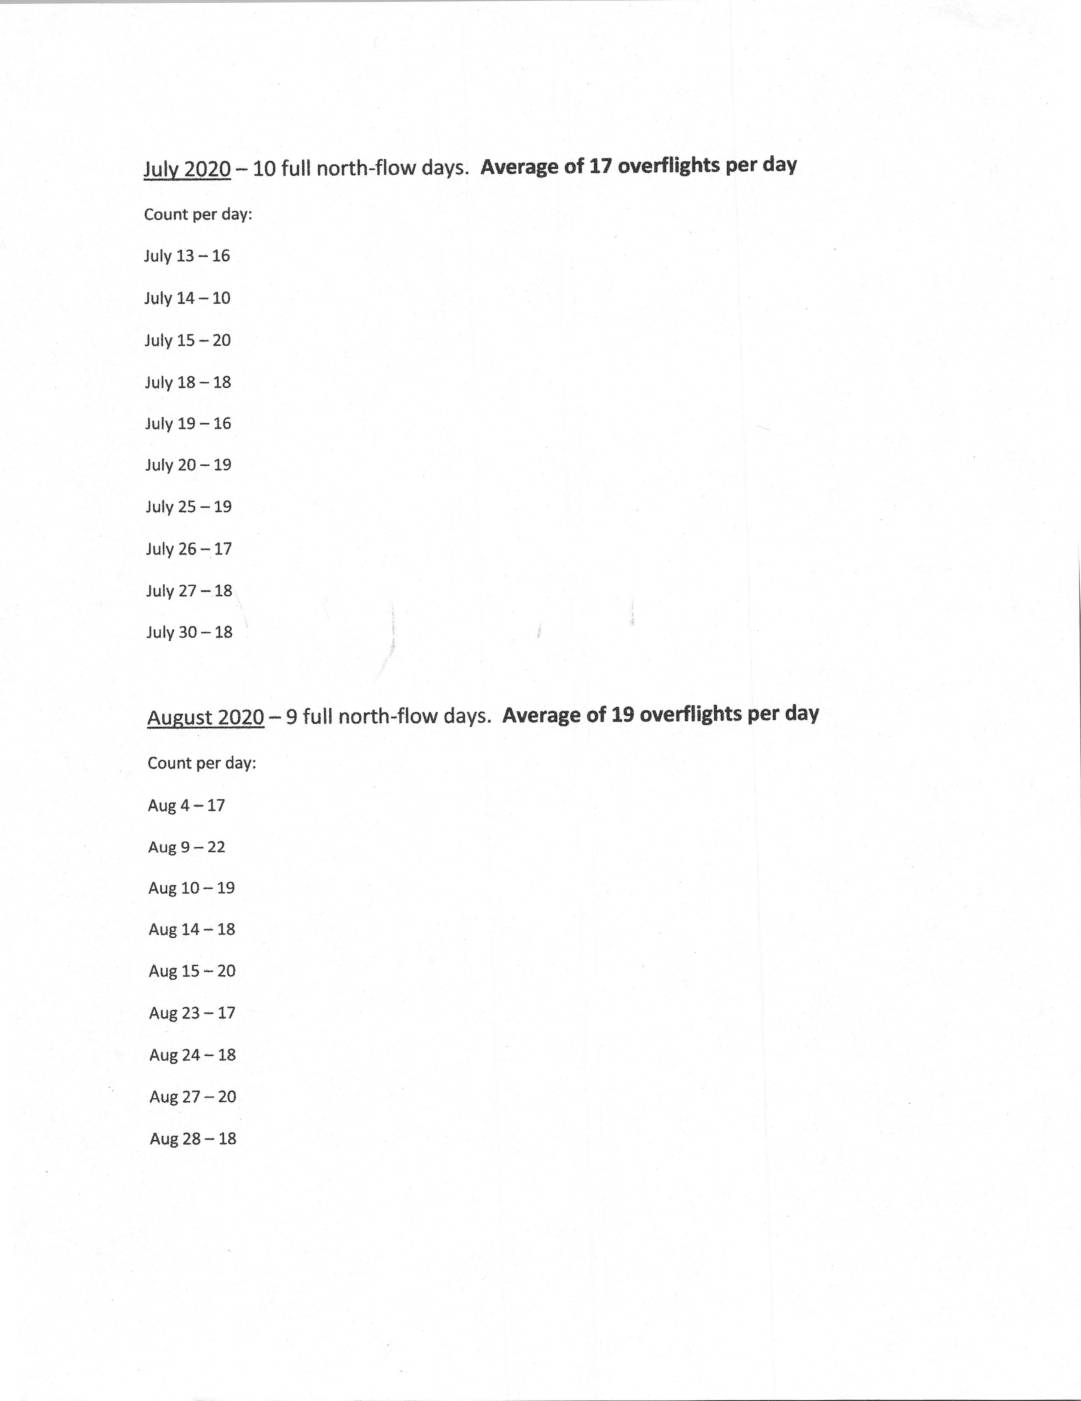
Average number of Horizon Air Q400s proceeding on the westbound 250 degree turn over Burien during full north-flow days
This October 27, 2020 document from Seattle-Tacoma International Airport tracks the average daily number of Horizon Air Q400 turboprop aircraft making a westbound 250-degree turn over the city of Burien during full north-flow operating days. Data from July and August of both 2019 and 2020 show daily overflight counts ranging from 10 to 22 aircraft, with monthly averages rising from 16 overflights per day in summer 2019 to 17–19 overflights per day in summer 2020. The records appear intended to document trends in aircraft noise exposure for residents living under that flight path.