TagSea-Tac Airport(1835)
-
 2002-02-18
EXH 382: AR021693 — Aerial/Ground Photo STIA Third Runway Area
This document, marked as Exhibit No. 382 from the Bailey proceeding dated 2-18-02, contains a photographic image that appears to show an aerial or ground-level view of a landscape, likely related to environmental or noise impact evidence near Sea-Tac Airport. The photograph, originally a high-resolution JPEG (1360x1020x24b), depicts what appears to be a roadway or runway corridor surrounded by terrain. It is part of the administrative record (AR 021693) compiled in connection with Sea-Tac Airport noise policy litigation or regulatory proceedings. -
 2002-02-18
EXH 383: Third Runway EIS Photographs (AR 021694–021696)
These three pages (AR 021694–021696) are black-and-white photographic exhibits entered into the administrative record as Exhibit No. 383 on February 18, 2002, in the Bailey proceeding before M. Green. The images, originally digital JPEG files at 1360×1020 resolution, appear to depict aerial or close-up views of terrain or surface conditions, likely submitted as visual evidence related to noise-impact or environmental conditions at or near Sea-Tac Airport. The poor reproduction quality of the scanned photos makes specific details difficult to discern. -
 2002-02-16
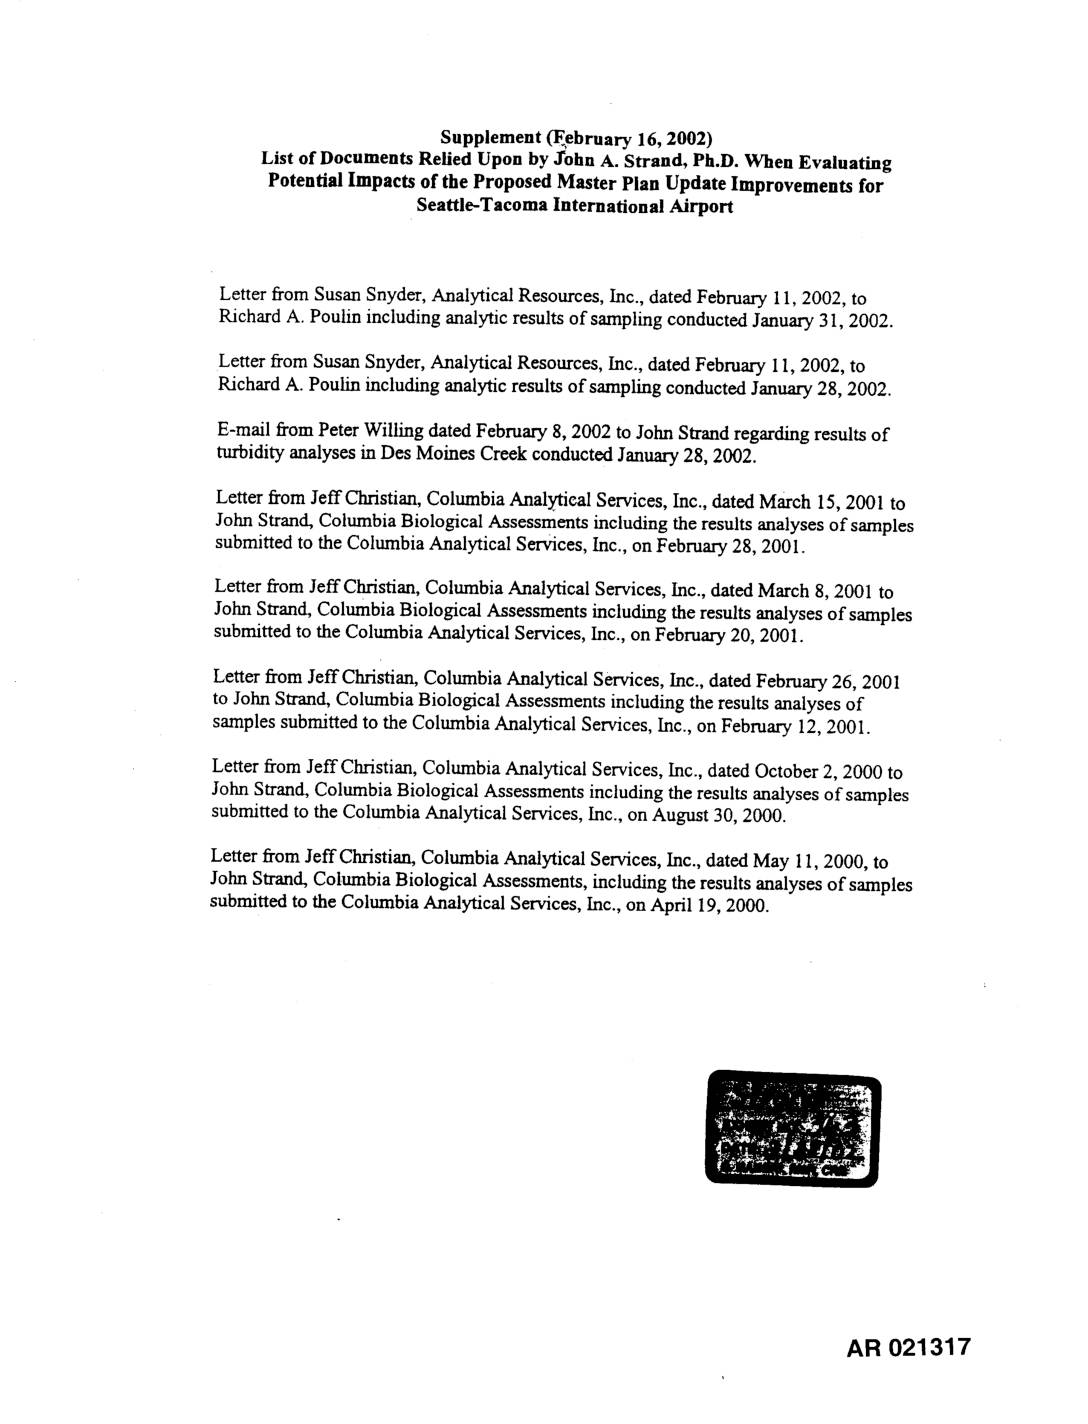
EXH AR021317: Supplement Feb 16 2002 — Docs Relied Upon by John A. Strand PhD STIA Master Plan Update EIS Evaluation
This February 2002 supplement lists the technical documents relied upon by environmental scientist John A. Strand, Ph.D., when assessing the potential environmental impacts of proposed improvements outlined in Seattle-Tacoma International Airport's Master Plan Update. The documents primarily consist of laboratory analysis letters from Columbia Analytical Services and Analytical Resources, Inc., covering water quality sampling results collected between 2000 and 2002. An email regarding turbidity measurements in Des Moines Creek is also included, suggesting a focus on water quality impacts near the airport. -
 2002-02-15
EXH AR053402: STIA Third Runway Embankment Fill Water Quality and Transport Analysis
Final report prepared by S.S. Papadopulos & Associates, Inc. for Port Of Seattle, dated February 15, 2002, analyzing water quality and contaminant transport from embankment fill materials used in the Seattle-Tacoma International Airport Third Runway construction. AR 053402. Covers embankment fill soil criteria, water-quality criteria, chemical analysis of soils, adsorption capacity, Synthetic Precipitation Leaching Procedure -
 2002-02-15
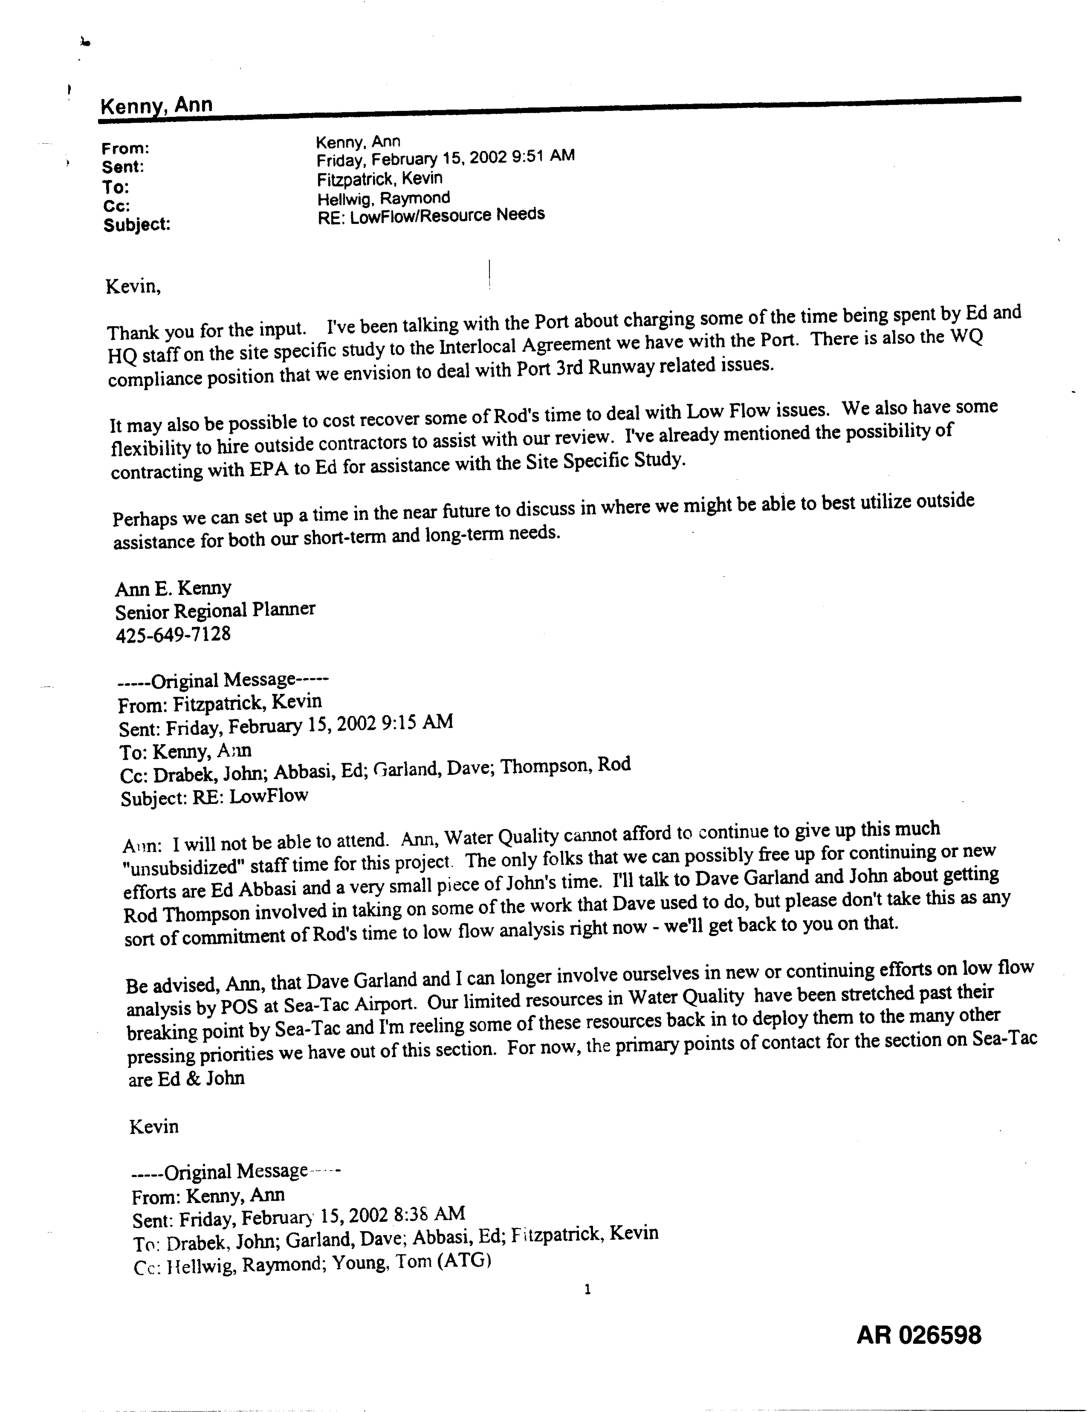
EXH AR026598: Email Chain — Low Flow/Resource Needs, Ecology Water Quality Program STIA Third Runway
In February 2002, Washington State Department of Ecology staff exchanged emails about resource constraints in reviewing the Port of Seattle's Low Streamflow Report related to Sea-Tac Airport's Third Runway project. Water Quality section chief Kevin Fitzpatrick warned that his team's resources were stretched to a breaking point and that senior staff could no longer participate in low flow analysis, leaving Ed Abbasi and John Drabek as primary contacts. Senior Regional Planner Ann Kenny explored options to offset costs, including billing staff time to an Interlocal Agreement with the Port and potentially contracting with the EPA for technical assistance. -
 2002-02-08
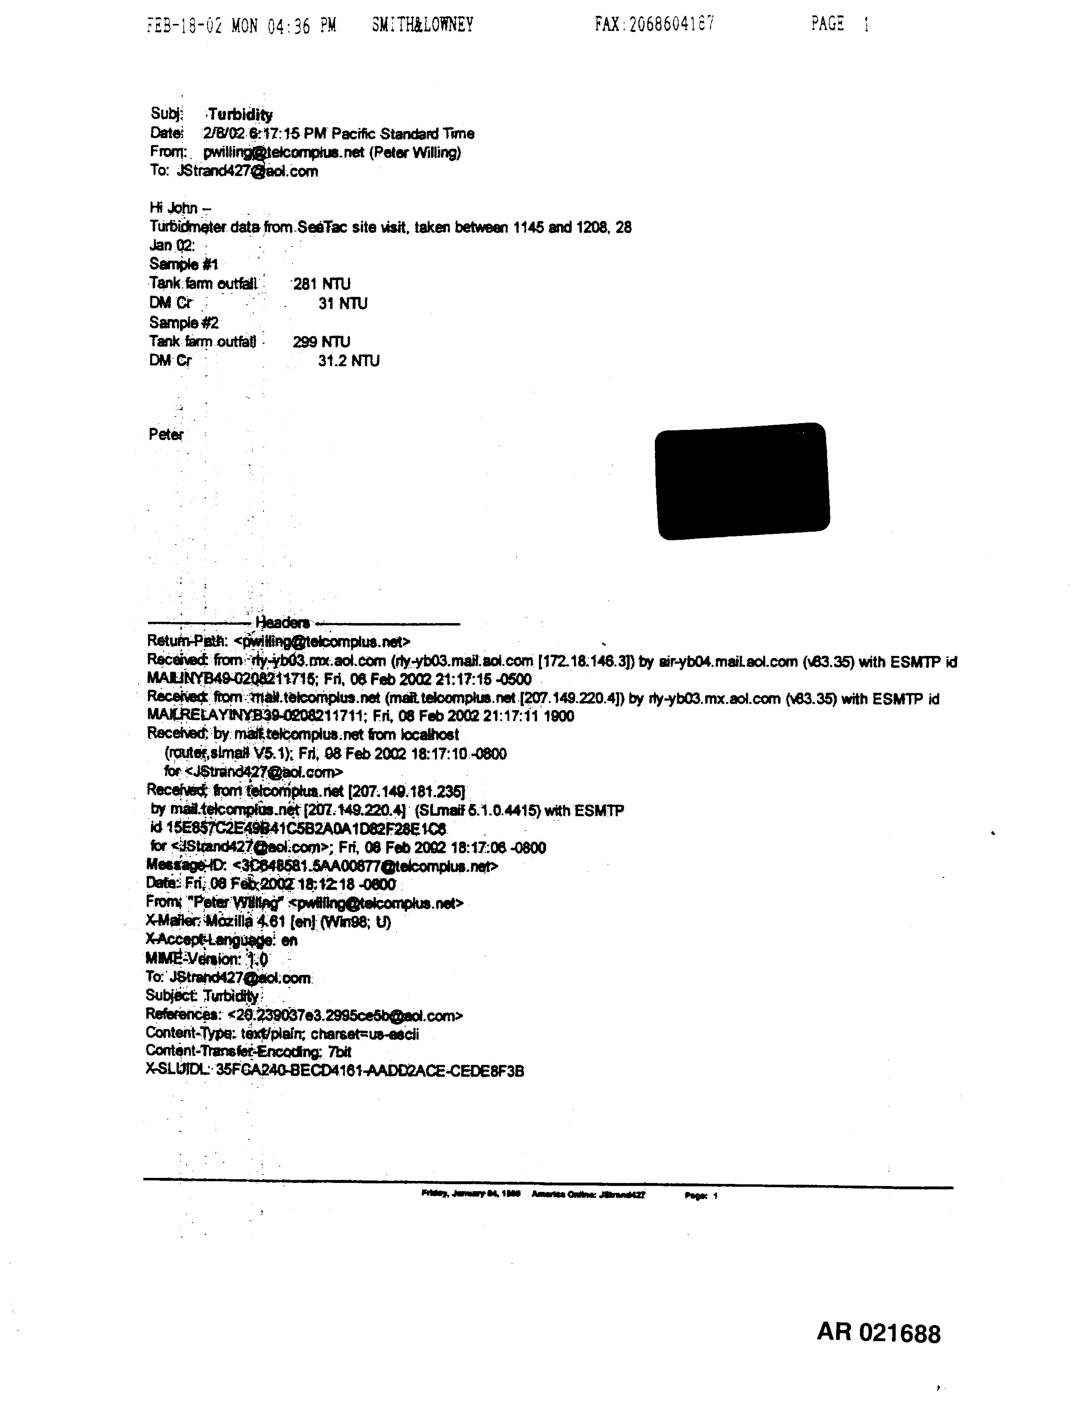
EXH AR021688: Turbidity Data Email — Sea-Tac Tank Farm Outfall vs. DM Creek, Jan 28, 2002
An email dated February 8, 2002, from Peter Willing to John Strand reports turbidity measurements taken during a site visit at Sea-Tac on January 28, 2002, between 11:45 and 12:08. Two samples were recorded: Sample #1 showed tank farm outfall at 281 NTU and DM Creek at 31 NTU, while Sample #2 showed tank farm outfall at 299 NTU and DM Creek at 31.2 NTU. The data indicates significantly elevated turbidity levels at the tank farm outfall compared to the creek reference point. -
 2002-02-07
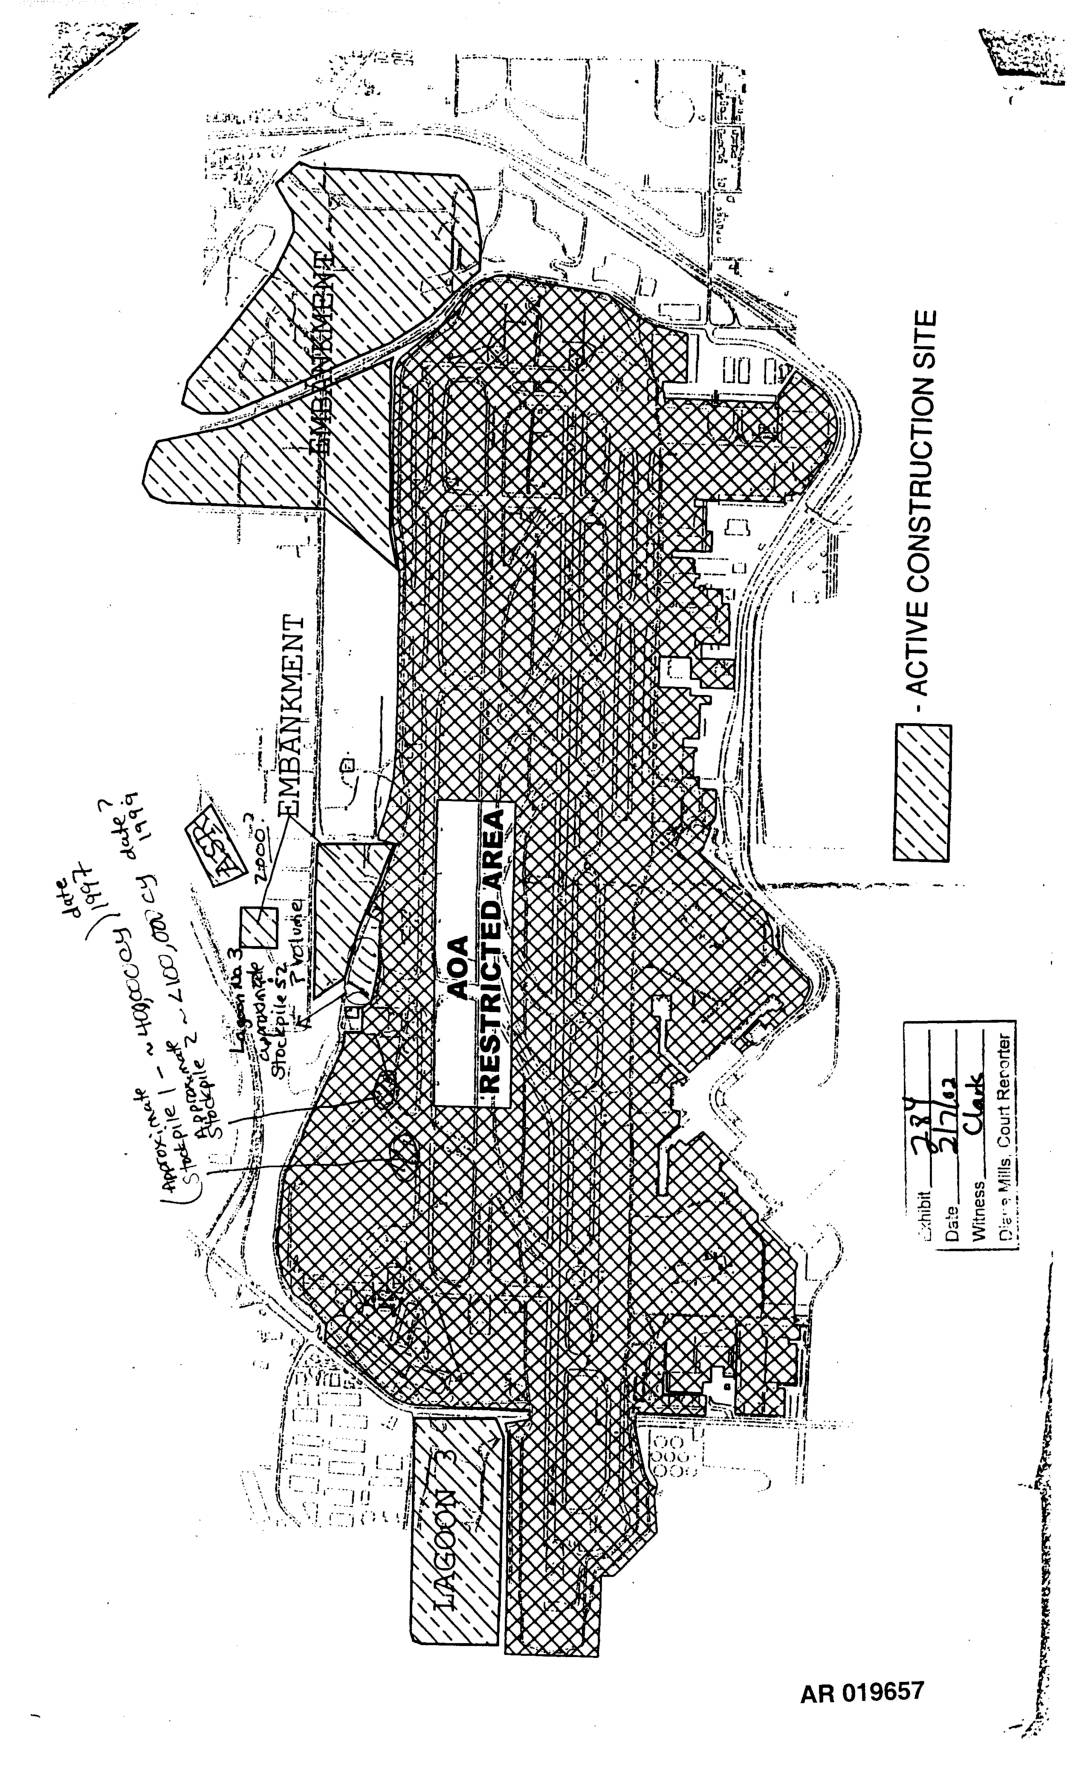
EXH 284: STIA Third Runway Active Construction Site Map AOA Restricted Area Embankment Lagoon Stockpile
This document (AR 019657) is a site map of an active construction area at what appears to be Sea-Tac Airport, showing a restricted AOA (Air Operations Area) zone, embankments, and Lagoon 3. Handwritten annotations reference two stockpiles dated 1997 and 1999, with approximate volumes of 400,000 cubic yards and 2,100,000 cubic yards respectively. The map was entered as Exhibit 284 on 2/7/02, with witness Clark and court reporter Diane Mills. -
 2002-02-05
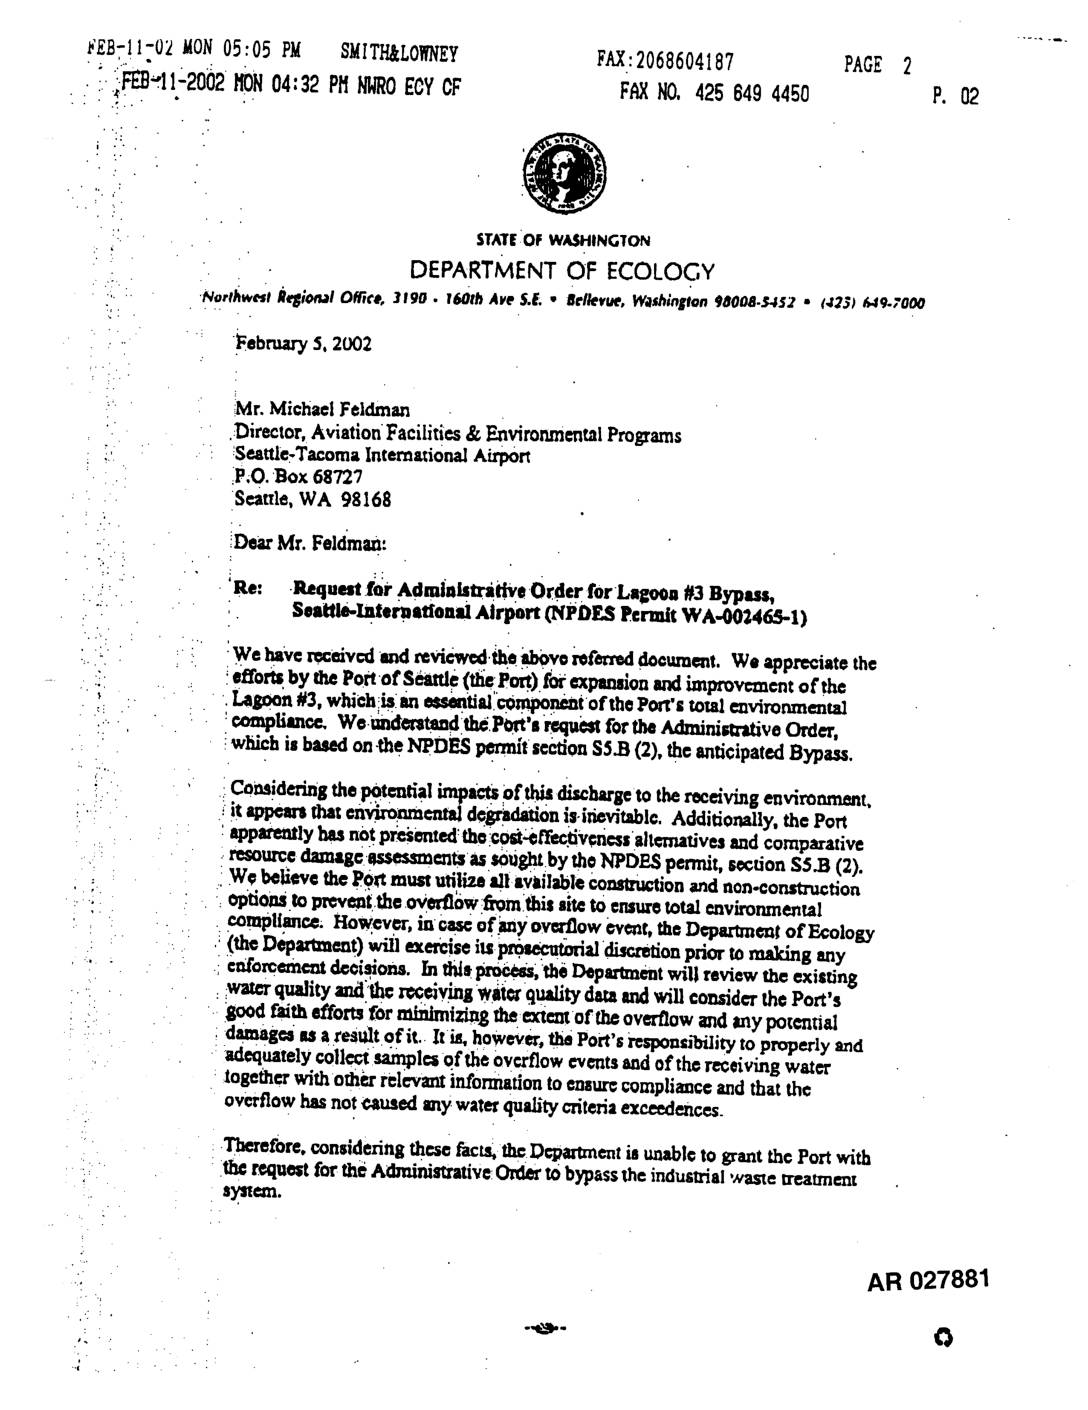
EXH AR027881: Ecology Letter to Port Of Seattle Denying Administrative Order for Lagoon #3 Bypass at STIA
Letter dated February 5, 2002 from Hamid ‘Ed’ Abbasi, Environmental Engineer, Washington State Department of Ecology (NWRO) to Michael Feldman, Director of Aviation Facilities & Environmental Programs, Seattle-Tacoma International Airport. Ecology denies the Port Of Seattle’s request for an Administrative Order to bypass the industrial waste treatment system at Lagoon #3 under NPDES Permit WA-002465-1, -
 2002-02-01
Exhibit 706: Deposition of Thomas Luster, PCHB No. 01-160, Airport Communities Coalition v. Department of Ecology and Port Of Seattle
Deposition upon oral examination of Thomas Luster, taken February 1, 2002, in PCHB No. 01-160, Airport Communities Coalition (ACC) v. Department of Ecology and Port Of Seattle. Luster, represented by Richard A. Smith of Smith & Lowney, was deposed by Gillis E. Reavis (Marten Brown) for Port Of Seattle and Thomas J. Young (Assistant Attorney -
 2002-01-31
EXH AR053382: Vacca Farm and West Side Observations – Handwritten Field Notes, January 31, 2002
Handwritten field observation notes by R. Azous (Azous Exhibit 387, dated 2-19-02) transmitted via fax from Helsell Fetterman LLP on 02-19-2002, documenting site visits to Vacca Farm and West Side areas adjacent to Miller Creek and STIA. Notes cover wetland conditions, plant communities (cattail, alder, Juncus, Phalaris, Sparganium, sedge), upland buffer zones, NRM planting plan