TagPort Of Seattle(2349)
-
 2023-06-07
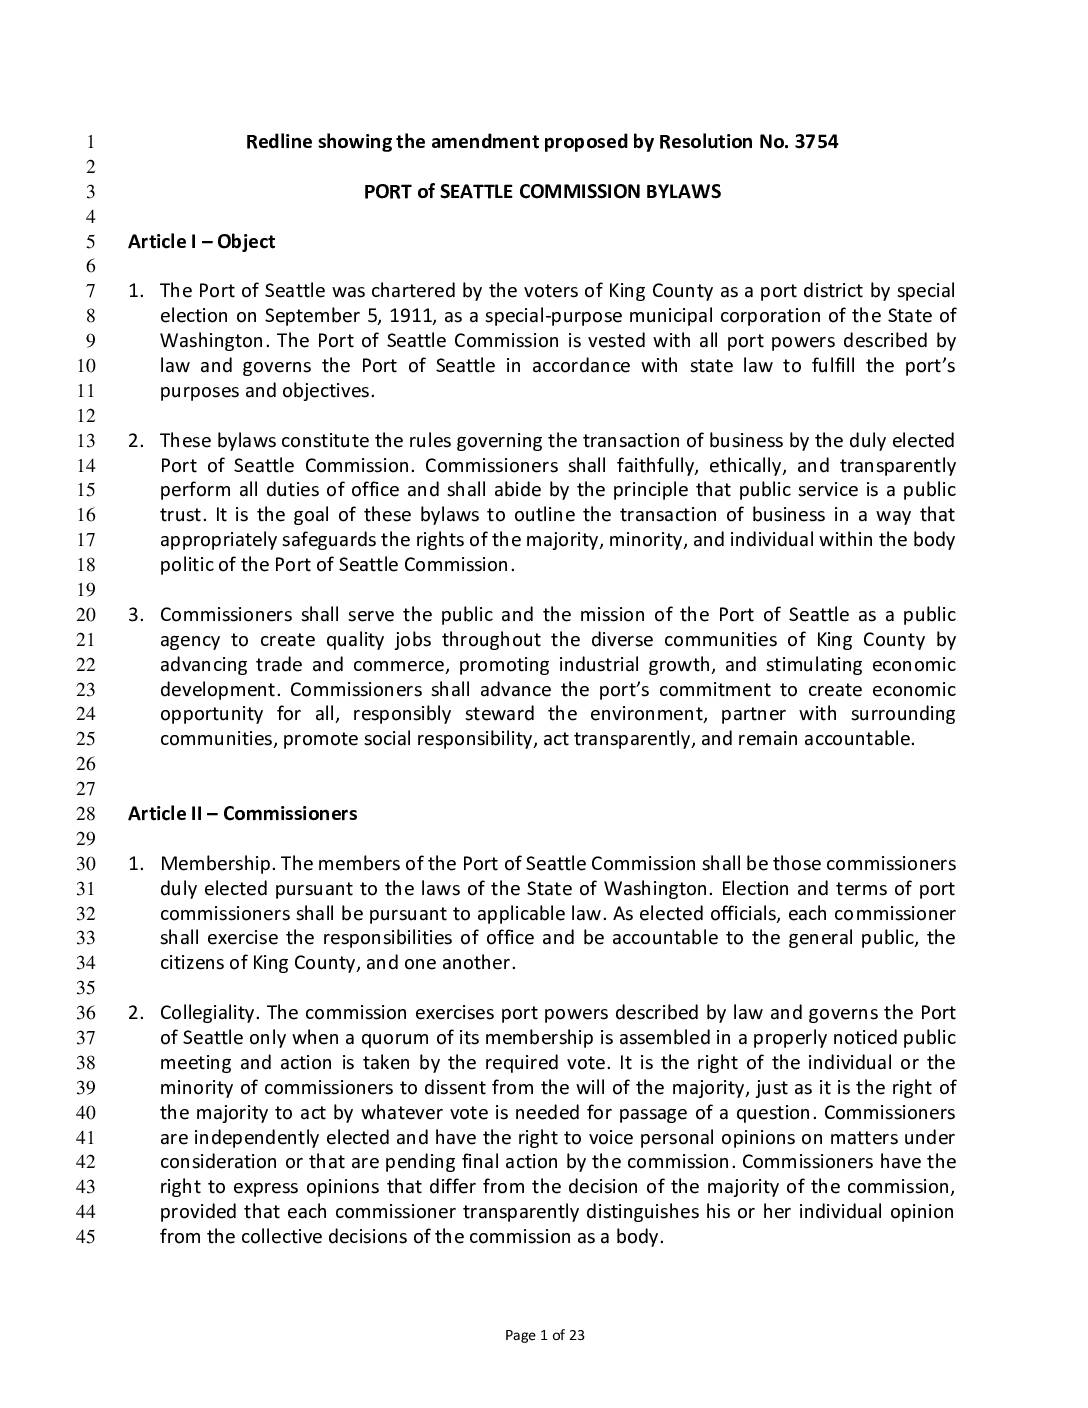
Port Of Seattle Commission bylaws
The Port of Seattle Commission Bylaws establish the rules governing how the five elected commissioners conduct official business, including requirements for ethical conduct, transparency pledges, conflict-of-interest recusals, and filling vacancies in office. Commissioners are bound to serve the public mission of creating jobs and economic development in King County while adhering to open-government standards under Washington State's Open Public Meetings Act and Public Records Act. These bylaws are proposed for amendment under Resolution No. 3754. -
 2023-06-07
Sea-Tac Stakeholder Advisory Round Table update
The Sea-Tac Stakeholder Advisory Round Table (StART) is a community forum created by the Port of Seattle to encourage cooperative input and identify solutions to airport-related concerns. Following prioritization discussions in early 2018, the group agreed to focus specifically on aviation noise. A dedicated working group was established to research and recommend near-term actions to prevent and reduce noise impacts on surrounding communities. -
 2023-06-07
Airport Community Ecology (ACE) Fund Highline Forum update
The Airport Community Ecology (ACE) Fund is a Port of Seattle Commission-directed $1 million initiative supporting park improvements and environmental projects in the communities of Burien, Des Moines, and SeaTac. The fund is split into two programs: a $550,000 Small Matching Grants Program administered directly by the Port for small-scale community projects, and a $450,000 Green Cities Partnership Program contracted through Forterra for large-scale urban forestry efforts, including historic Elm tree planting along Des Moines Memorial Drive. -
 2023-06-07
Highline Forum: South King County Support Program update
In November 2018, the Port of Seattle Commission established the South King County Support Program, dedicating up to $10 million (with $750,000 budgeted for 2019) to provide resources and support to communities surrounding Sea-Tac International Airport. Program development is focused on setting guiding principles, identifying near-term projects, and ensuring equitable community engagement. The initiative aims to deliver both short-term and long-term benefits to affected South King County residents. -
 2023-06-07
Sea-Tac Stakeholder Advisory Round Table annual report
The Sea-Tac Stakeholder Advisory Round Table (StART) is a forum created by the Port of Seattle to strengthen relationships between Sea-Tac Airport and six neighboring communities, working cooperatively to identify issues and possible solutions. Development of StART began in mid-2017, with each city appointing two community members and one city employee to participate, alongside the Airport's Managing Director as chair. Airlines Alaska and Delta, as well as Lynden, also serve as members of the round table. -
 2023-06-07
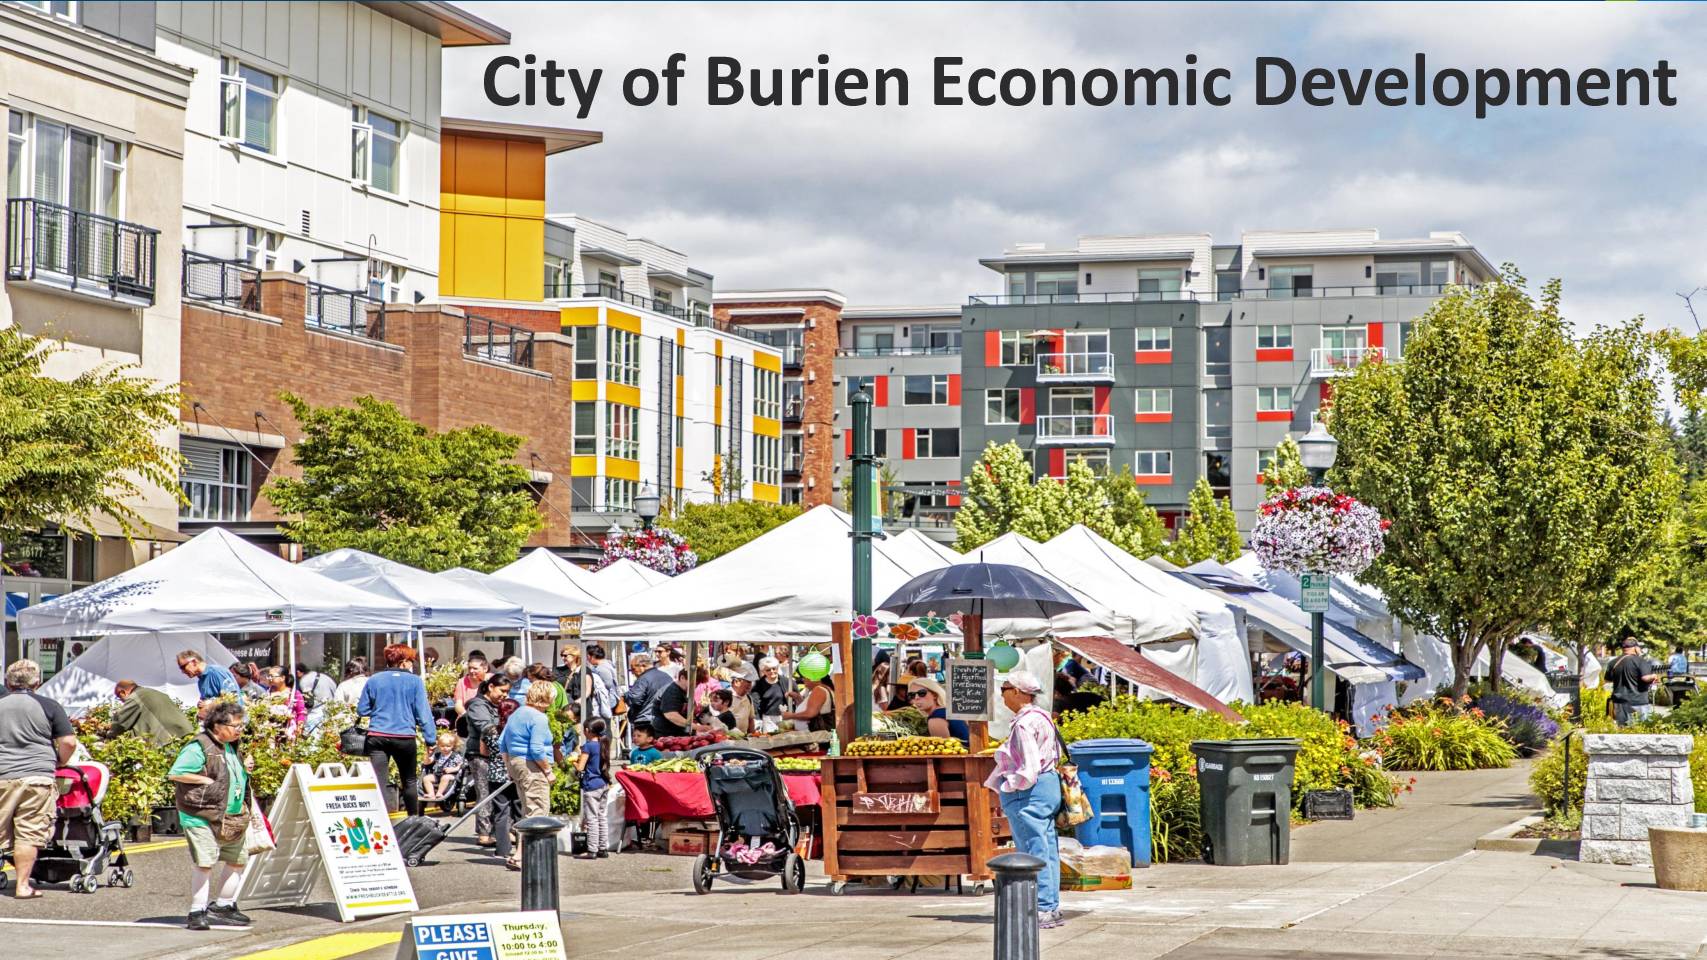
City of Burien economic development
The City of Burien's Economic Development program supports local businesses through microenterprise programs, small business grants, maker spaces, and a Digital Main Street Program. The city also promotes visitor attraction and community engagement via social media channels, a business e-newsletter, citywide business surveys, and tourism videos. Several initiatives are funded in part by the Port of Seattle. -
 2023-06-07
City of Des Moines Port Economic Development Partnership grants
The City of Des Moines received Port Economic Development Partnership Grants that were used to support the redevelopment planning of the Des Moines Marina, covering design feasibility, financial feasibility, and the issuance of a Request for Qualifications. The city matched the grant funding by at least 100%, and the grants also helped fund the EATS program, which delivered meals to seniors and veterans while supporting local restaurants. City officials expressed gratitude for the support, noting it could help catalyze future investment opportunities in the city and marina. -
 2023-06-07
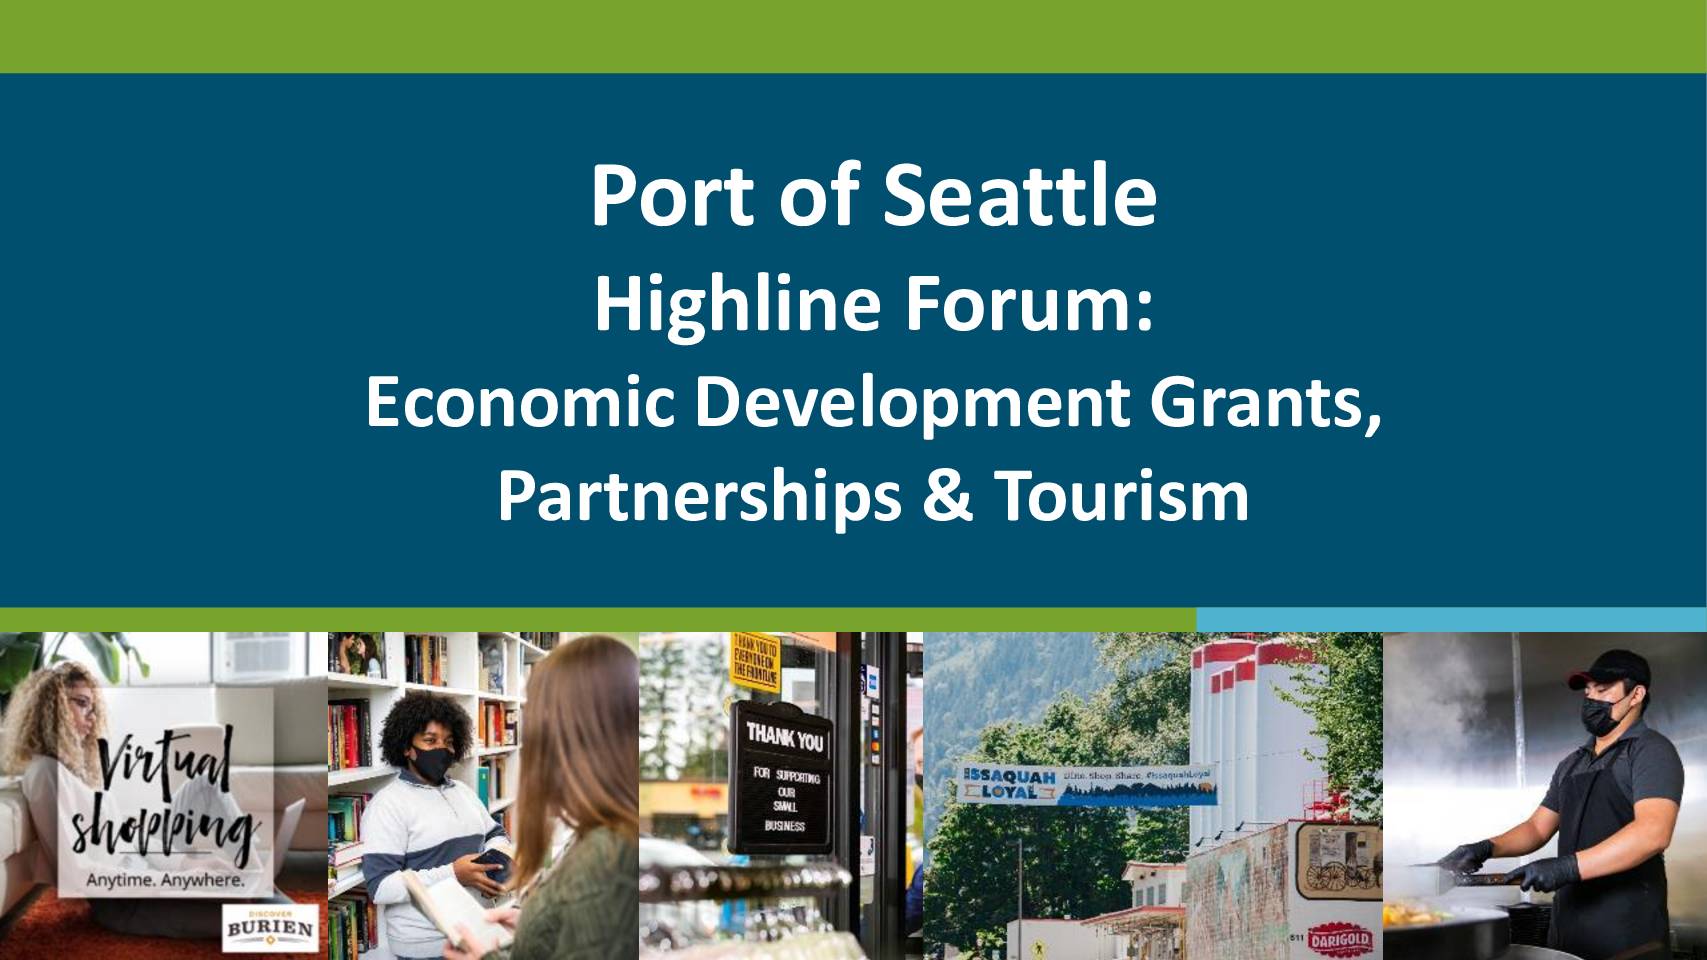
Port Of Seattle Highline Forum: Economic development grants, partnerships & tourism
The Port of Seattle presented an overview of its Economic Development Partnership Grant Program, created in 2016, which provides King County cities per capita funding (capped at $60,000, with a $5,000 minimum for smaller cities) to support local economic development projects tied to the Port's Century Agenda and business interests. Cities are required to provide a 50% local match, either monetary or in-kind, to qualify for the grants. The forum also covered the Business Navigator Initiative and Tourism Recovery efforts aimed at supporting regional businesses and communities near Seattle-Tacoma International Airport. -
 2023-06-07
SEA sound insulation programs
The Port of Seattle's SEA Sound Insulation Programs presentation, led by Sr. Manager Stan Shepherd, outlines efforts to reduce aircraft noise impacts on nearby residents. Following Commission Motion 2020-4, the Port committed to accelerating its Sound Insulation Program with a completion target of 2026, supported by newly hired staff, over 70 additional Port employees, and two consulting firms for construction services. The update also covers program status and funding considerations. -
 2023-06-07
Airport noise programs overview
This presentation by Stan Shepherd, Senior Manager of Airport Noise Programs at Seattle-Tacoma International Airport, provides an overview of SEA's key noise management initiatives. The programs covered include Noise Abatement (such as flight procedure monitoring and the Fly Quiet program), the StART stakeholder roundtable, noise monitoring, noise mitigation, and community outreach. Together, these efforts reflect the airport's commitment to reducing the impact of aircraft noise on surrounding communities.