TagPort Of Seattle(2349)
-
 2020-01-01
SEA Stakeholder Advisory Round Table 2020 annual report
The SEA Stakeholder Advisory Round Table (StART) 2020 Annual Report, presented by Port of Seattle staff and a consultant, outlines the group's activities and achievements for the year, including work by the Aviation Noise Working Group and the Federal Policy Working Group. The report covers 2020 highlights and accomplishments, facilitator reflections, and tentative priorities for 2021 meetings. StART serves as a community advisory forum focused on addressing aviation noise and related policy concerns at Seattle-Tacoma International Airport. -
 2020-01-01
Port Of Seattle 2020 budget
The Port of Seattle's 2020 Budget document, prepared by the Finance and Budget Departments, outlines the financial plan and operational guide for the Port for the fiscal year beginning January 1, 2020. The Port previously received a Distinguished Budget Presentation Award from the Government Finance Officers Association (GFOA) for its 2019 budget, recognizing it as an effective policy document, financial plan, operations guide, and communications device. The 2020 budget has been submitted to the GFOA for consideration of the same award. -
 2019-12-31
Comprehensive annual financial report: As of December 31, 2019 and 2018, and for the years ended December 31, 2019, 2018, and 2017
The Port of Seattle's 2019 Comprehensive Annual Financial Report covers the port's financial activity as of December 31, 2019 and 2018, and for the fiscal years ending 2019, 2018, and 2017. Prepared by the Port's Accounting and Financial Reporting Department, the report includes audited financial statements, management analysis, pension and benefits disclosures, and ten-year statistical trends for the enterprise that oversees Seattle-Tacoma International Airport and related maritime facilities. While primarily a financial document, it provides official context for understanding the Port's operational scope and fiscal health during the period. -
 2019-12-31
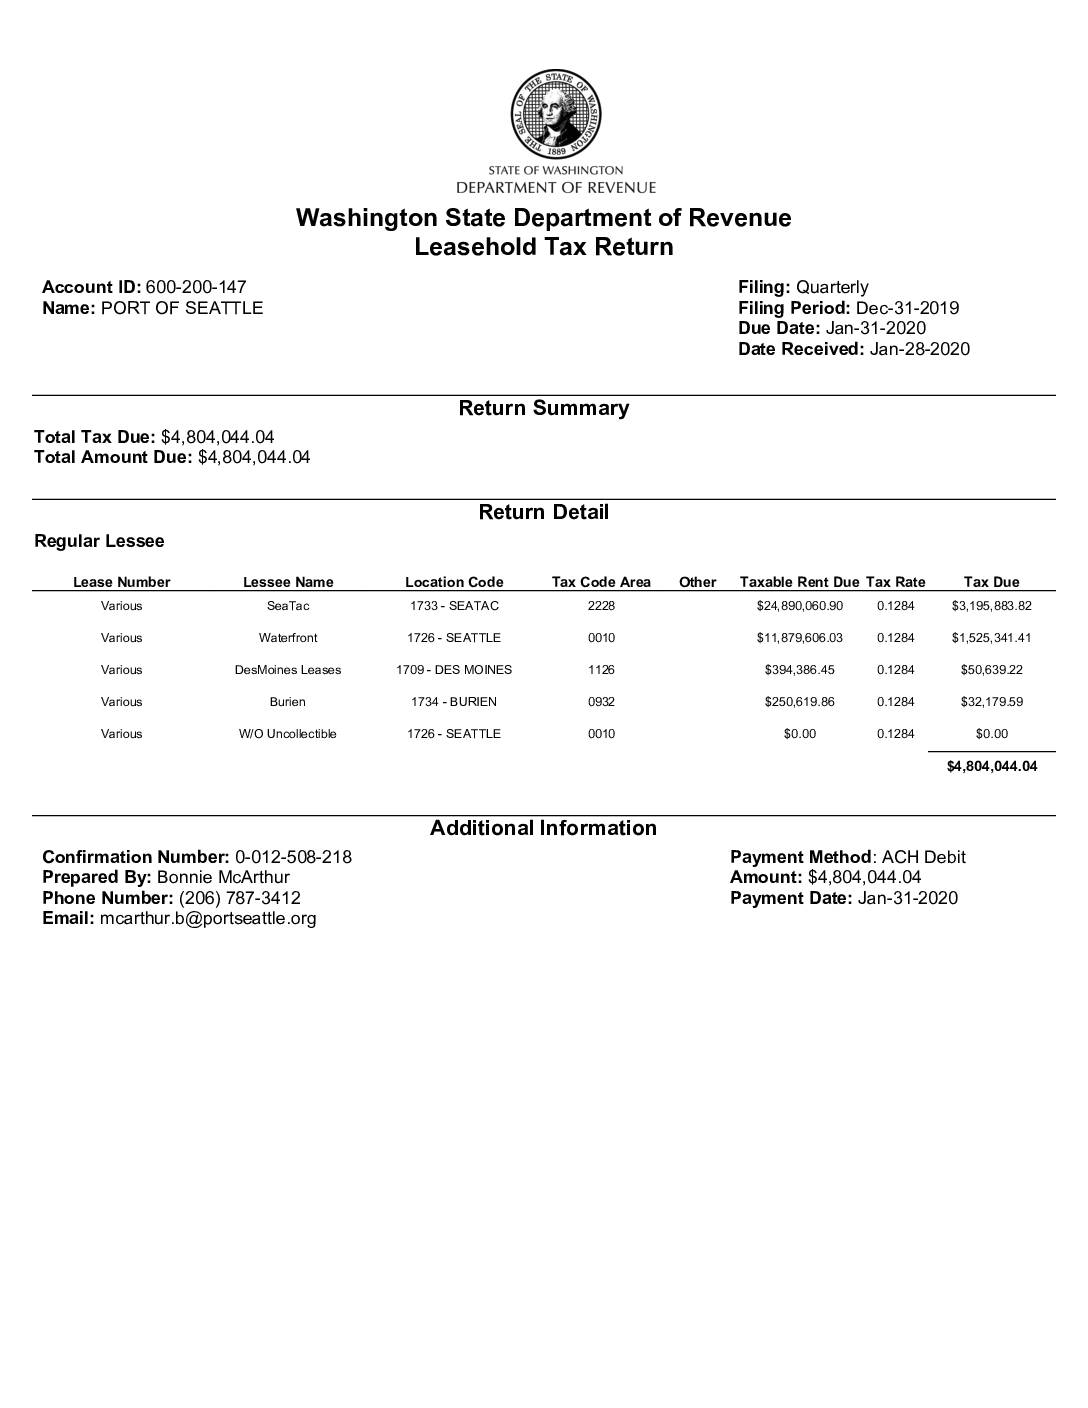
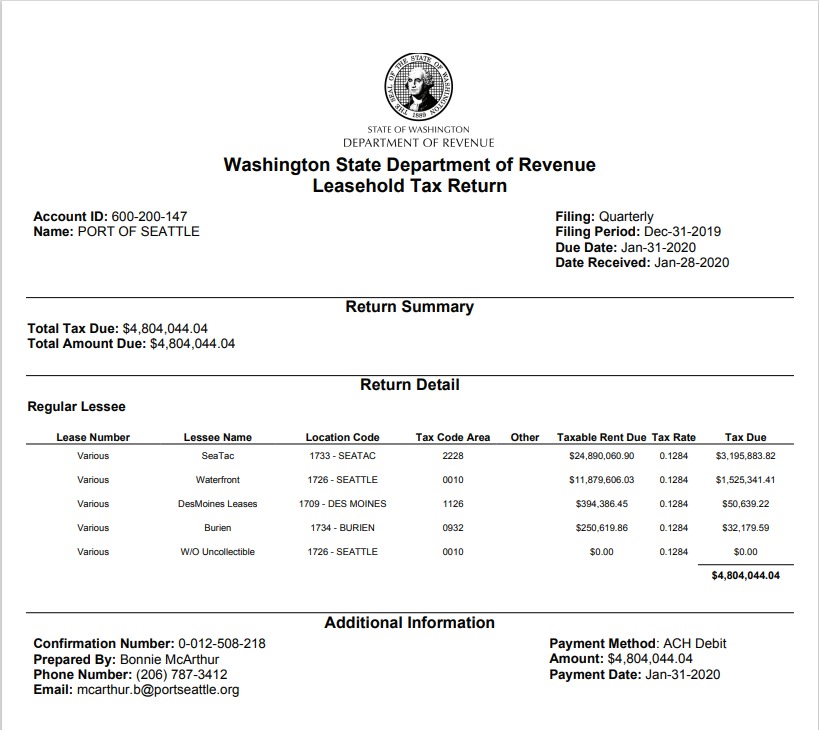
Washington State Department of Revenue Leasehold Tax Return: Port Of Seattle, Q4 2019
The Port of Seattle filed a Washington State Leasehold Tax Return for the quarter ending December 31, 2019, reporting a total tax due of $4,804,044.04. The largest portion—$3,195,883.82—was generated from SeaTac leases with taxable rent of approximately $24.9 million, alongside additional revenue from Waterfront, Des Moines, and Burien locations. Payment of the full amount was submitted via ACH Debit on January 31, 2020, one day before the deadline. -
 2019-12-31
Washington State Department of Revenue Leasehold Tax Return – Port Of Seattle, Q4 2019
This is a Washington State Department of Revenue Leasehold Tax Return (Account ID 600-200-147) filed by the Port of Seattle for the quarterly filing period ending Dec-31-2019, with a total tax due of $4,804,044.04. The return details taxable rent across multiple locations including SeaTac (Location Code 1733), with the largest tax due of $3,195,883.82 on $24,890,060.90 in taxable rent, submitted via ACH Debit on Jan-31-2020. -
 2019-12-31
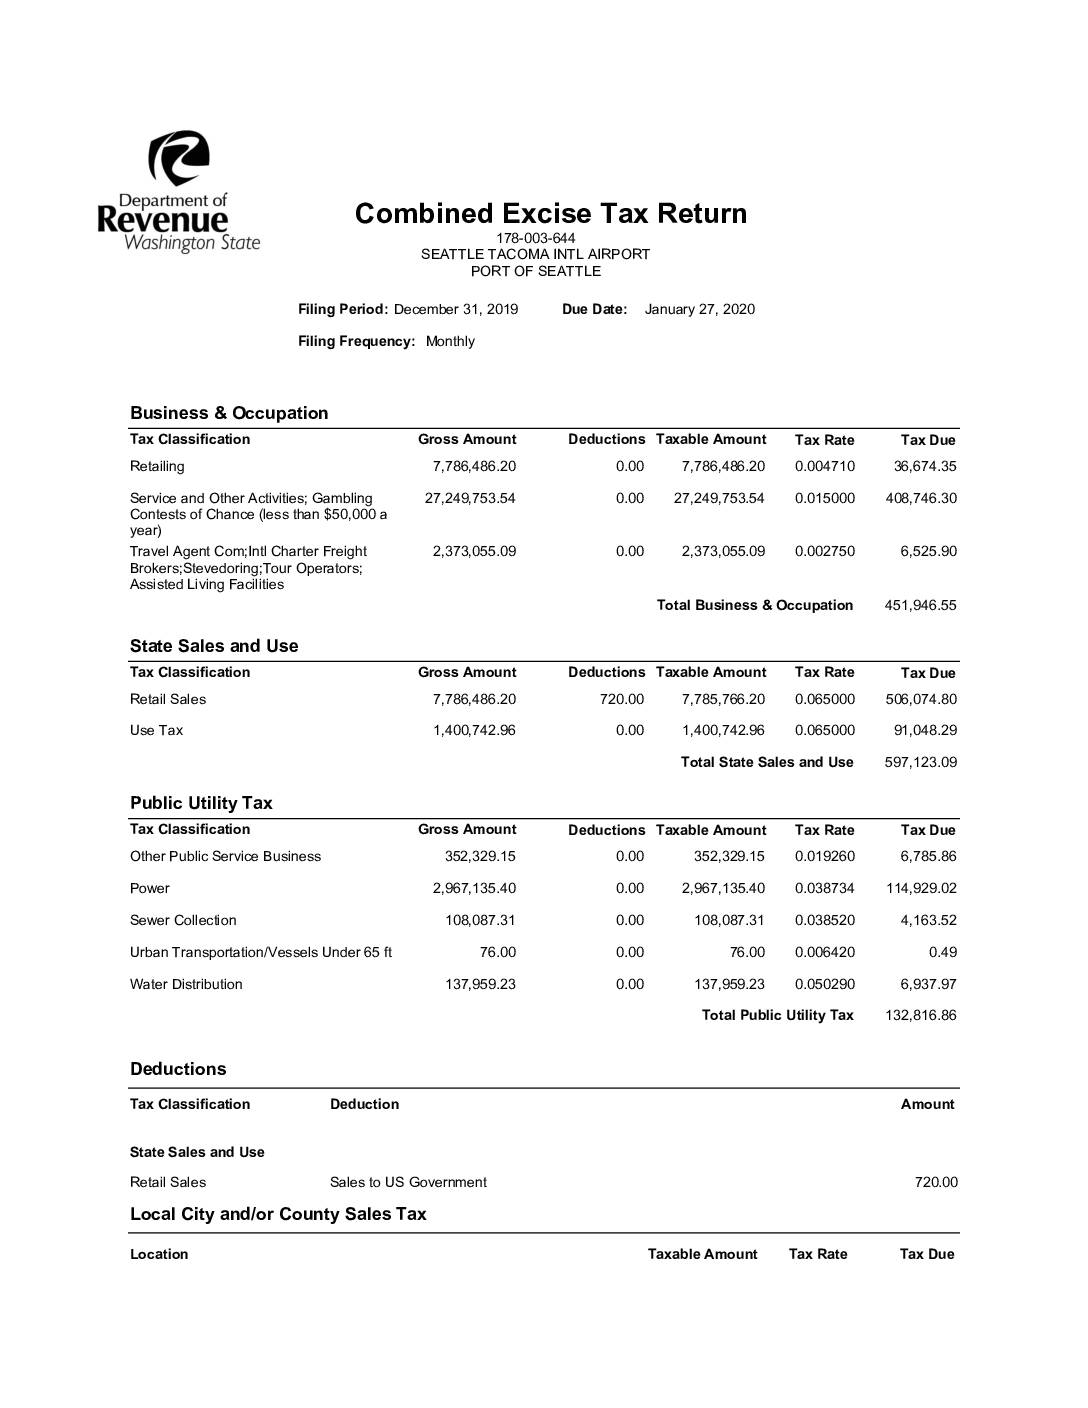
Combined Excise Tax Return: Seattle Tacoma International Airport, Port Of Seattle — December 2019
This is a Combined Excise Tax Return filed by the Port of Seattle for Seattle-Tacoma International Airport, covering the period ending December 31, 2019, with a due date of January 27, 2020. The document details taxes owed across several categories, including Business & Occupation tax, State Sales and Use tax, and Public Utility tax, totaling $1,503,786.56. Payment was submitted on January 23, 2020 via ACH Debit/E-Check by Port of Seattle staff member Bonnie McArthur. -
 2019-12-11
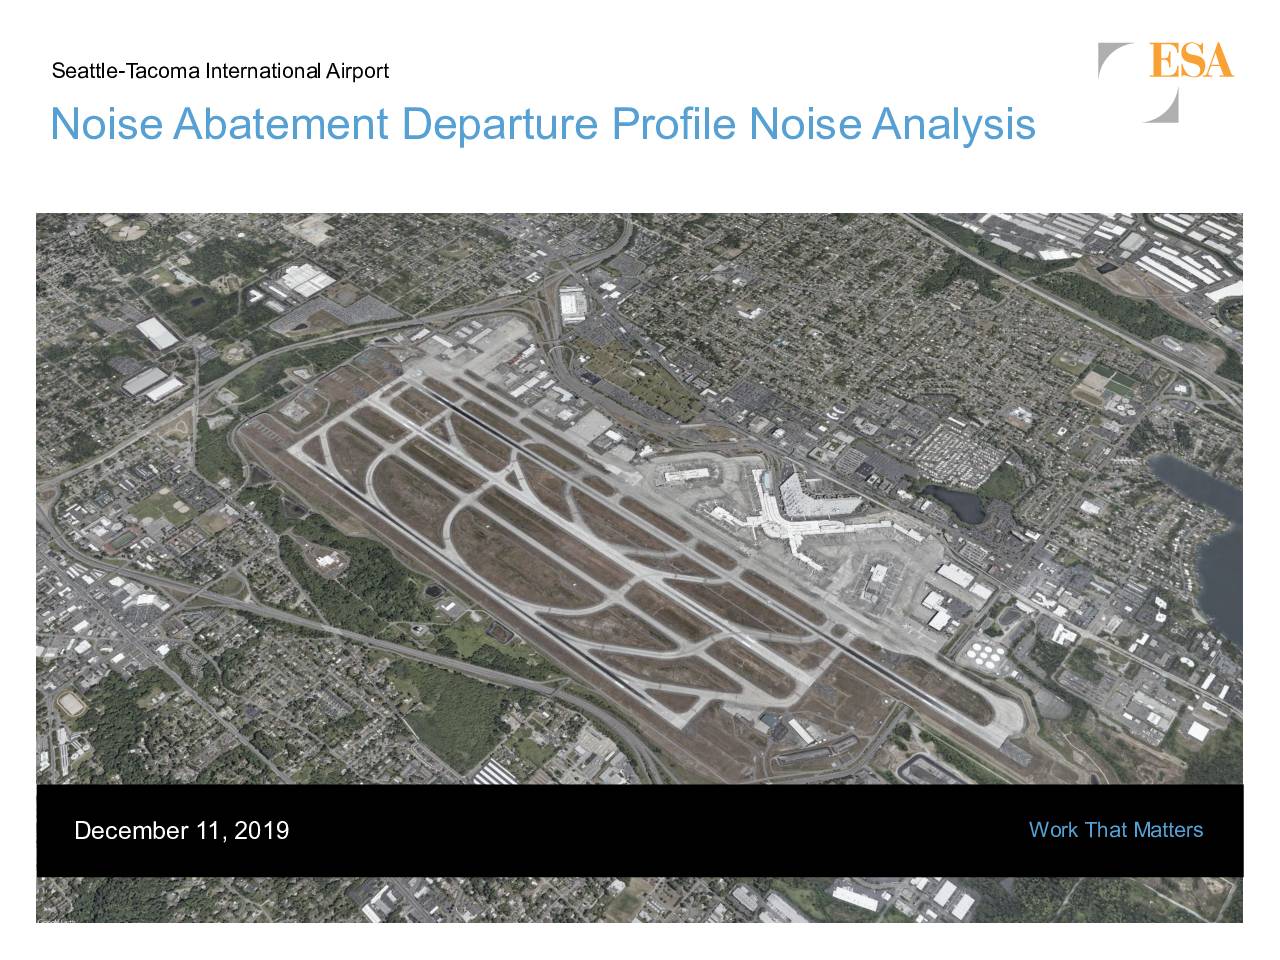
Seattle-Tacoma International Airport noise abatement departure profile noise analysis
This December 2019 report by ESA for the Port of Seattle analyzes two standard Noise Abatement Departure Profiles (NADPs) used at Seattle-Tacoma International Airport: the Close-in profile, which reduces noise near the runway end, and the Distant profile, which reduces noise farther along the departure path. The analysis finds that the Distant NADP provides the greatest noise relief to the residential and developed communities surrounding Sea-Tac Airport. The report includes background on departure profiles, noise analysis results, and recommendations for the airport's noise abatement policy. -
 2019-12-10
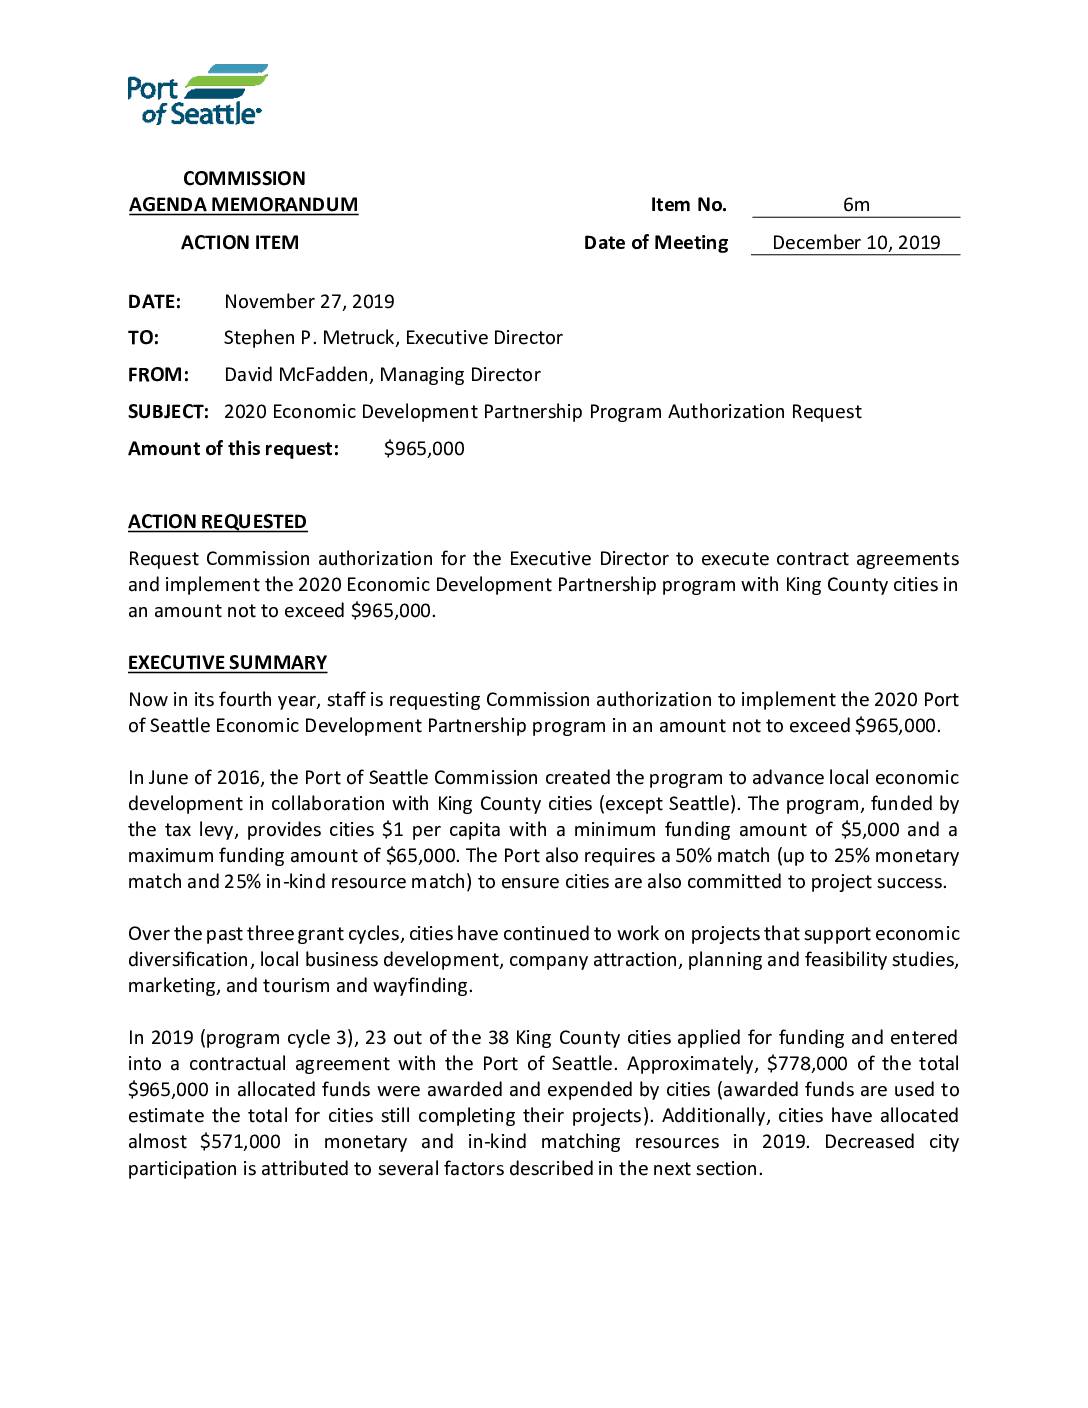
2020 Economic Development Partnership Program Authorization Request
The Port of Seattle is requesting $965,000 to fund its 2020 Economic Development Partnership Program, which provides grants to King County cities (excluding Seattle) to support local economic development projects such as business recruitment, tourism, and planning studies. Now in its fourth year, the program provides cities $1 per capita in funding and requires a 50% match from participating cities. In 2019, 23 of 38 eligible King County cities participated, with approximately $778,000 awarded for projects ranging from business assistance to regional marketing collaborations. -
 2019-11-30
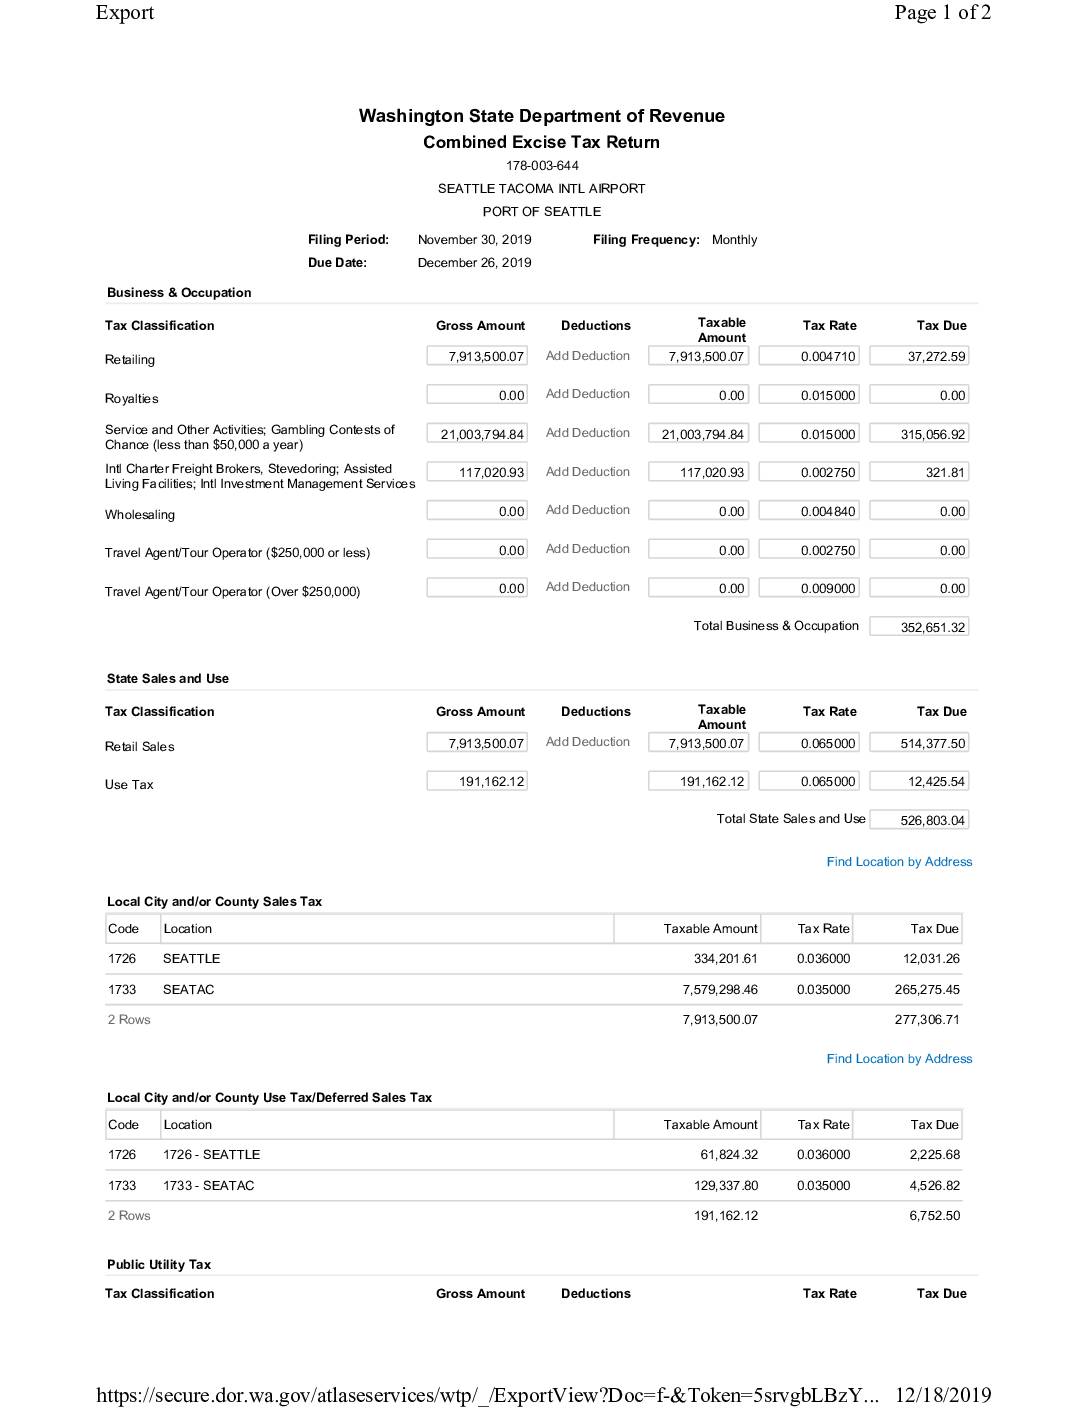
Combined Excise Tax Return: Seattle Tacoma Intl Airport, Port Of Seattle — November 2019
This document is a Washington State Combined Excise Tax Return filed by the Port of Seattle for Seattle-Tacoma International Airport, covering the period ending November 30, 2019. It details Business & Occupation taxes, state and local sales and use taxes, and public utility taxes across multiple classifications, resulting in a total tax liability of $1,194,557.63. The return was submitted on December 18, 2019, by Bonnie McArthur and paid via ACH debit with an effective date of December 26, 2019. -
 2019-11-20
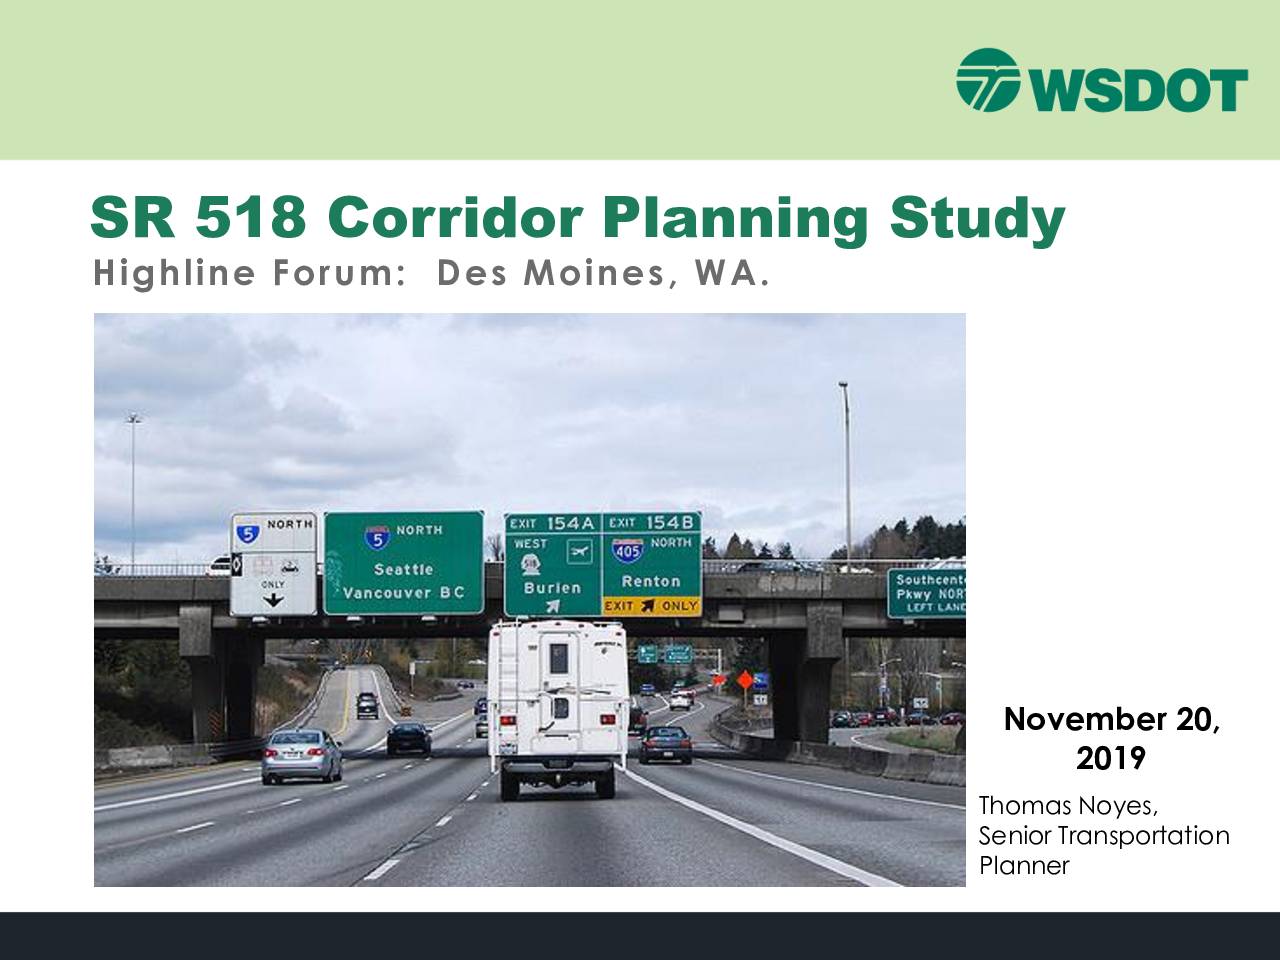
SR 518 corridor planning study
In November 2019, the Washington State Department of Transportation (WSDOT) presented findings from the SR 518 Corridor Planning Study to the Highline Forum in Des Moines, WA. The study, mandated by a 2017 legislative proviso and funded with $500,000 from the legislature plus an additional $400,000 from the Port of Seattle, examined traffic conditions and improvement alternatives along the SR 518 corridor near Sea-Tac Airport. The presentation covered traffic analysis, alternatives screening, and recommended improvement packages, with a final report due by November 30, 2019.