TagMap(375)
-
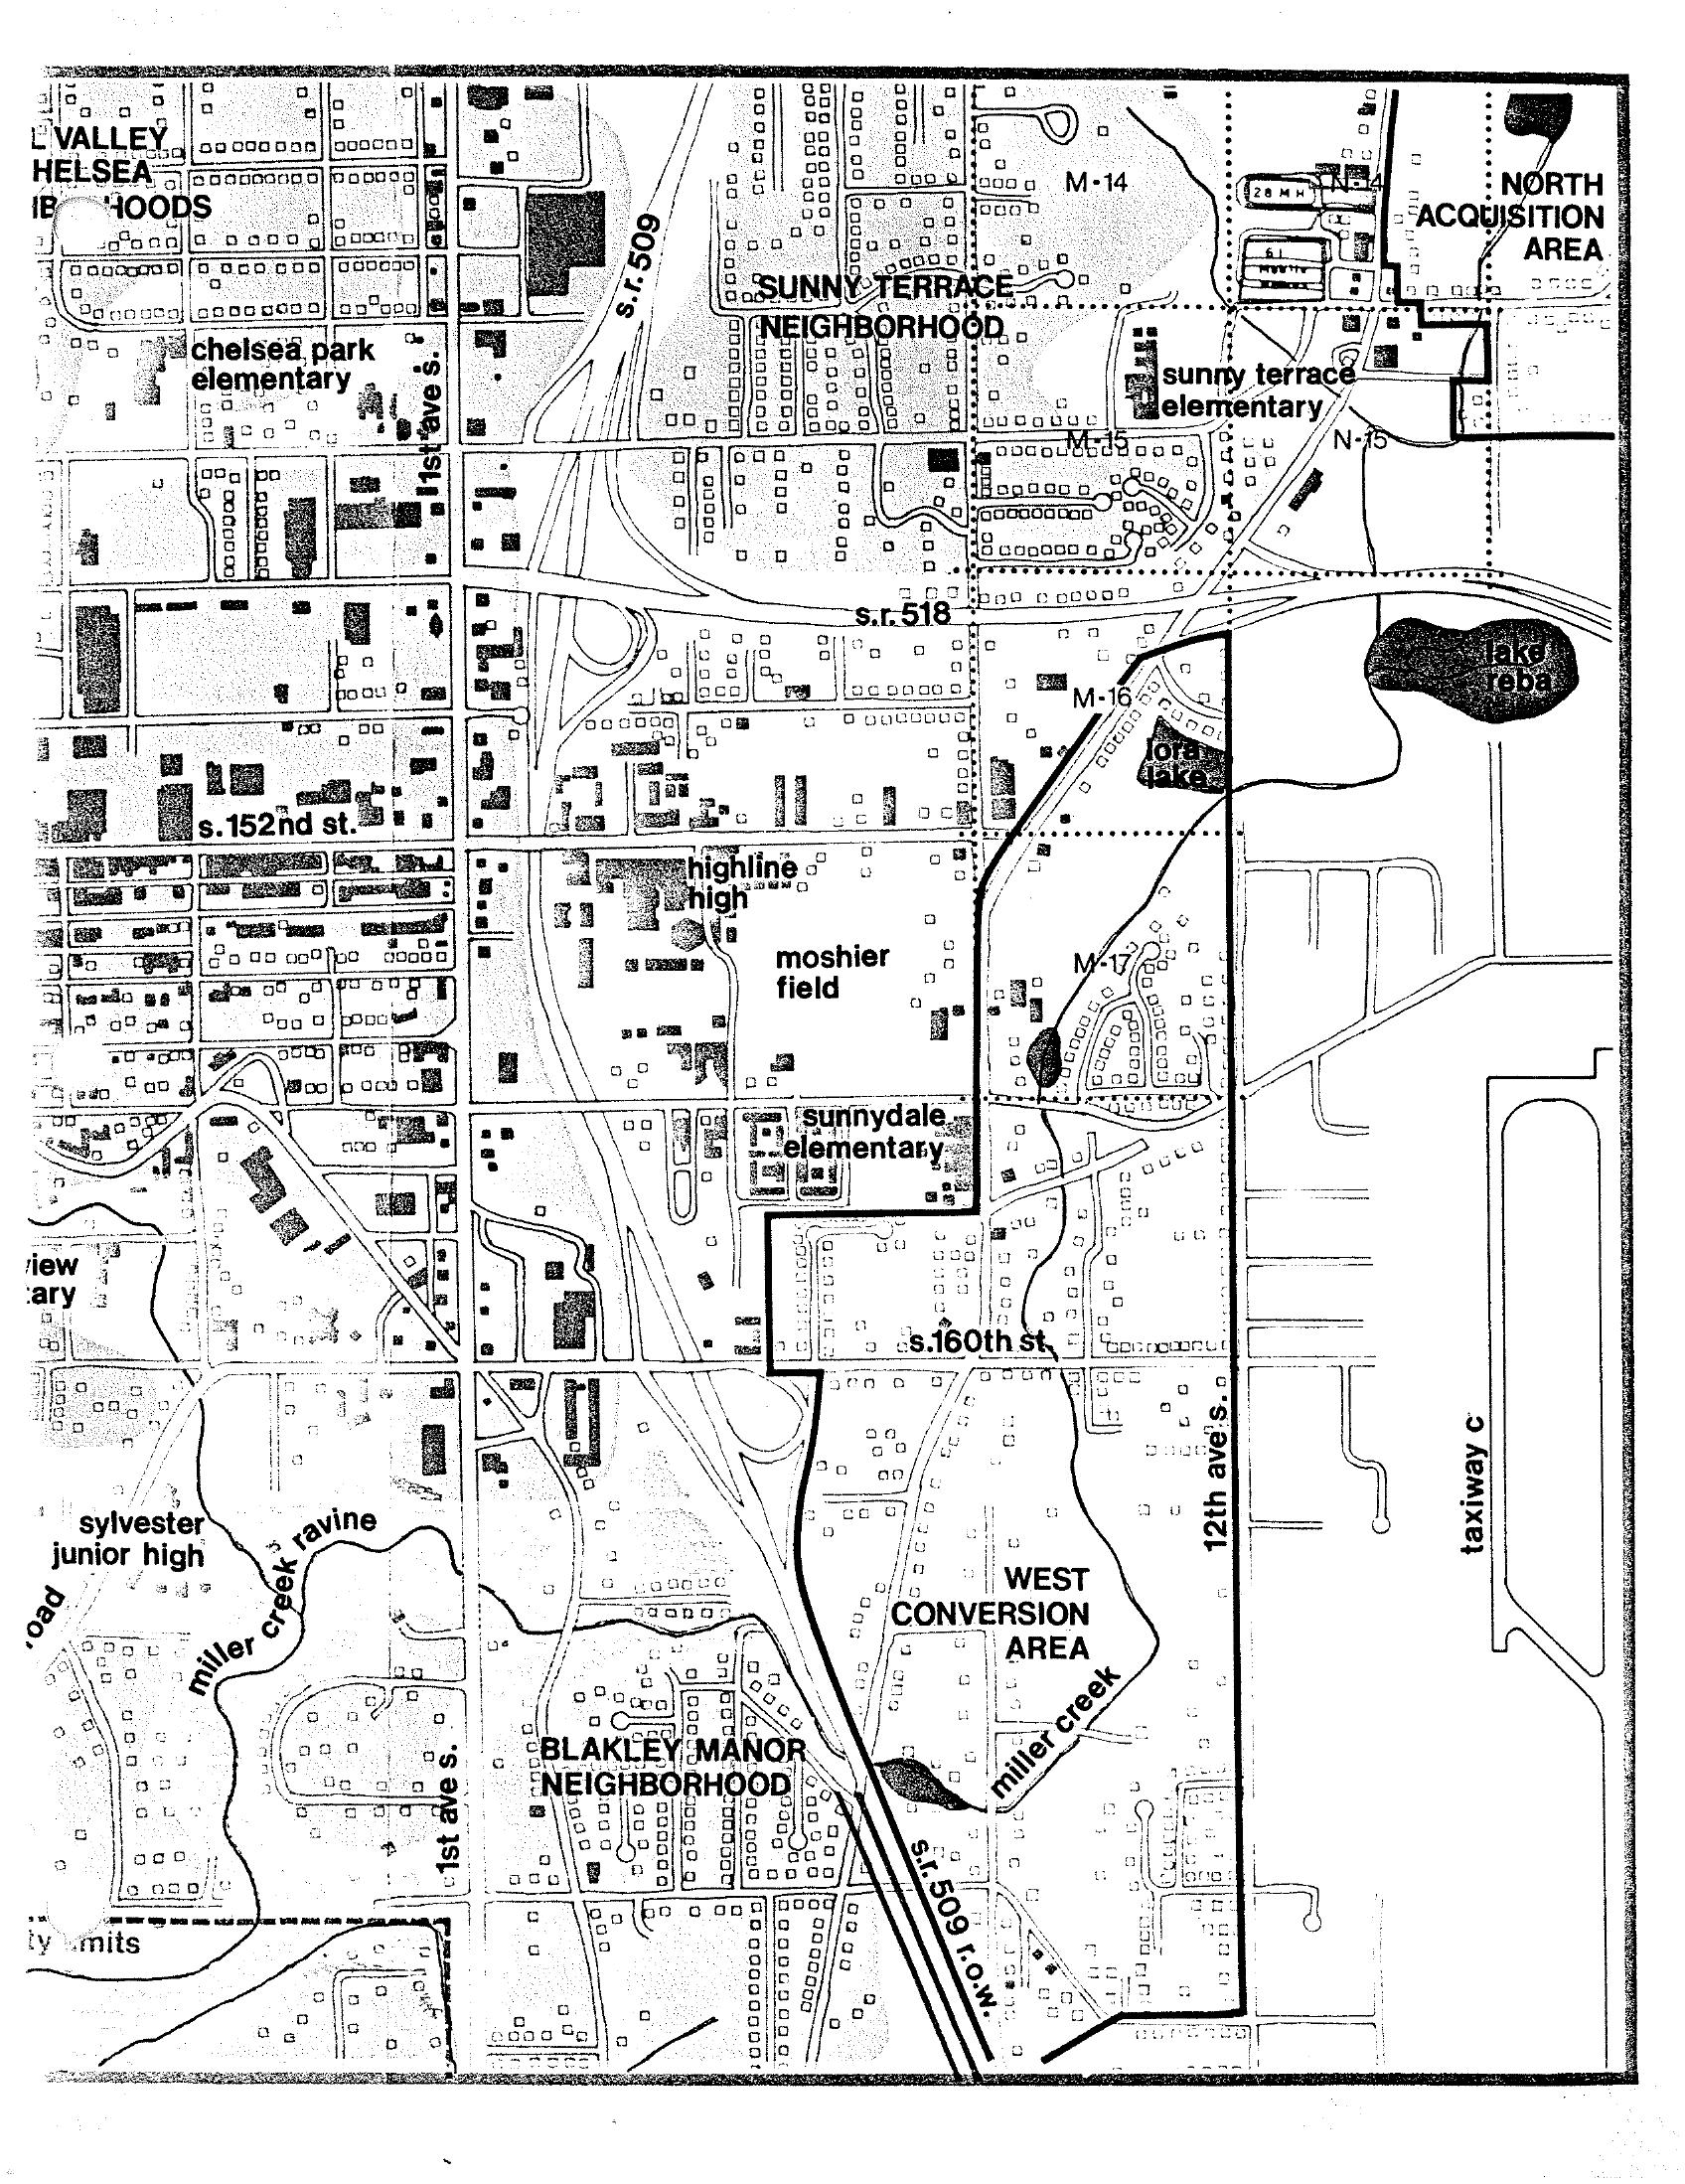
STCP Sunnydale Neighborhood Plan Map — West Conversion Area and North Acquisition Area
A detailed neighborhood map related to Sea-Tac Airport noise policy, showing the West Conversion Area and North Acquisition Area boundaries. The map identifies surrounding neighborhoods and landmarks including Sunny Terrace Neighborhood, Blakley Manor Neighborhood, Highline High School, Moshier Field, Sunnydale Elementary, Chelsea Park Elementary, Sunny Terrace Elementary, Sylvester Junior High, Miller Creek Ravine, Lake Reba, and major roads including S.R. 509, S.R. 518, S. 152nd St., and S. 160th St., with grid markers M-14 through M-17 and N-15. -
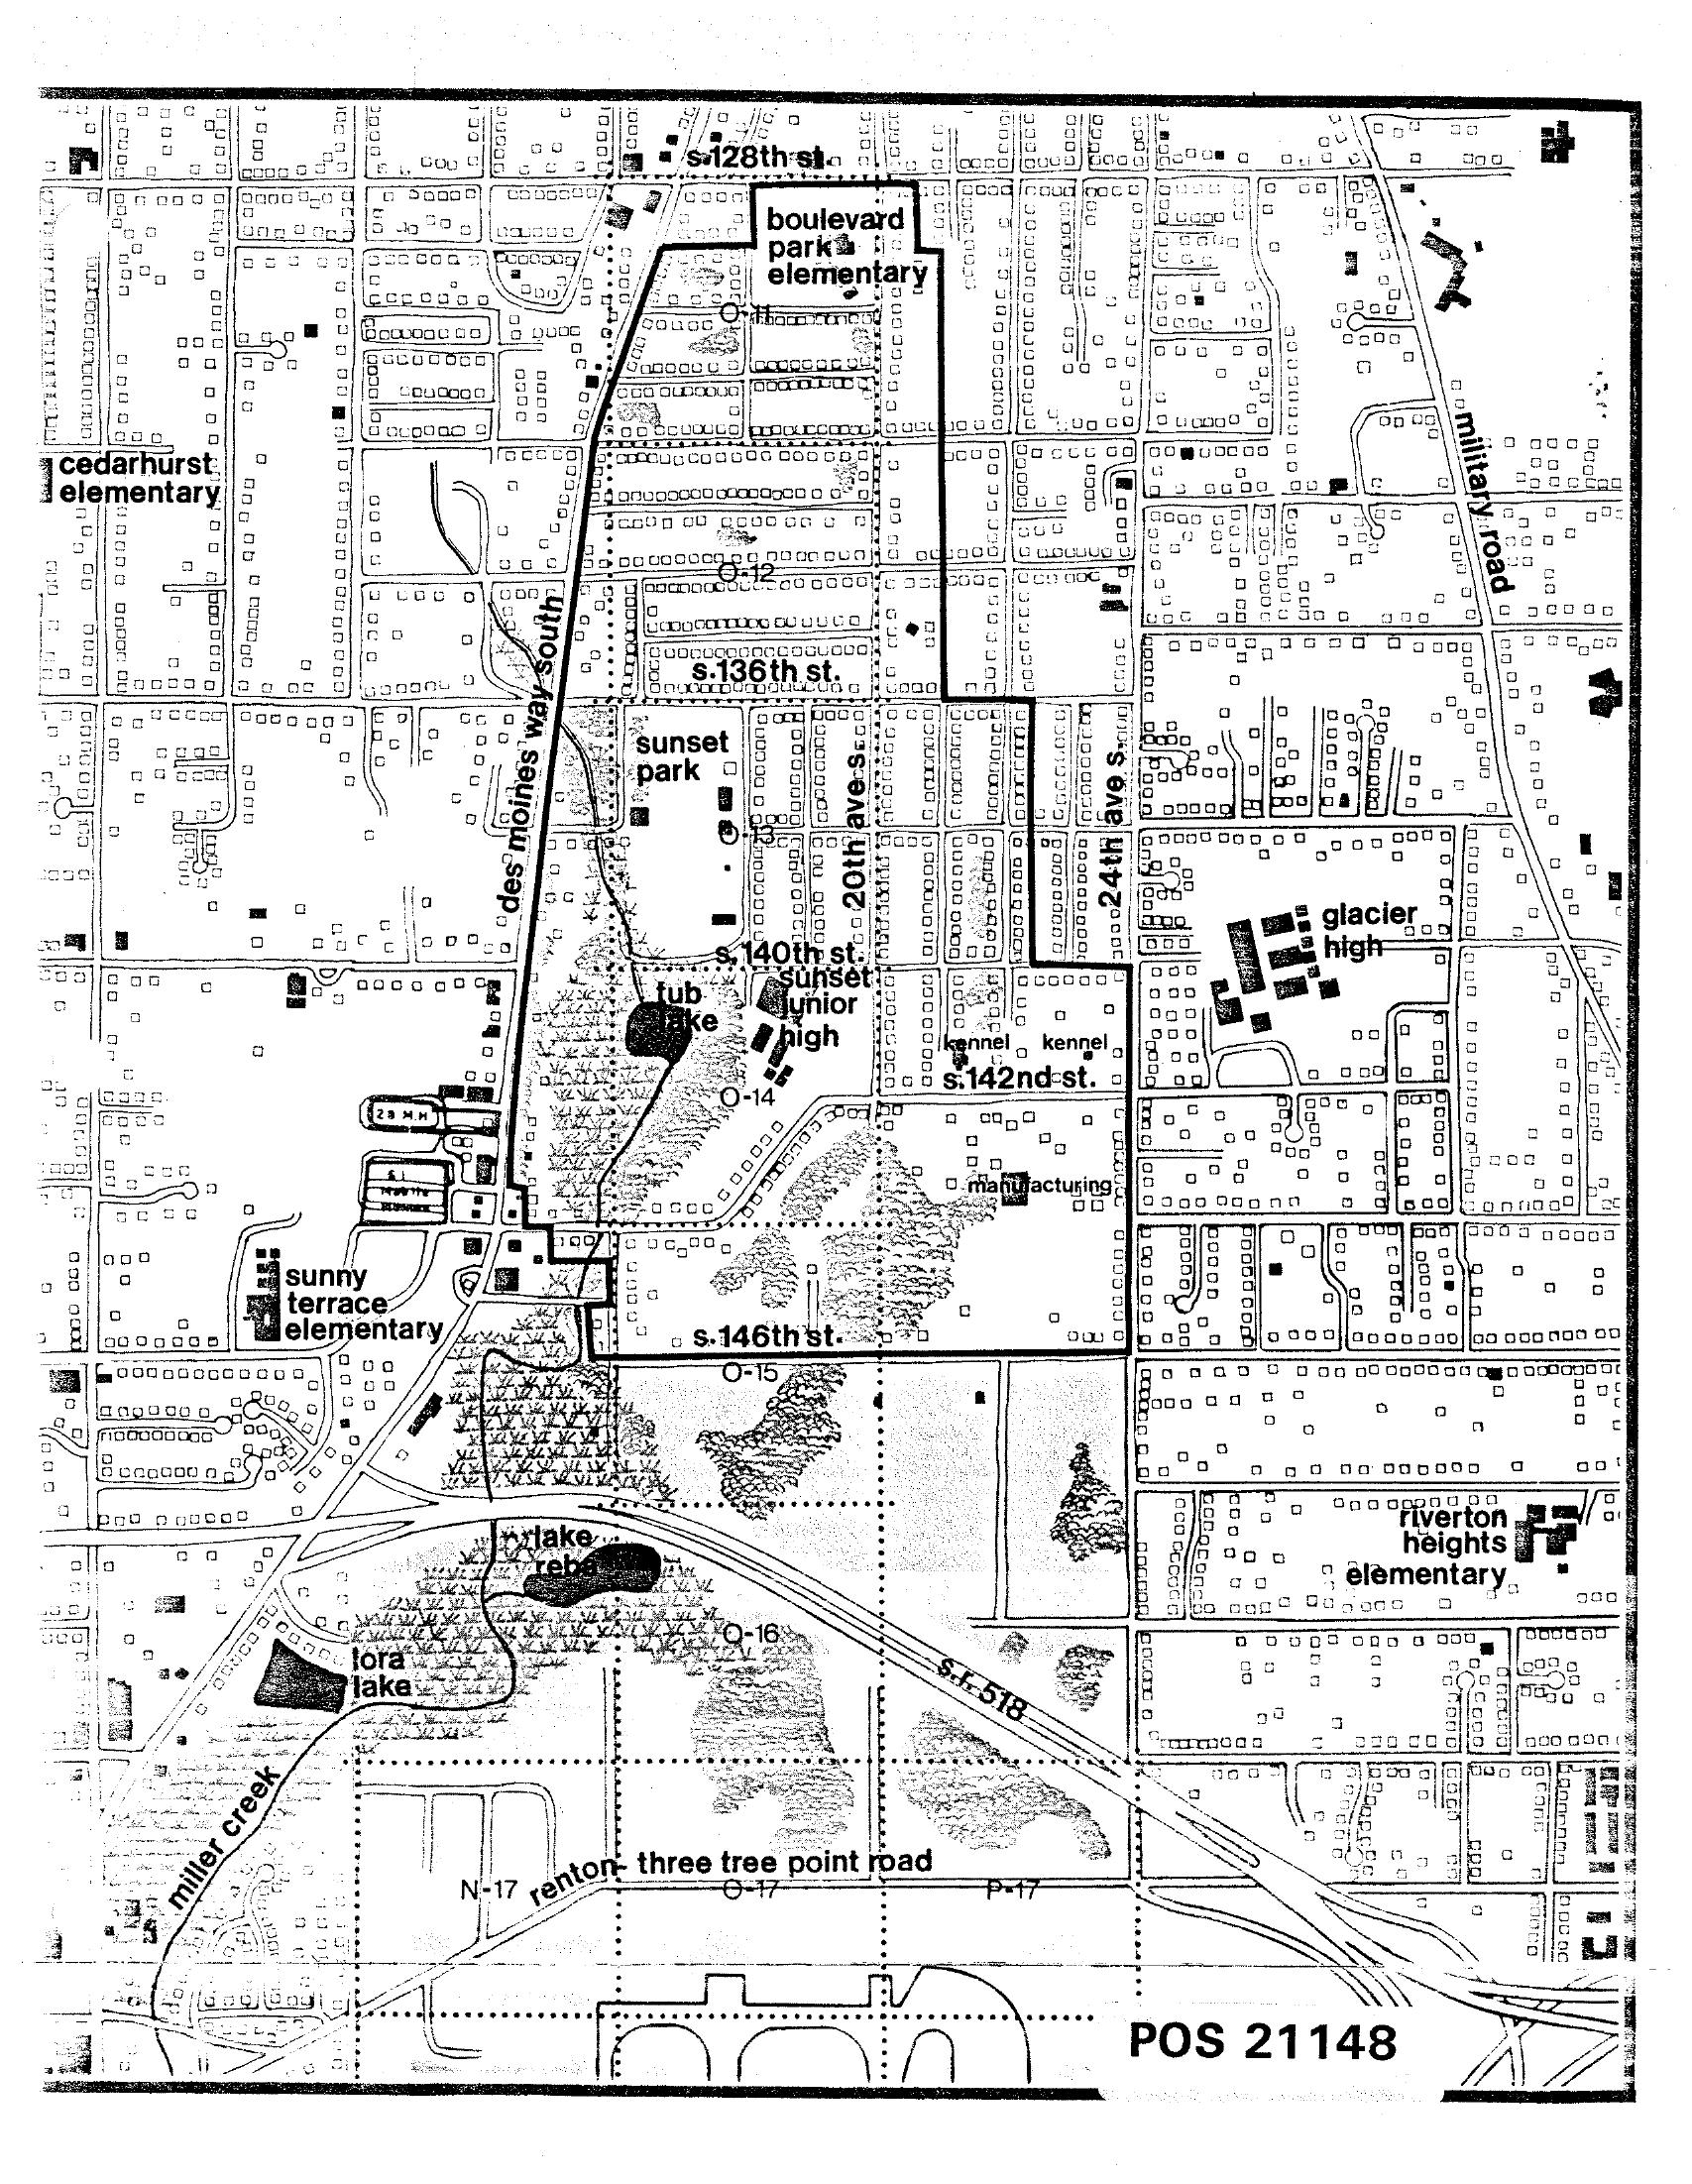
STCP Street Map with School Locations and Noise Zone Overlays, South Seattle/Burien Area
A detailed urban planning or noise-impact map labeled POS 21148 depicting the south Seattle/Burien area near Sea-Tac Airport, showing street grid references including S. 128th St., S. 136th St., S. 140th St., S. 142nd St., and S. 146th St., along with named landmarks such as Boulevard Park Elementary, Cedarhurst Elementary, Sunset Junior High, Glacier High, Sunny Terrace Elementary, Riverton Heights Elementary, Tub Lake, Lake Rebecca, Lora Lake, Miller Creek, Des Moines Way South, Military Road, and SR-518 (Renton–Three Tree Point Road). Zone designations (O-12 through O-17, N-17, P-17) suggest noise contour or land-use overlay classifications consistent with airport noise policy planning. -
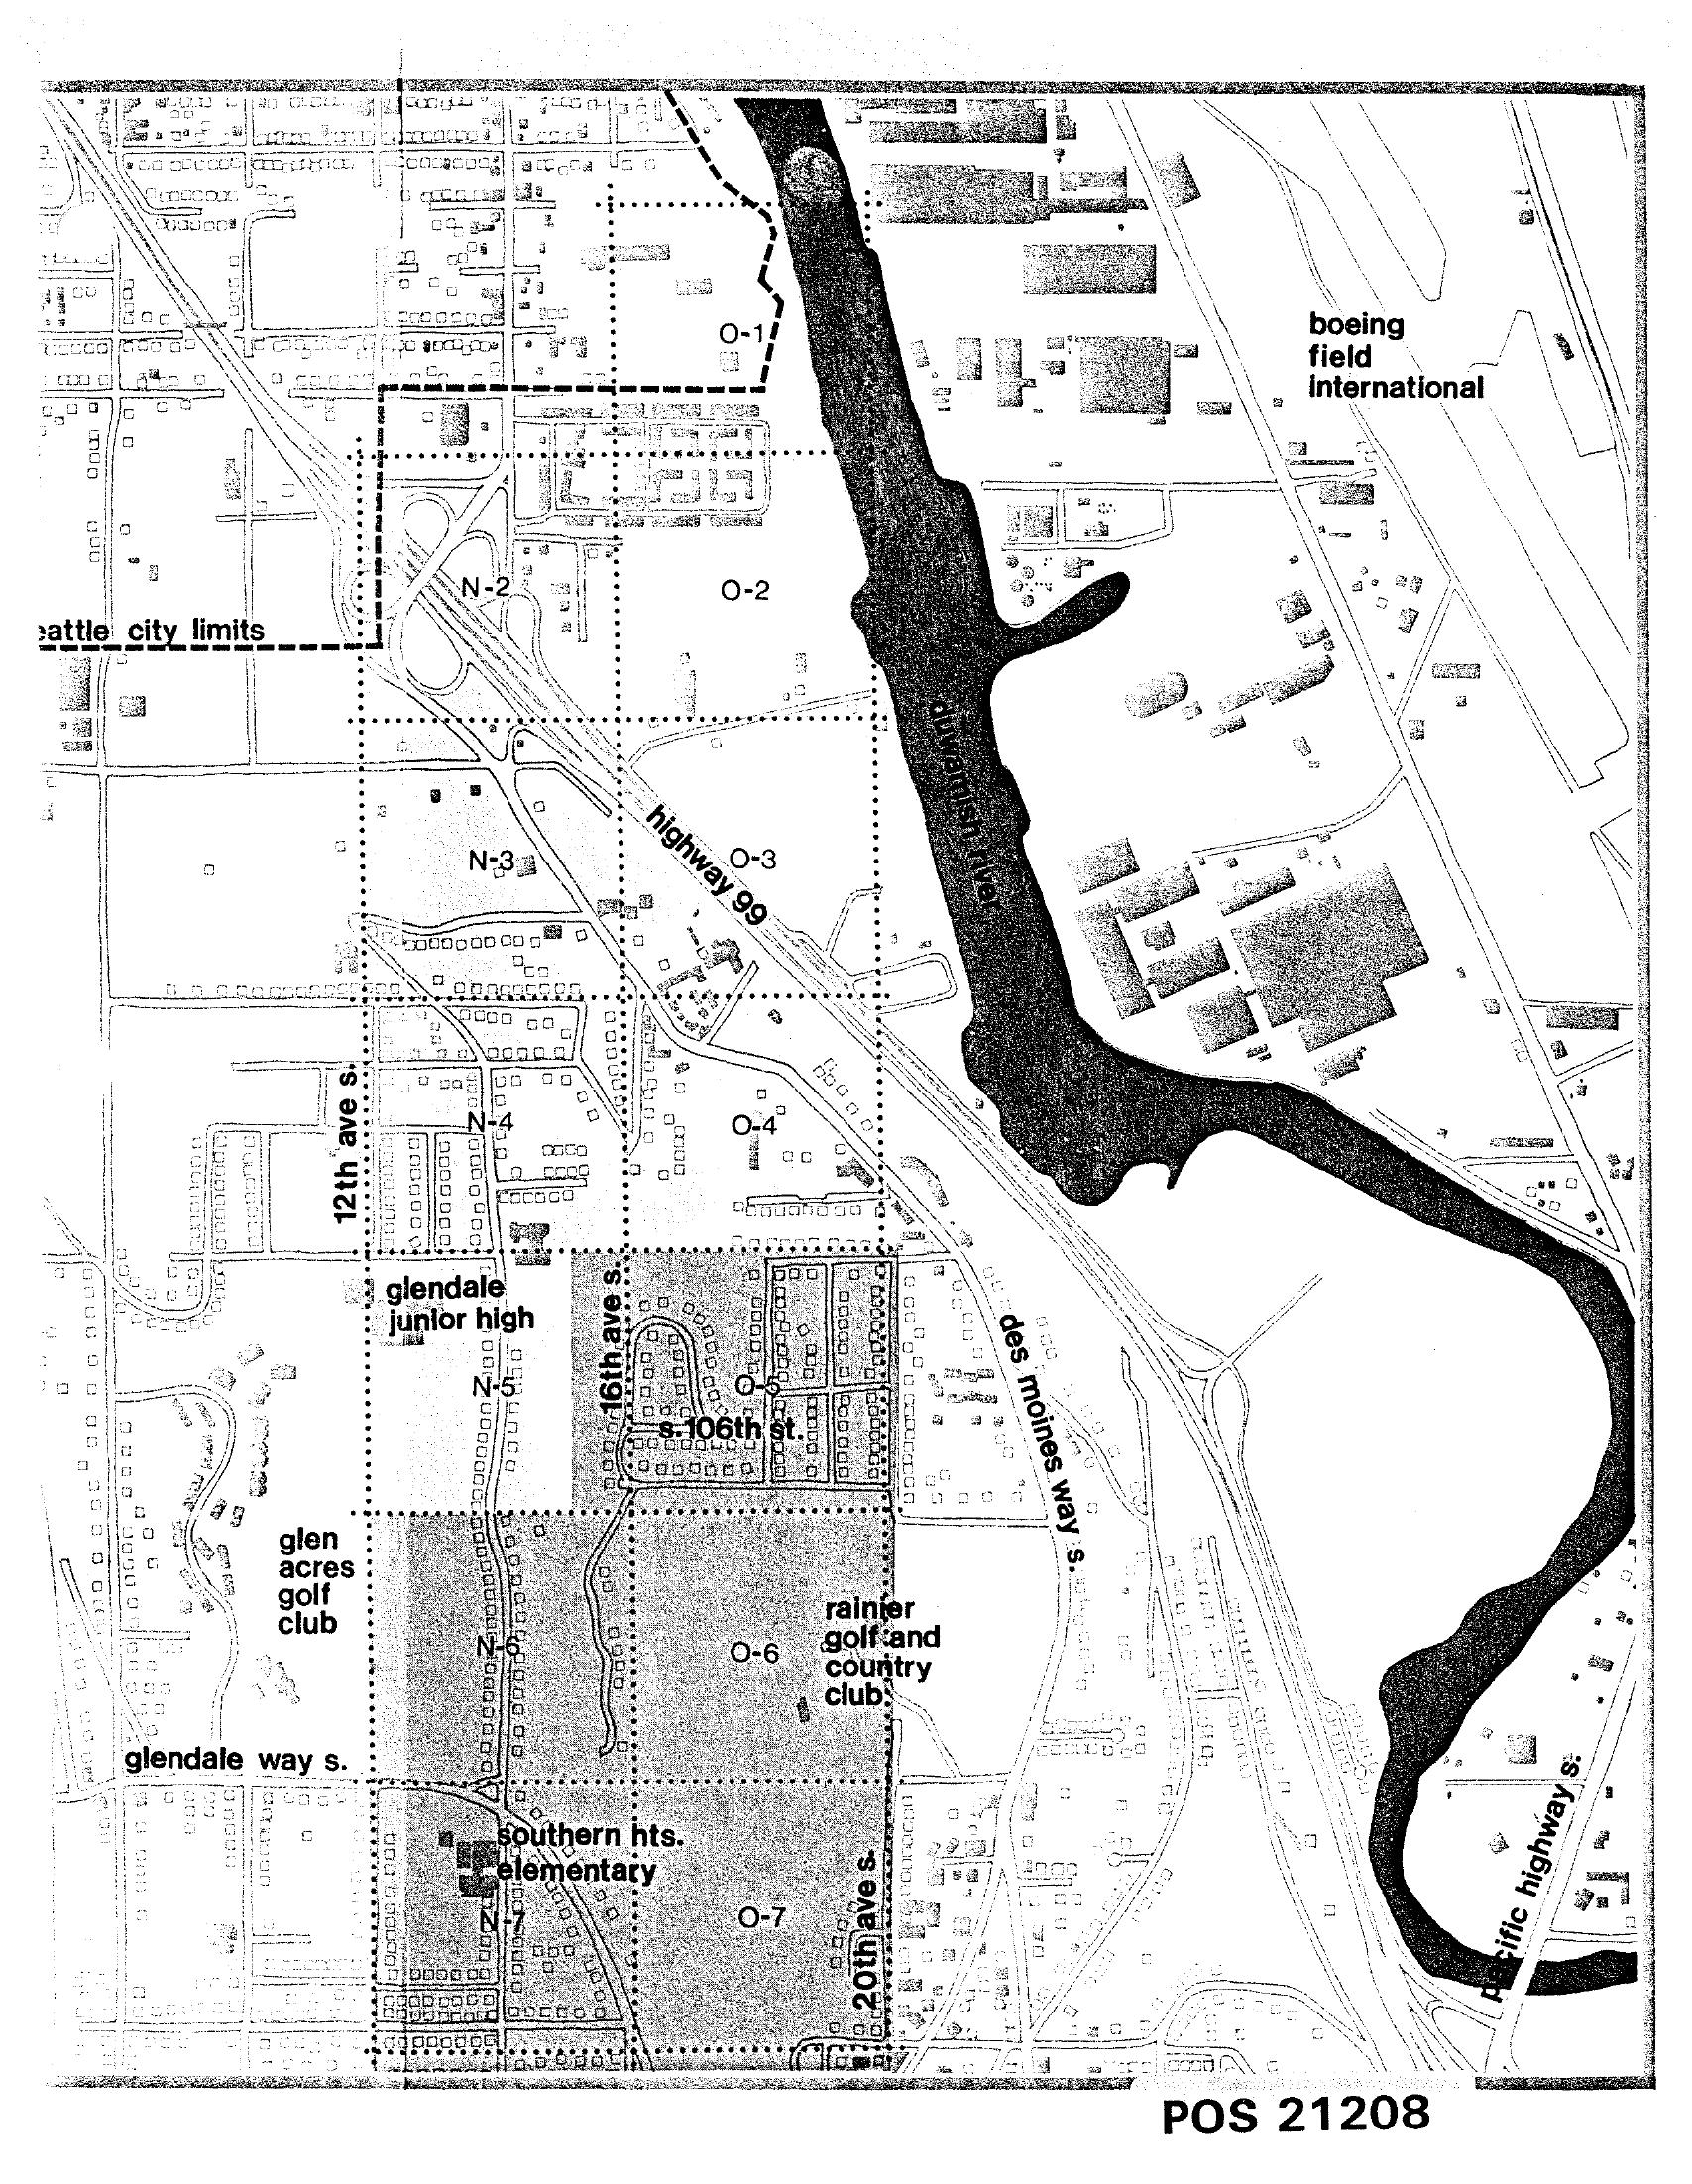
Sea-Tac Communities Plan Noise Study Zones Map (POS 21208)
Planning map labeled POS 21208 showing noise study zones (N-1 through N-7 and O-1 through O-7) in the area south of Seattle city limits along Highway 99 and 16th Ave S, bounded by Boeing Field/King County International Airport to the north and featuring landmarks including Glendale Junior High, Glen Acres Golf Club, Rainier Golf and Country Club, Southern Heights Elementary, and the Duwamish River. The map appears to be part of a Sea-Tac Airport or regional airport noise impact planning study. -
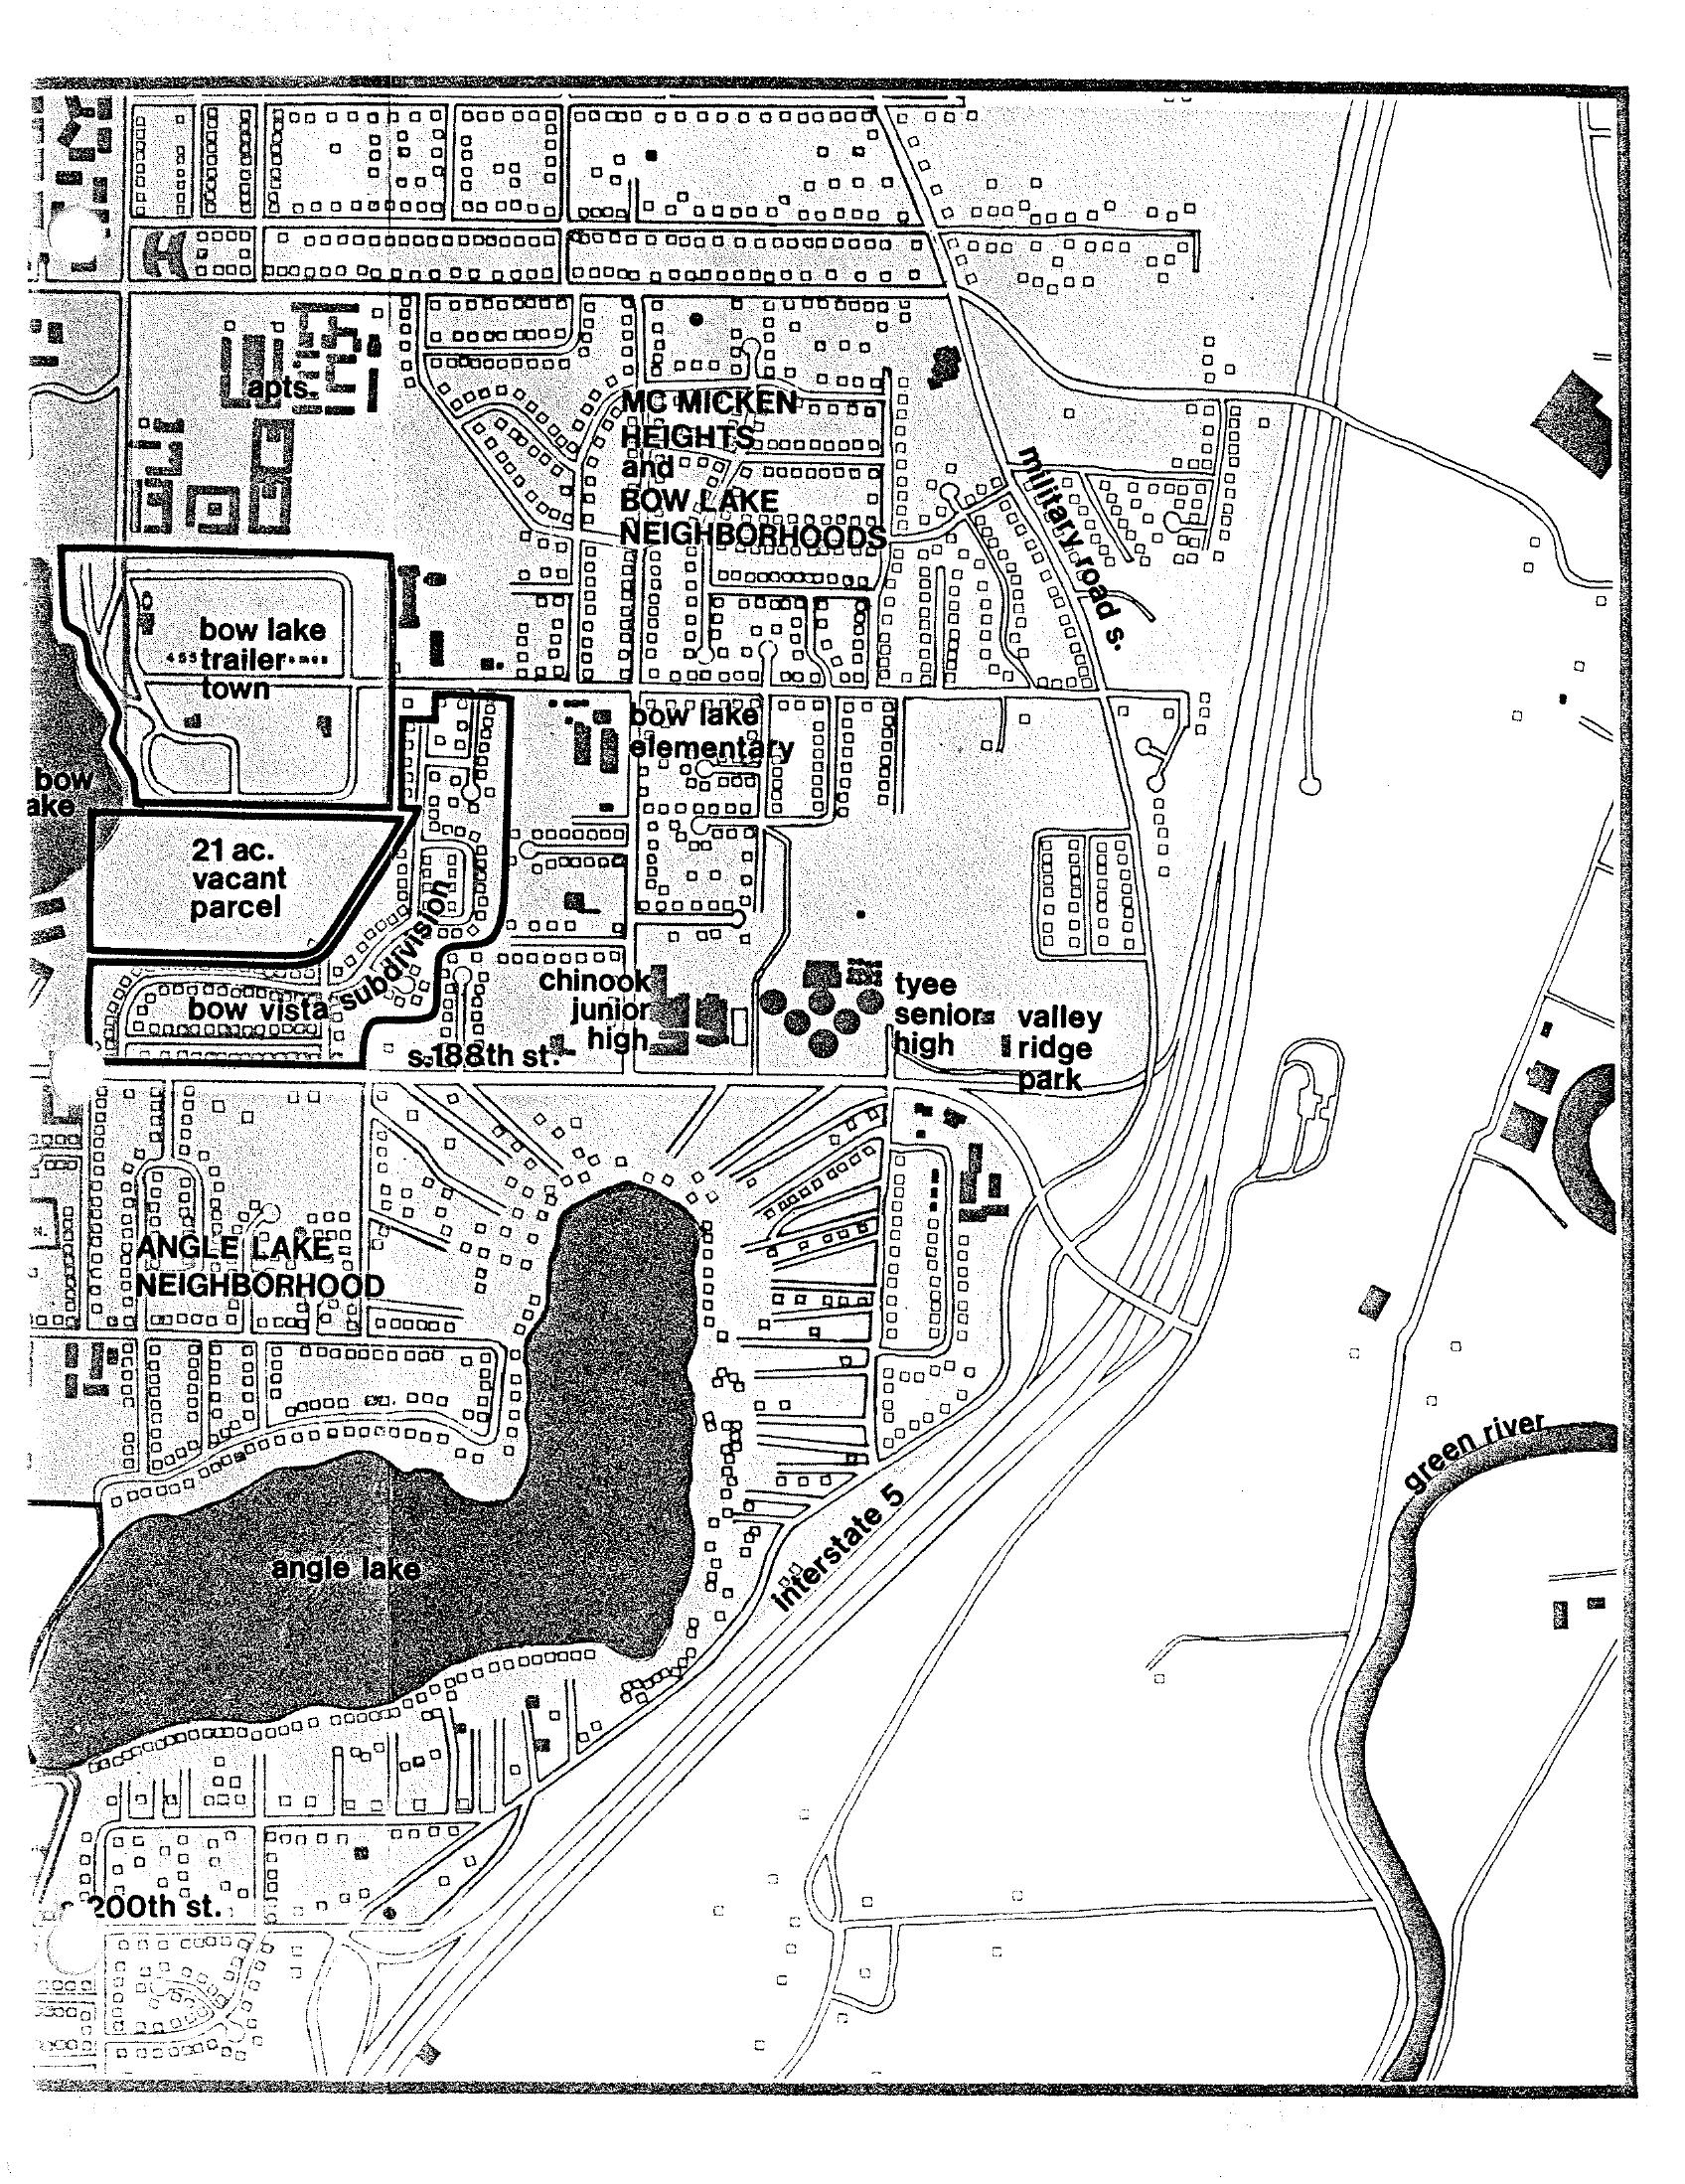
Sea-Tac Communities Plan Map: McMicken Heights and Bow Lake Neighborhoods
A neighborhood planning map depicting the McMicken Heights and Bow Lake neighborhoods near Sea-Tac Airport, showing Bow Lake, Angle Lake, Interstate 5, the Green River, and local landmarks including Bow Lake Elementary, Chinook Junior High, Tyee Senior High, and Valley Ridge Park. Also visible are Bow Lake Trailer Town, a 21-acre vacant parcel, Bow Vista Subdivision, and street references including S. 188th St. and 200th St. -
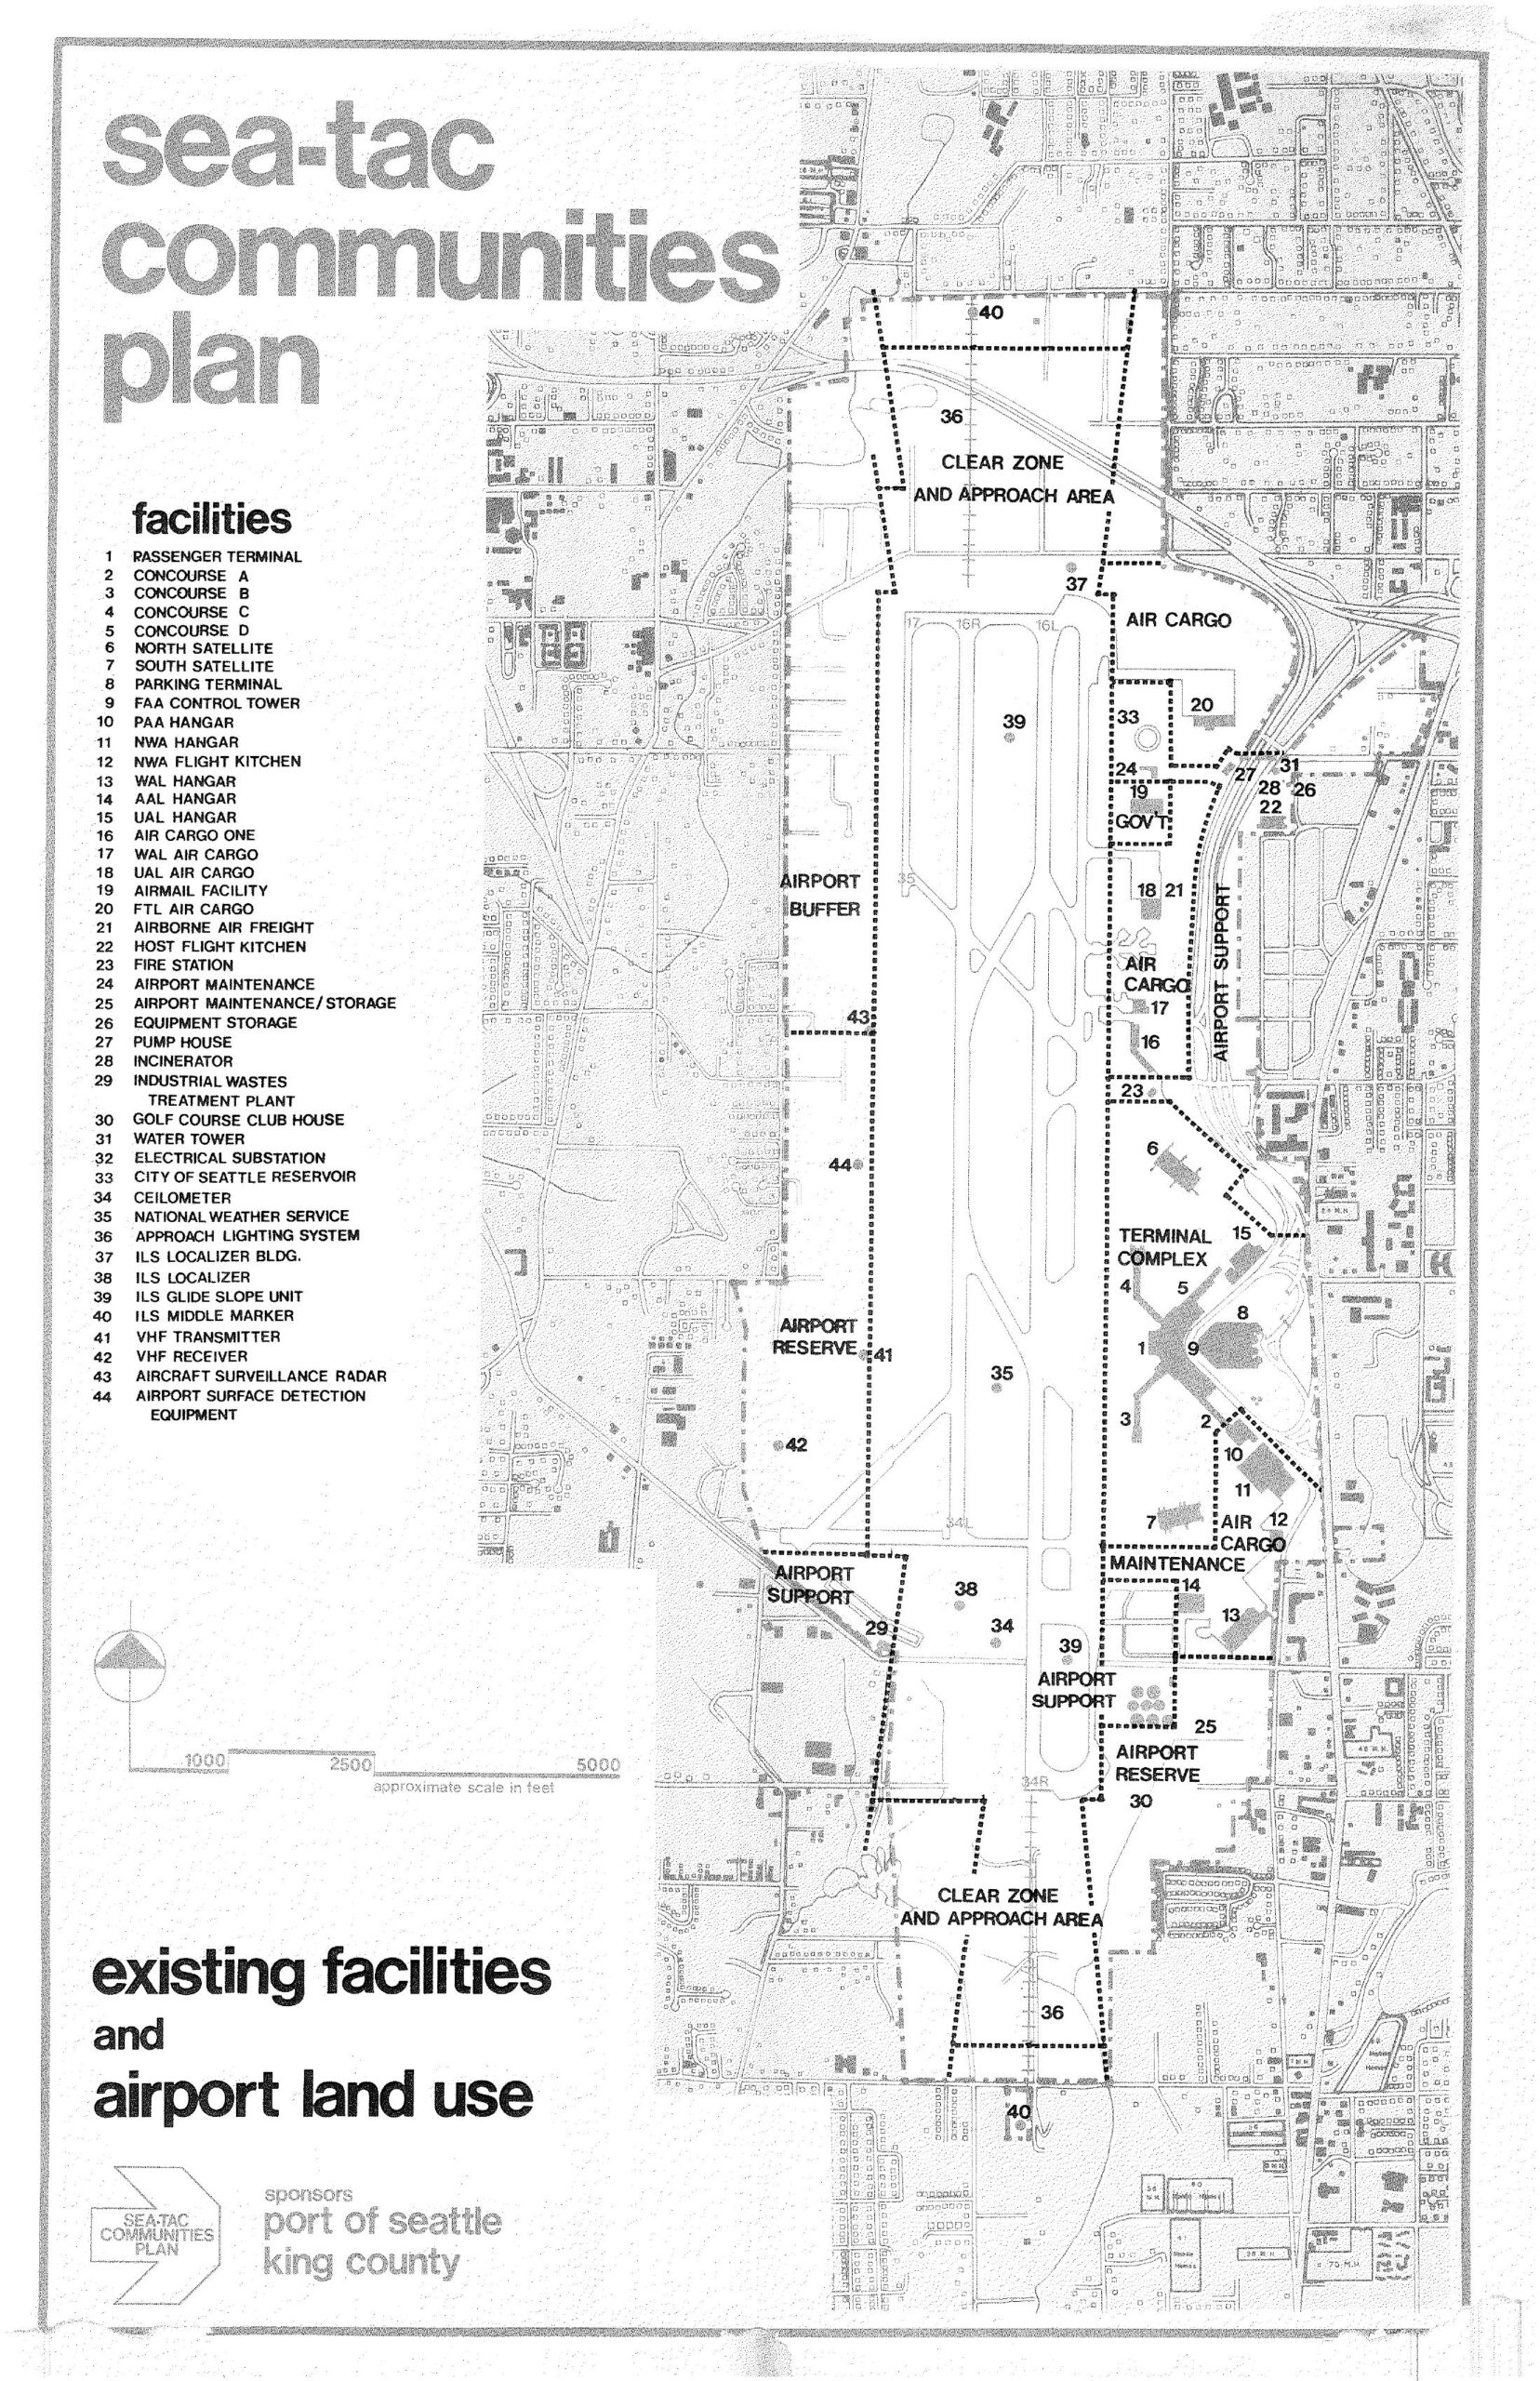
Sea-Tac Communities Plan: Existing Facilities and Airport Land Use Map
A detailed land-use map from the Sea-Tac Communities Plan, sponsored by the Port of Seattle and King County, showing existing facilities and airport land use zones at Seattle-Tacoma International Airport. The map identifies 44 numbered facilities including the passenger terminal, concourses, hangars, air cargo areas, ILS navigation equipment, clear zones, and approach areas, with zones labeled for Terminal Complex, Airport Support, Airport Reserve, and Airport Buffer. -
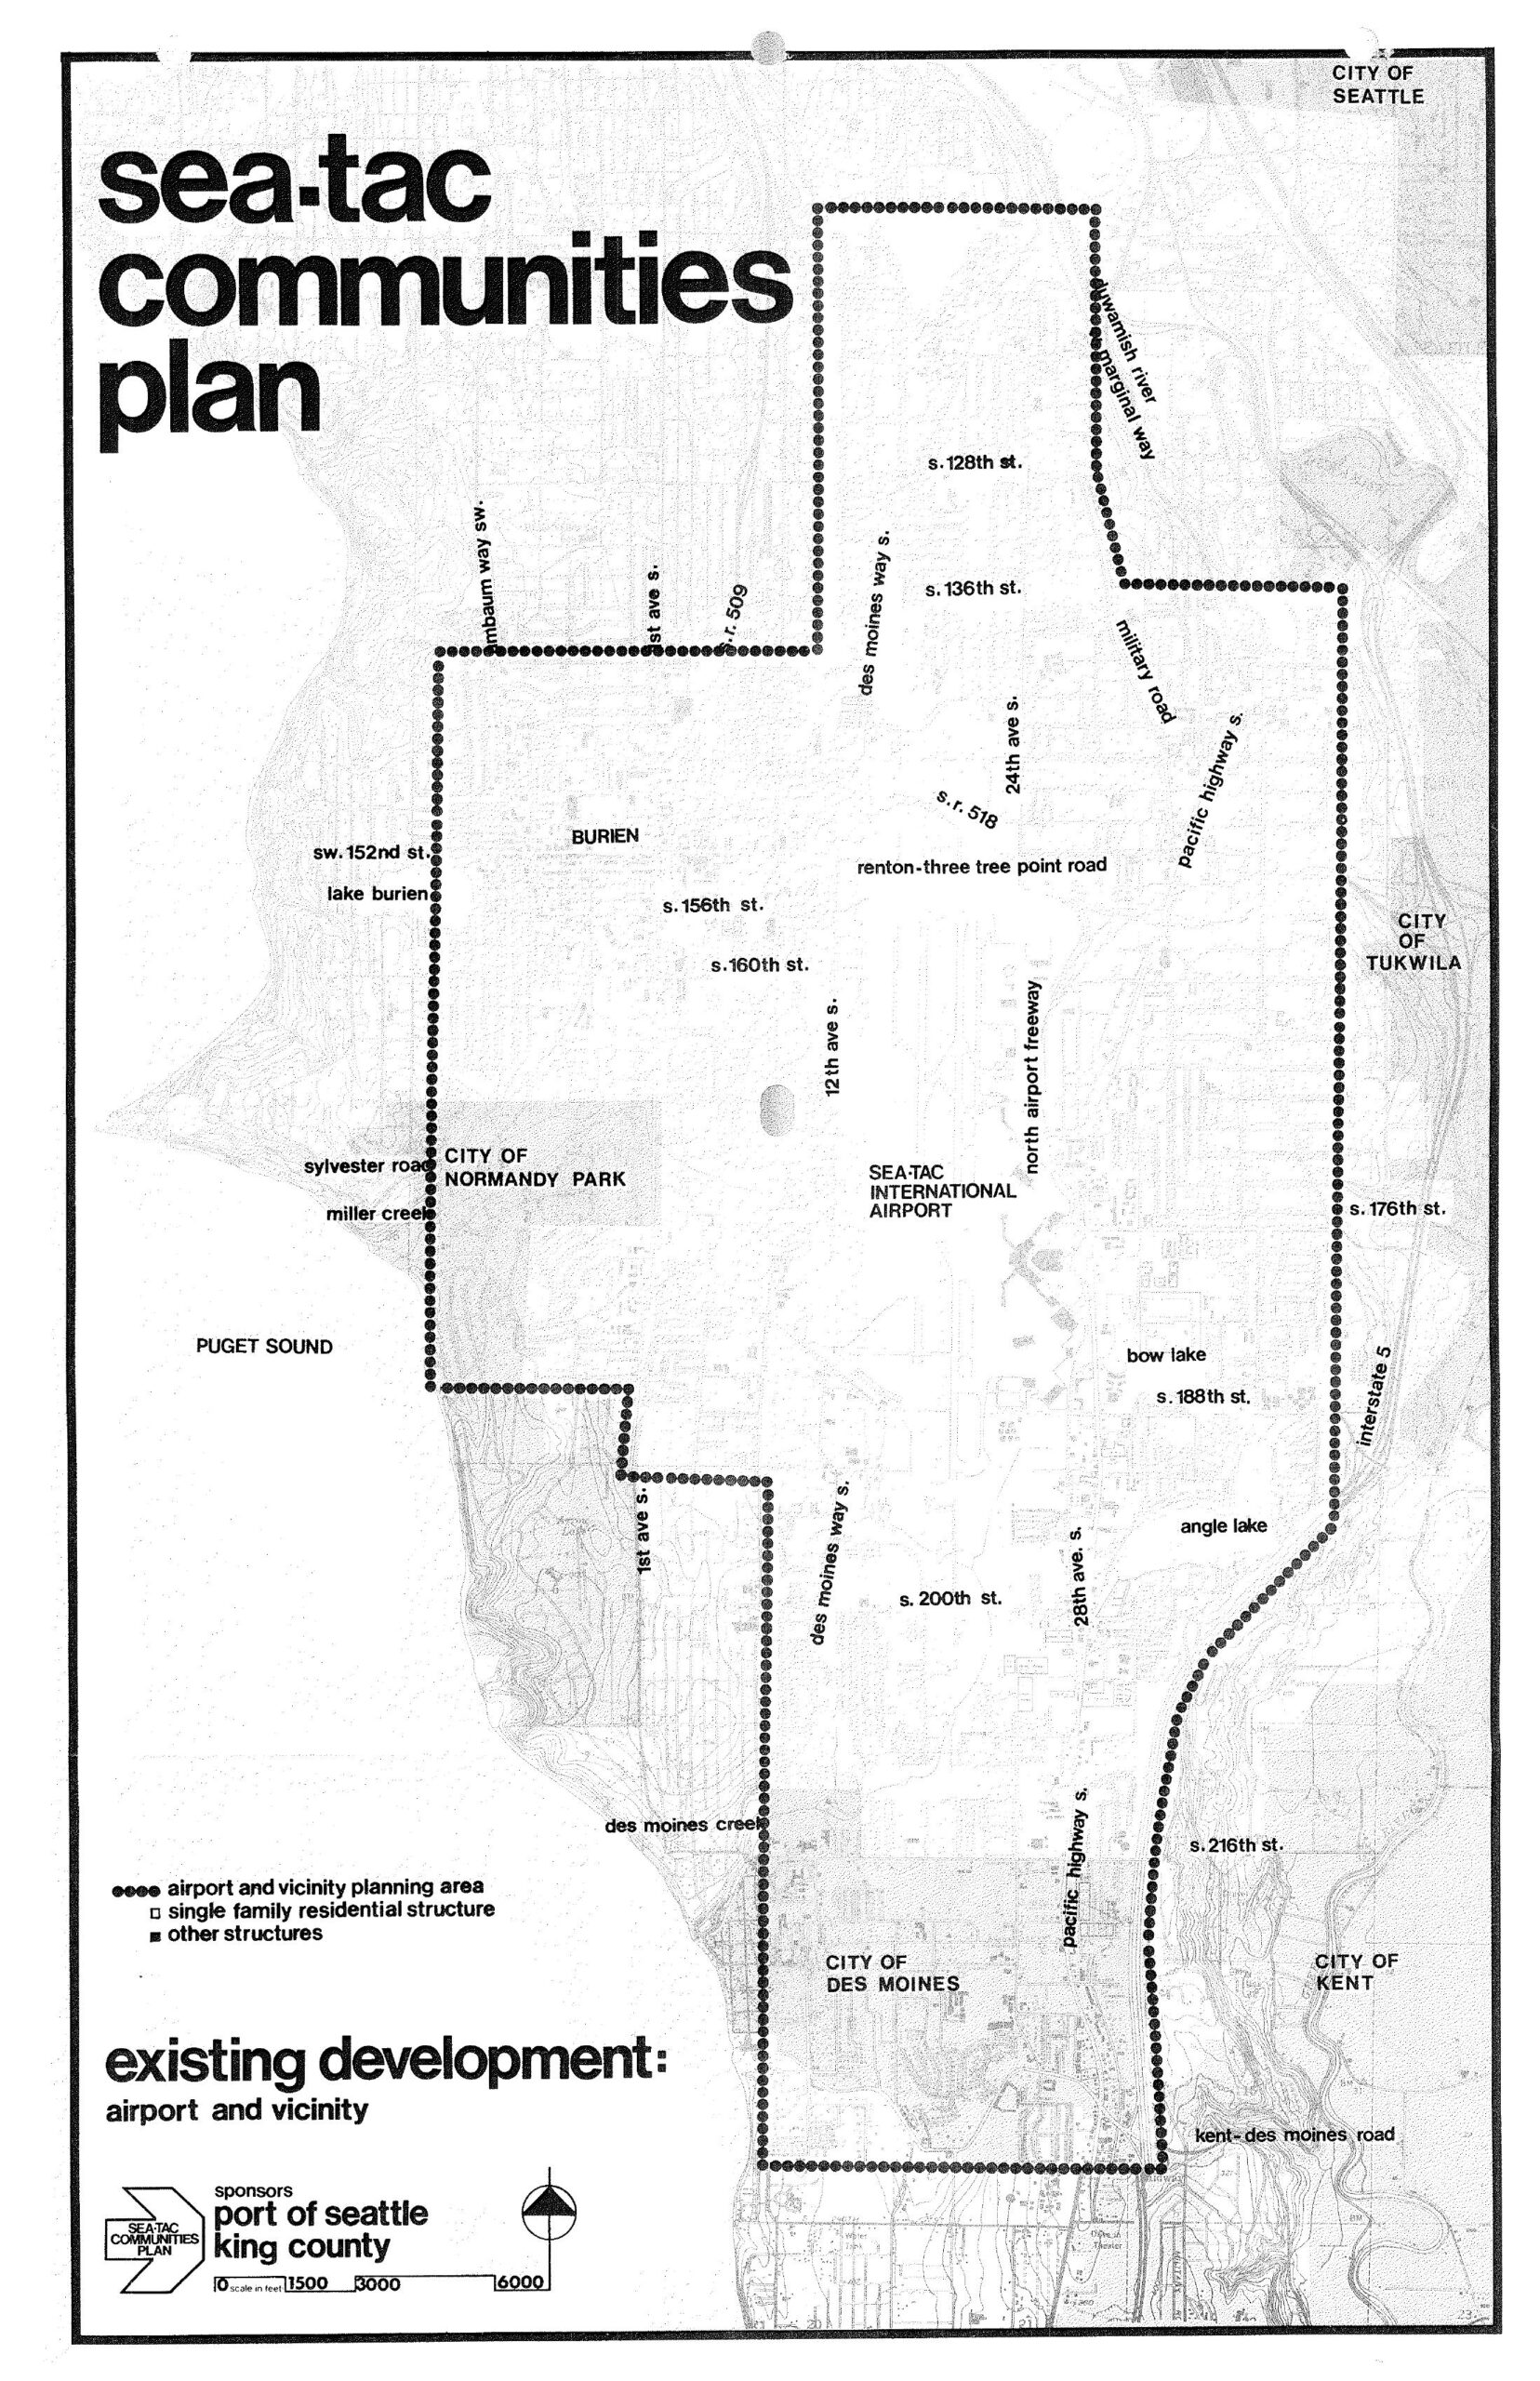
Sea-Tac Communities Plan: Airport and Vicinity Existing Development Planning Map
A planning map produced by the Port of Seattle and King County as part of the Sea-Tac Communities Plan, showing the airport and vicinity planning area boundary (marked by dotted lines) surrounding Seattle-Tacoma International Airport. The map identifies surrounding jurisdictions including the City of Seattle, City of Tukwila, City of Normandy Park, City of Des Moines, City of Kent, and Burien, along with key roads, Interstate 5, and geographic features such as Puget Sound, Bow Lake, Angle Lake, and Miller Creek. -
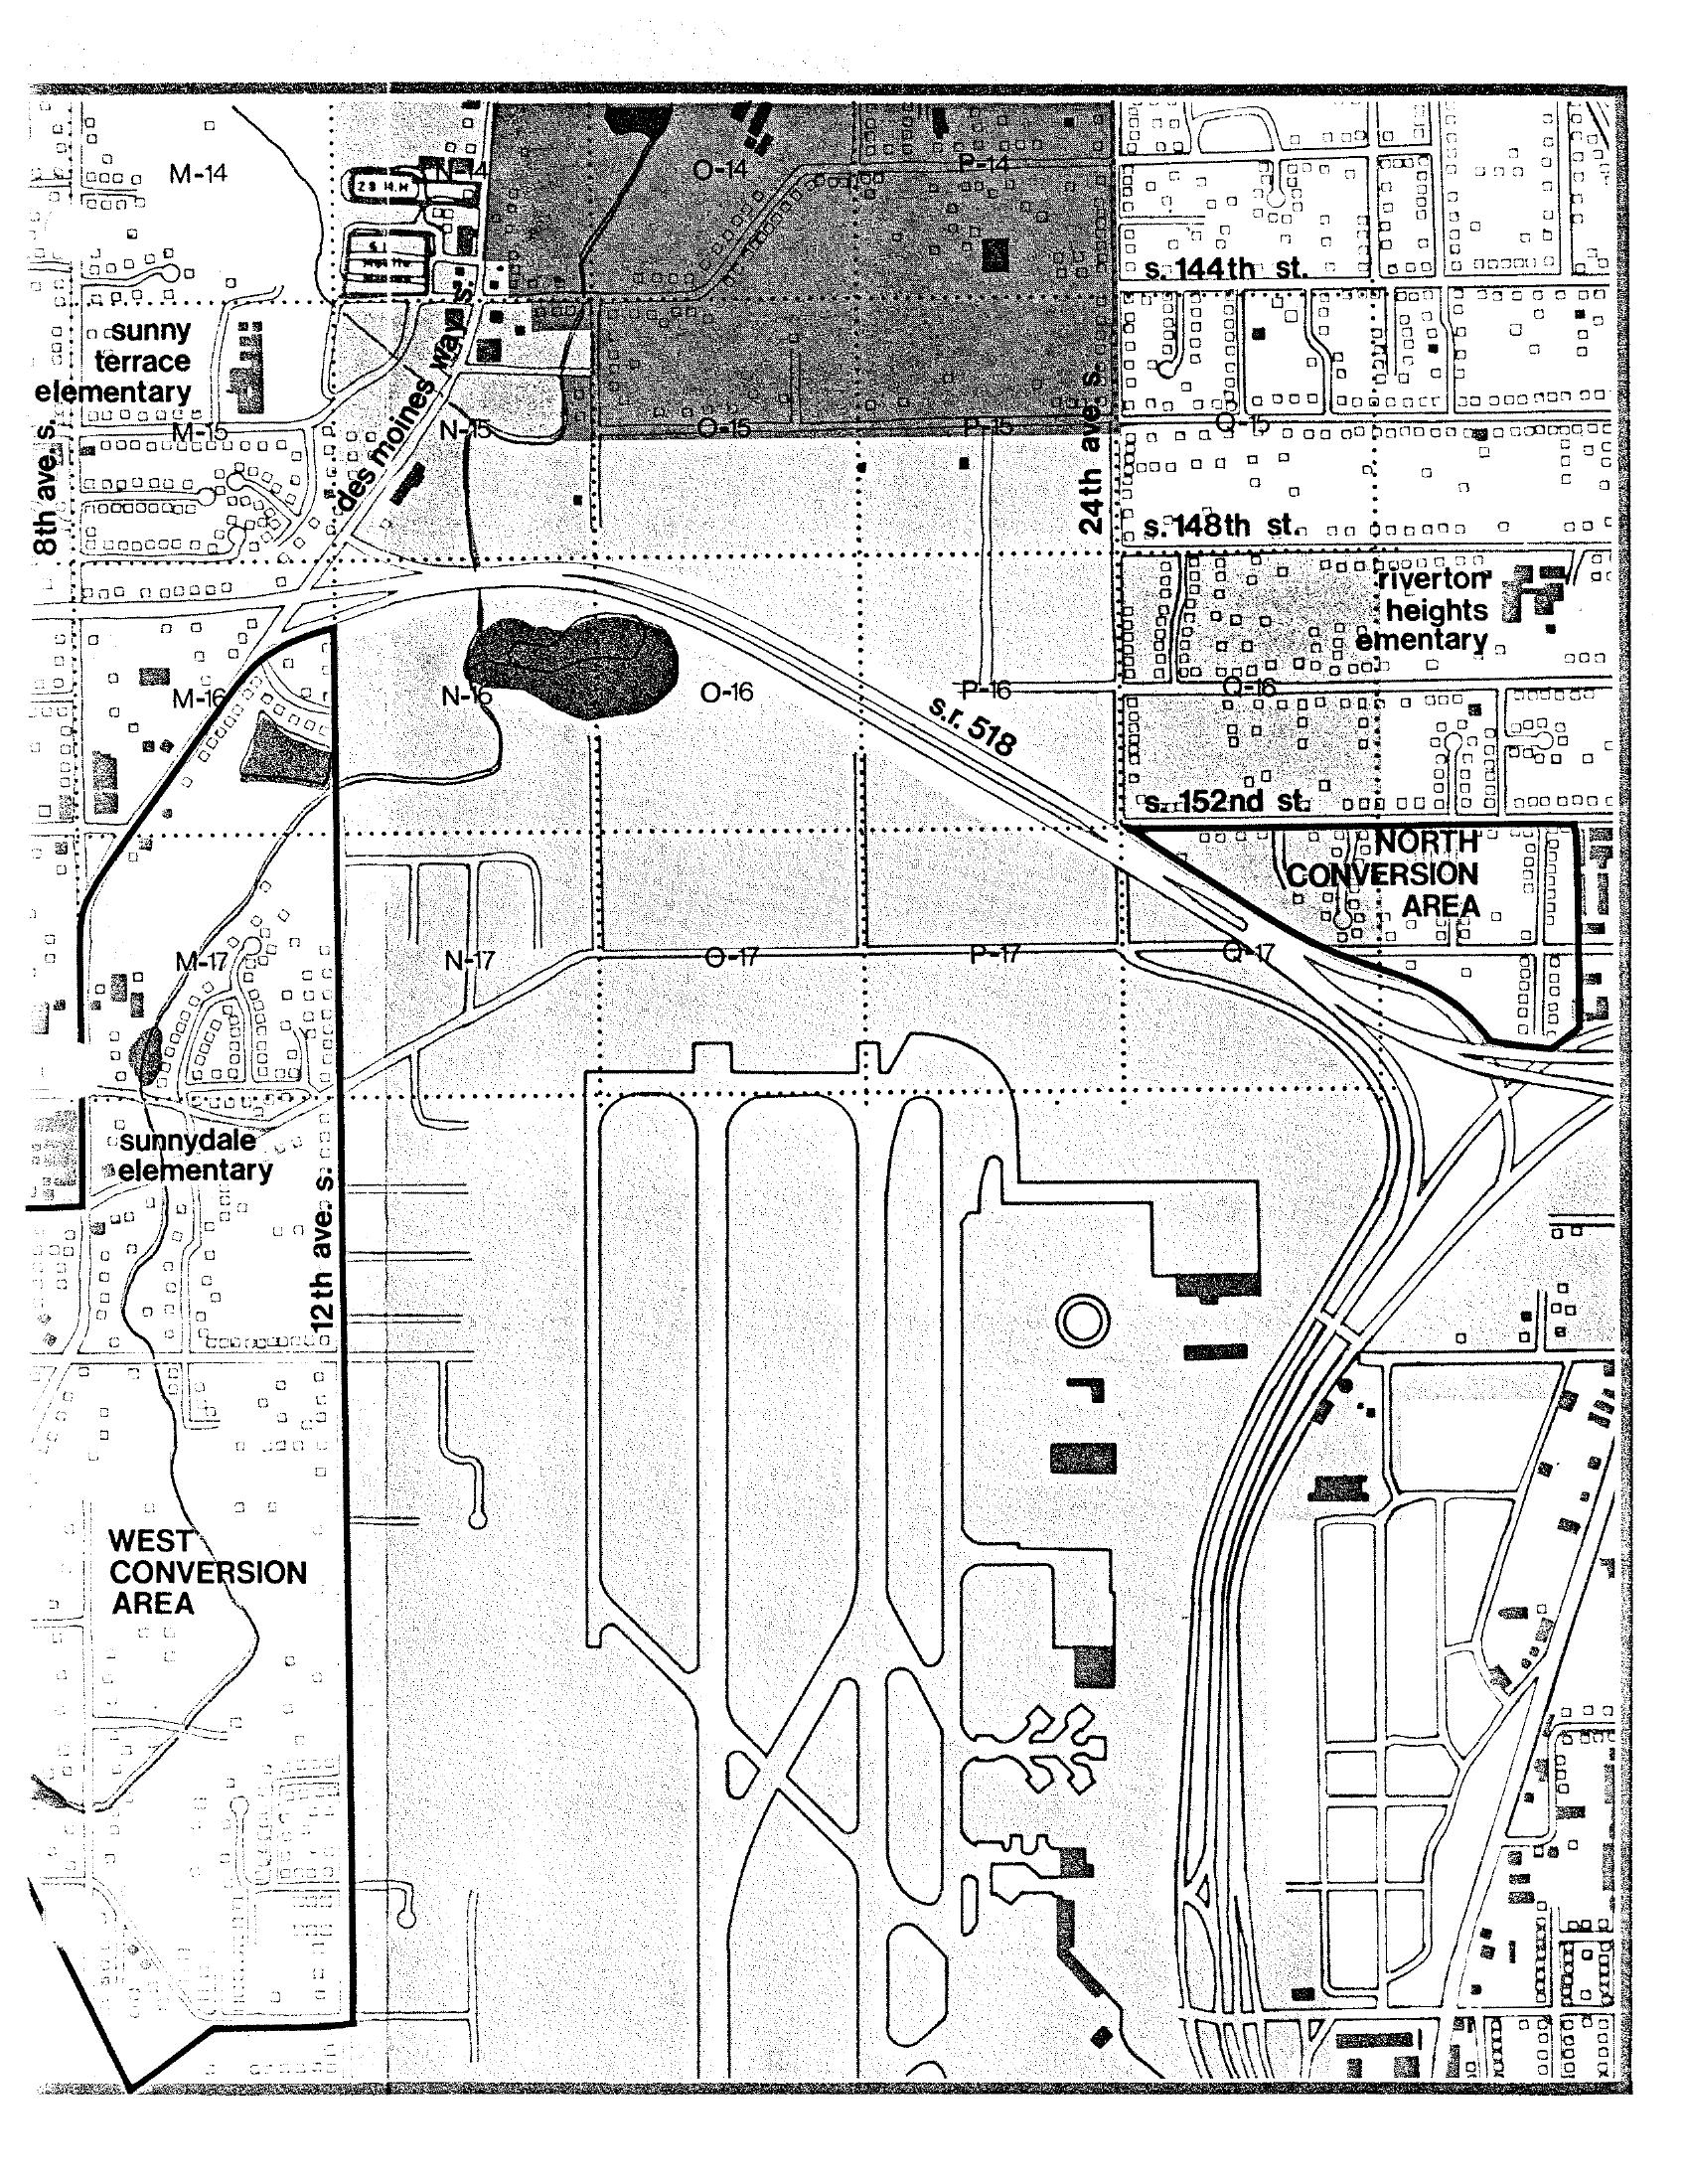
STCP Area Map: North and West Conversion Areas Near Sea-Tac Airport
A planning grid map of the area surrounding Seattle-Tacoma International Airport, showing labeled grid cells (M through Q, rows 14–17), street names including S. 144th St., S. 148th St., S. 152nd St., 8th Ave. S., 12th Ave. S., and 24th Ave. S., State Route 518, and Des Moines Way. The map identifies 'North Conversion Area' and 'West Conversion Area,' along with nearby elementary schools (Sunny Terrace, Riverton Heights, Sunnydale), consistent with noise impact and land-use conversion planning documents for the Sea-Tac Airport noise policy archive. -
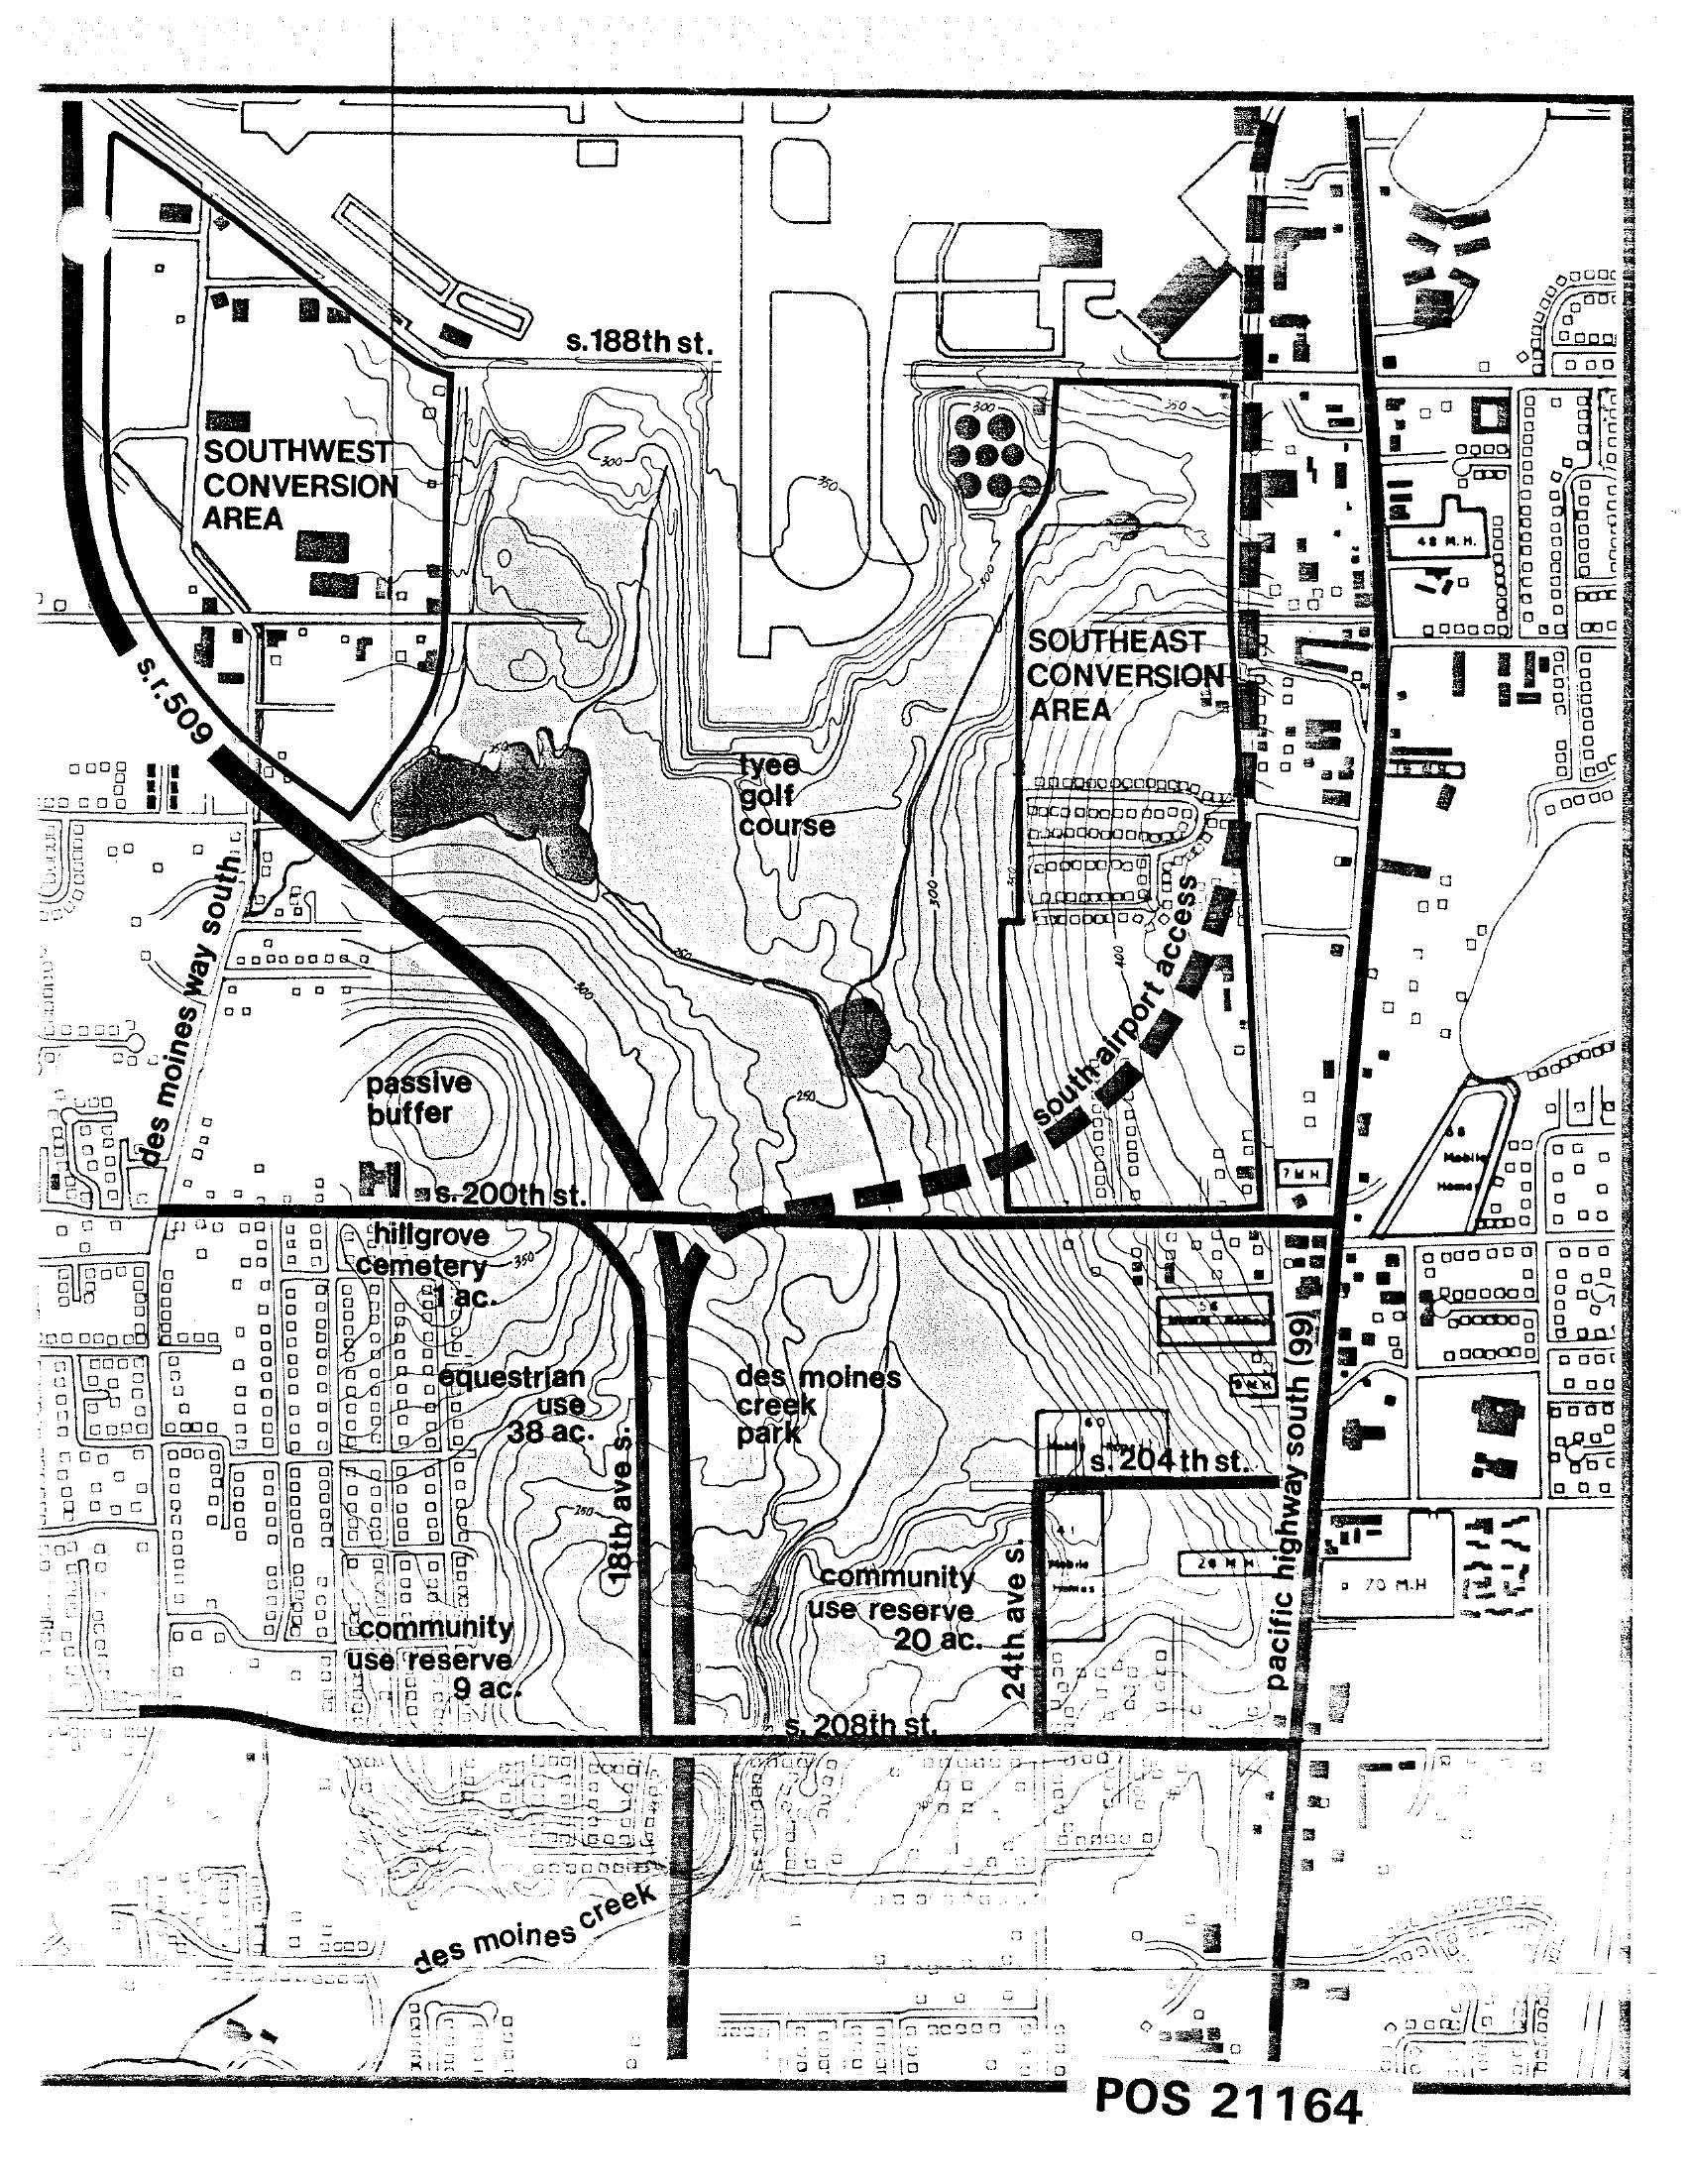
Sea-Tac Communities Plan Area Map — Land Use Planning Zones
Map labeled POS 21164 depicting land use planning zones around Seattle-Tacoma International Airport, including the Southwest Conversion Area, Southeast Conversion Area, Tyee Golf Course, Hillgrove Cemetery, Des Moines Creek Park, passive buffer zones, equestrian use areas, and community use reserves. Key roads shown include S.R. 509, Des Moines Way South, Pacific Highway South (99), and streets S. 188th, S. 200th, S. 204th, and S. 208th. -
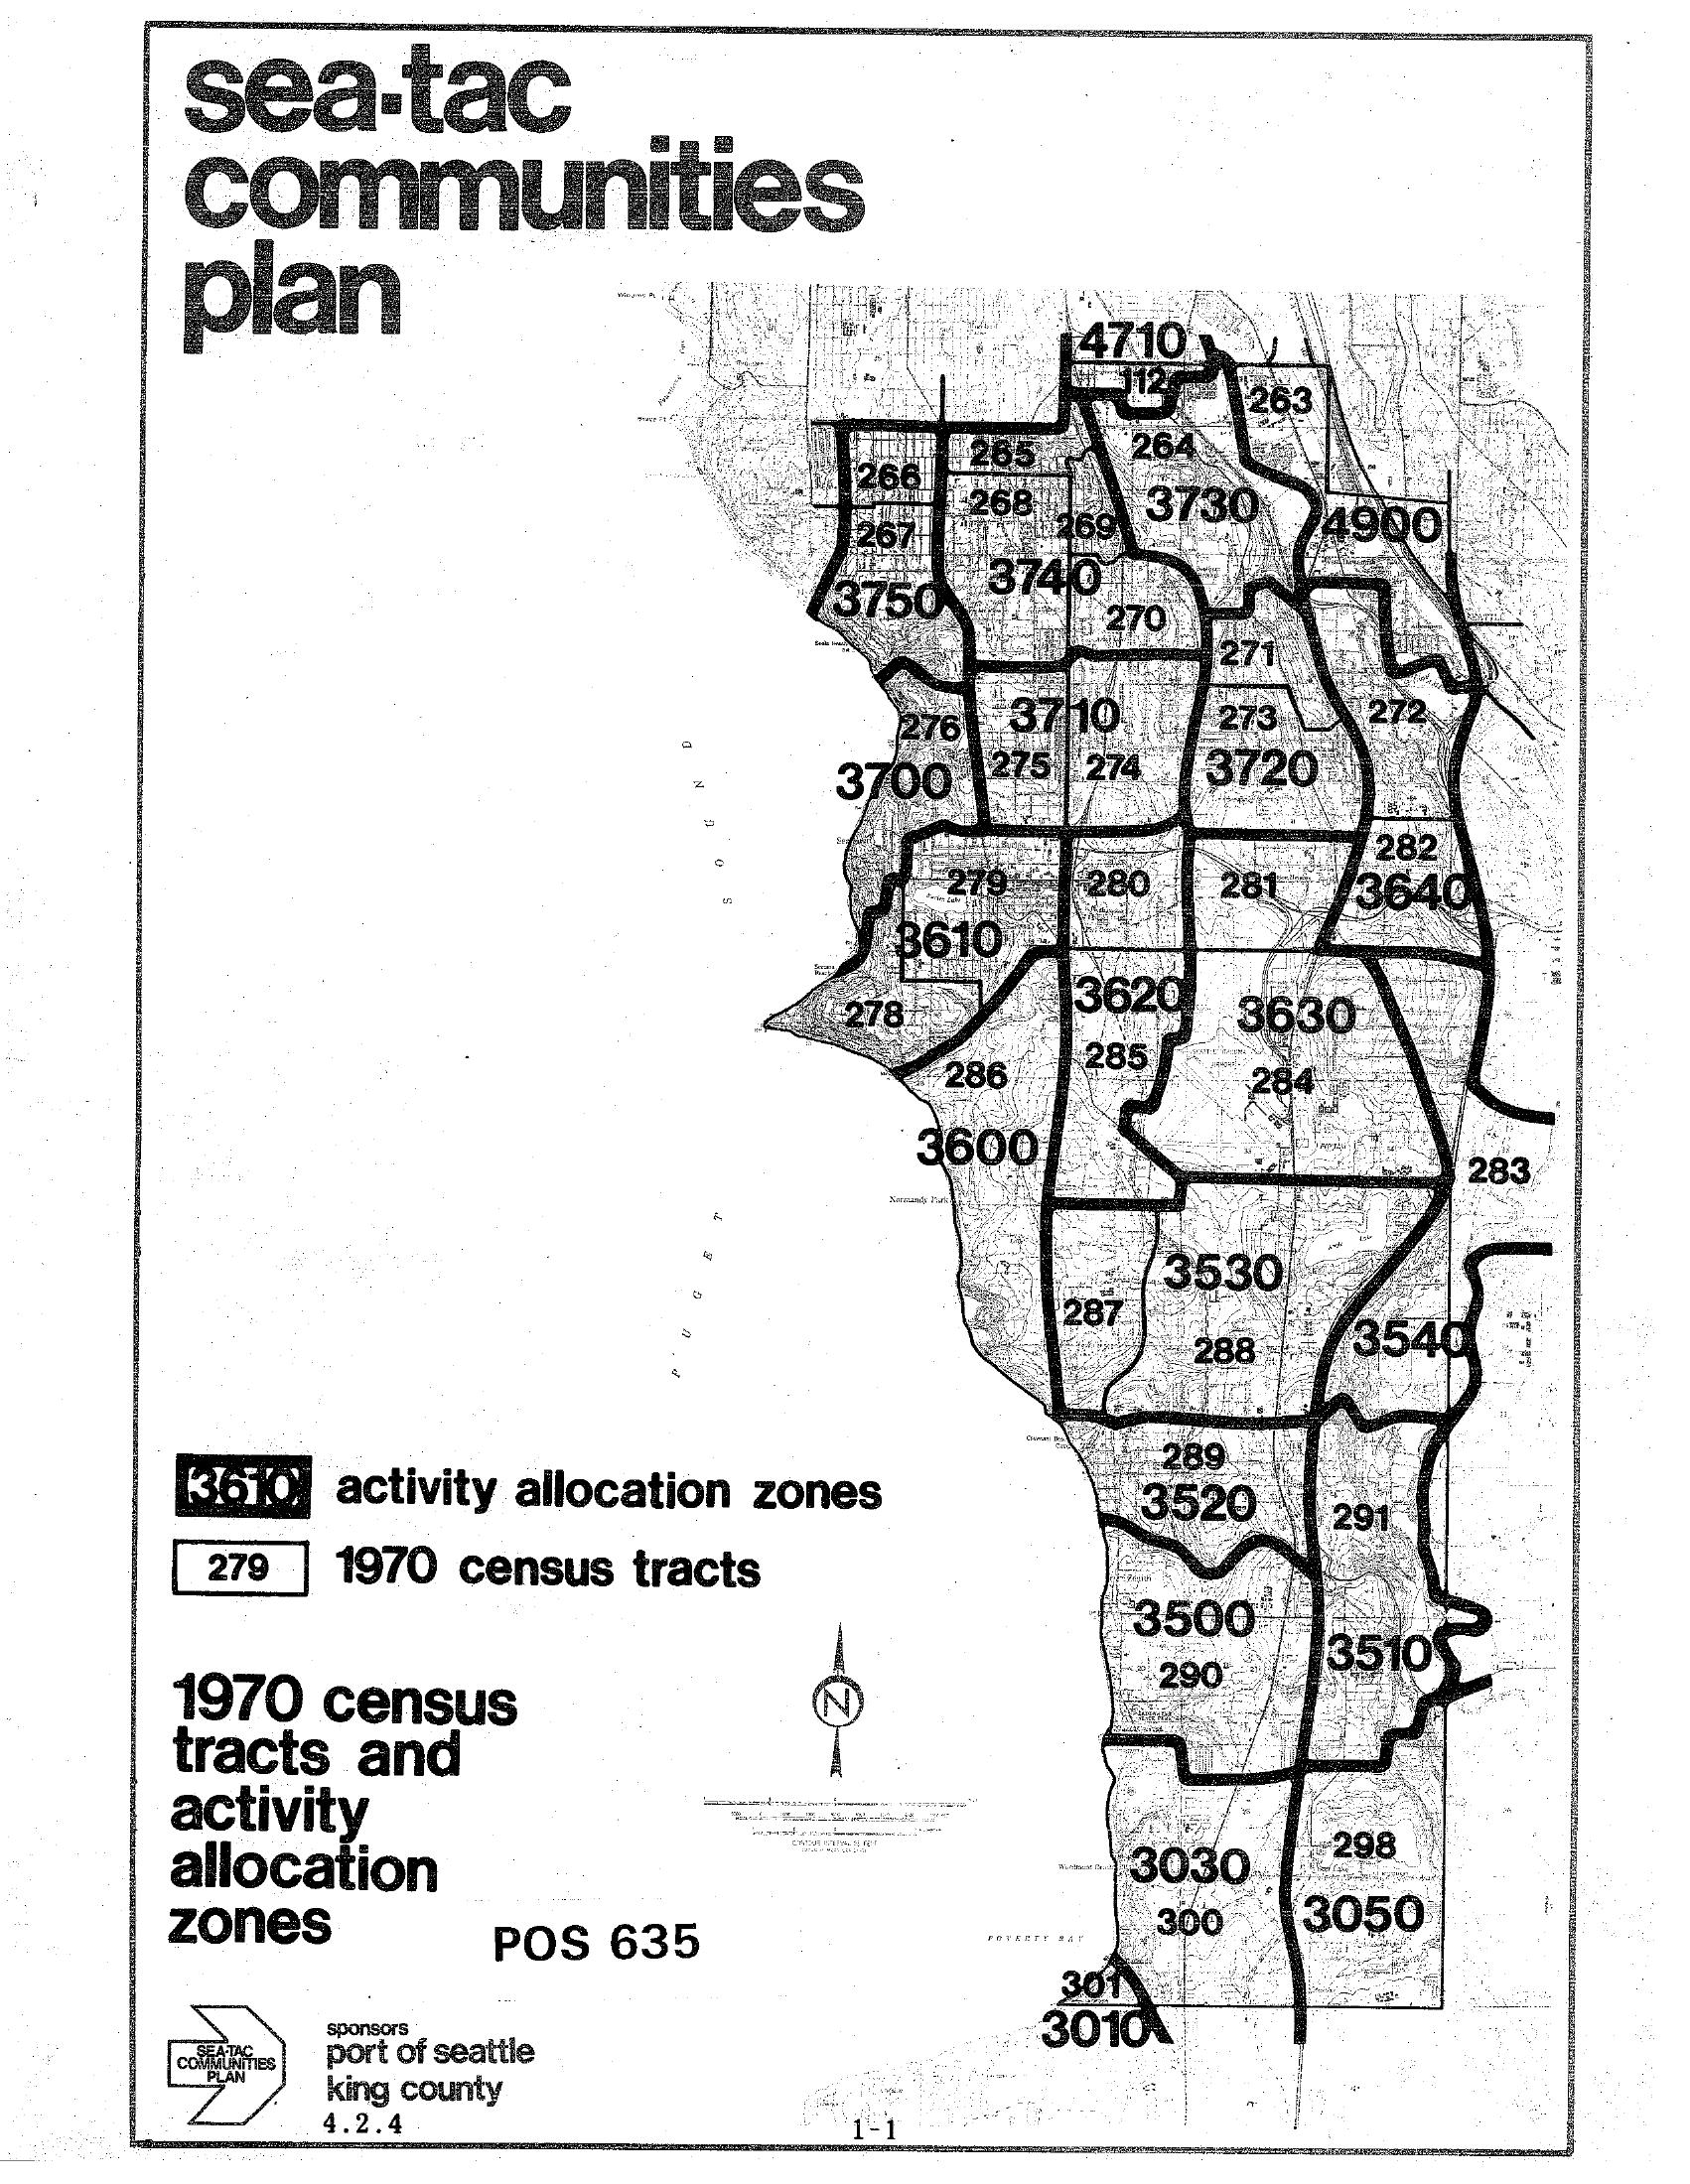
Sea-Tac Communities Plan — 1970 Census Tracts and Activity Allocation Zones Map
A map from the Sea-Tac Communities Plan (document reference POS 635, page 1-1) showing 1970 census tracts and activity allocation zones for the Sea-Tac area. The plan was sponsored by the Port of Seattle and King County, and displays numbered zones (e.g., 3610, 3720, 3740) overlaid on census tract boundaries. -
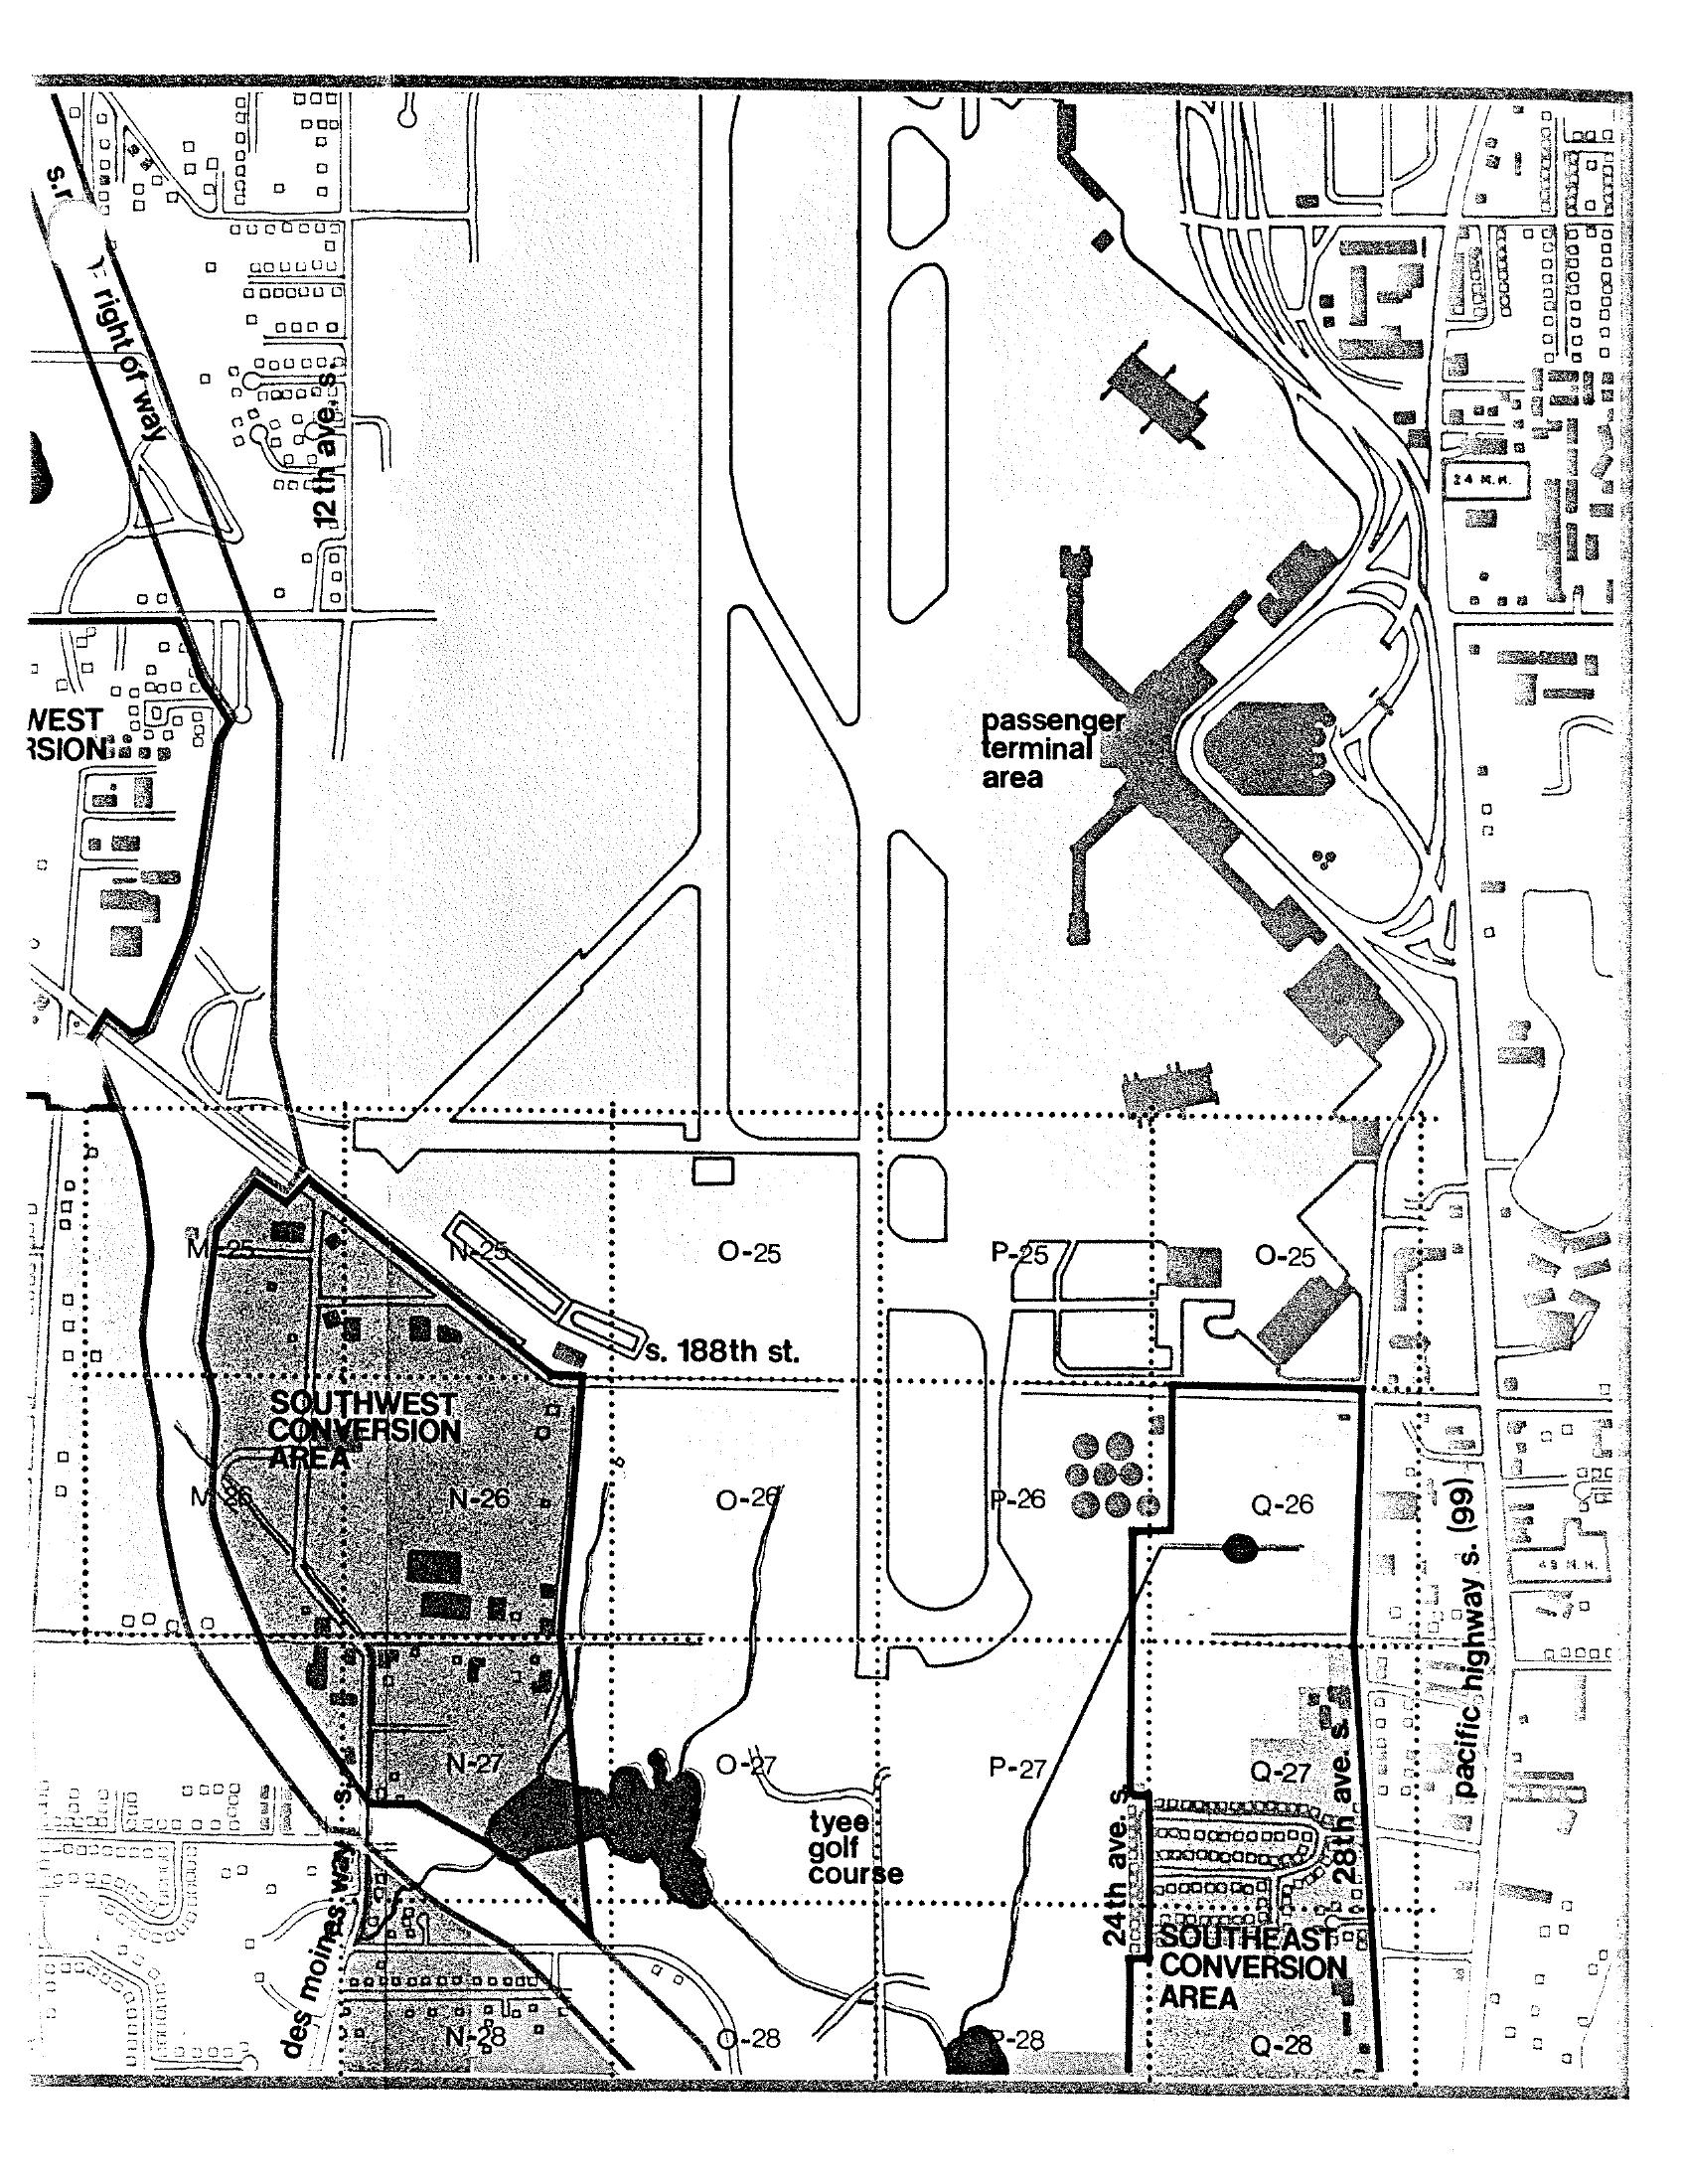
Sea-Tac Airport Master Plan Land Use Conversion Zones Map
A planning map of Seattle-Tacoma International Airport and surrounding areas, showing the passenger terminal area, Southwest Conversion Area, Southeast Conversion Area, Tyee Golf Course, S. 188th St., Des Moines Way S., Pacific Highway S. (99), and a grid coordinate system (M through Q, rows 25–28). The map identifies land use conversion zones south of the airport runways near 24th Ave. S. and 28th Ave. S.