TagFlight Tracks(58)
-
18-120 DailyFTMbyFlow_Page_16
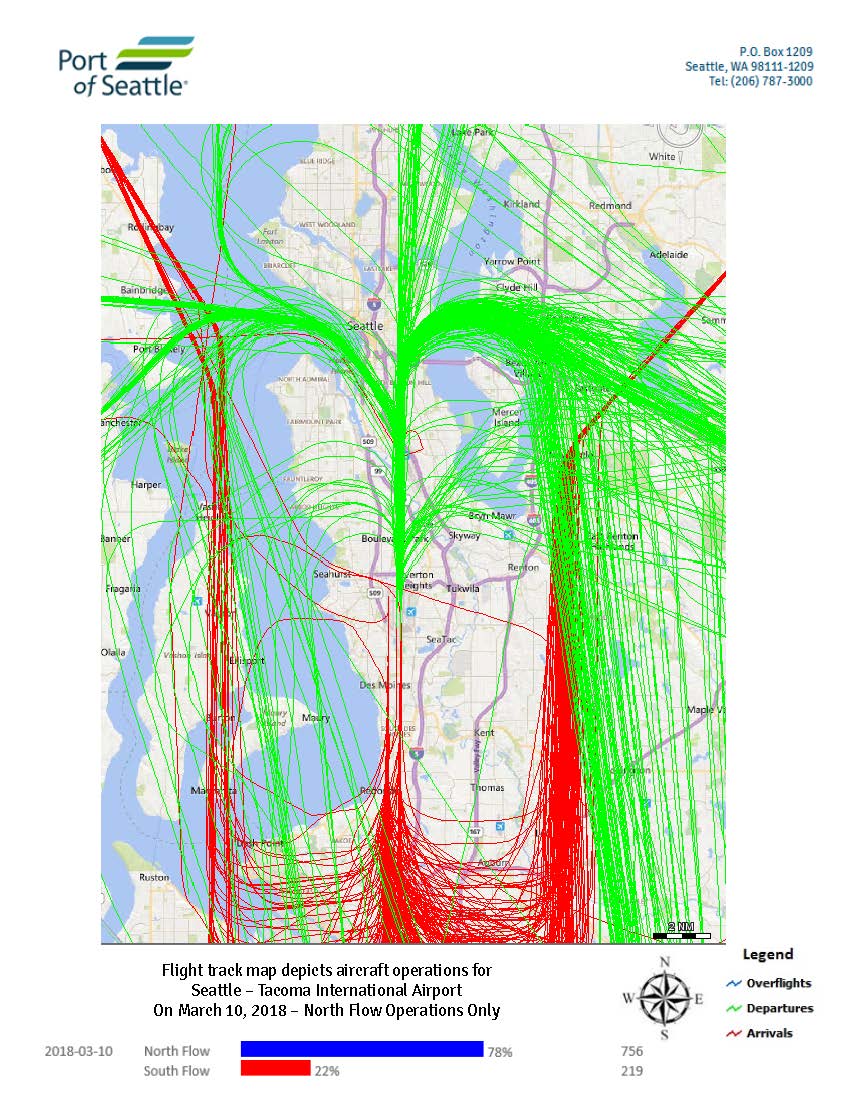
Port of Seattle flight track map showing aircraft operations at Seattle-Tacoma International Airport on March 10, 2018, depicting North Flow operations at 78% (756 operations) and South Flow at 22% (219 operations). Green lines indicate departures, red lines indicate arrivals, and blue/gray lines indicate overflights. -
18-120 DailyFTMbyFlow_Page_18
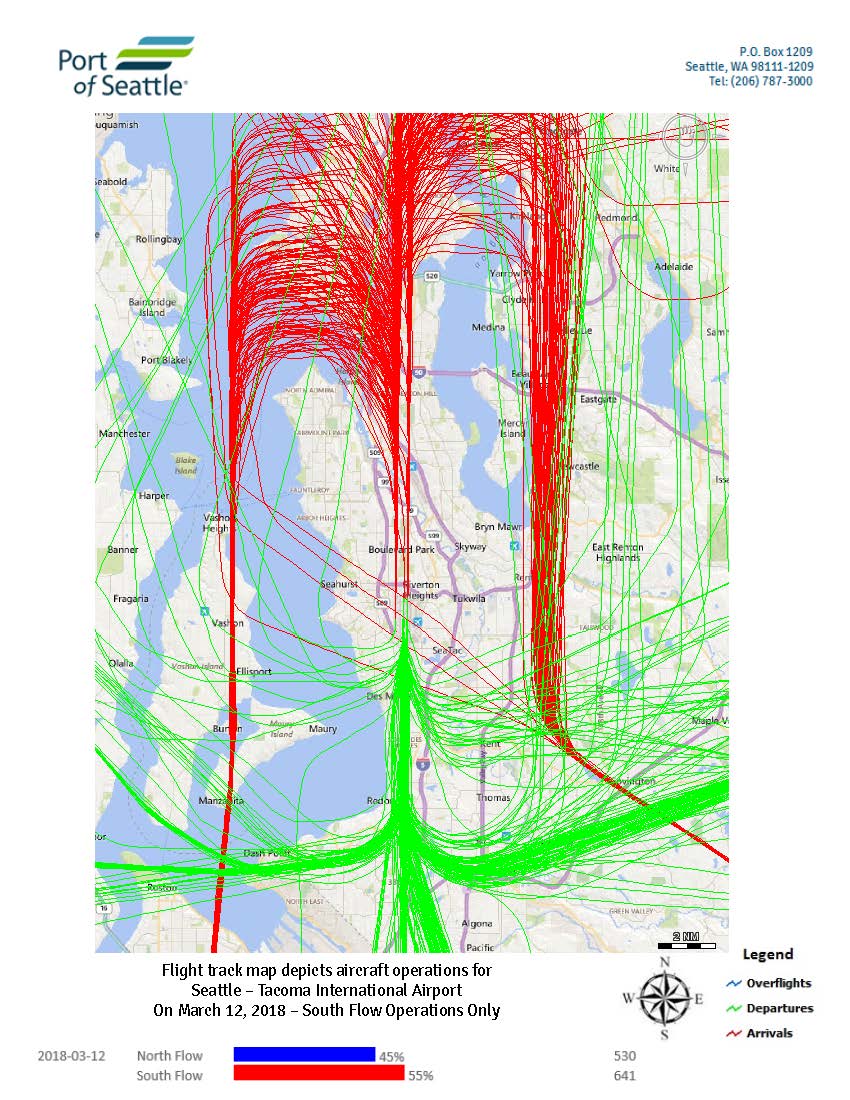
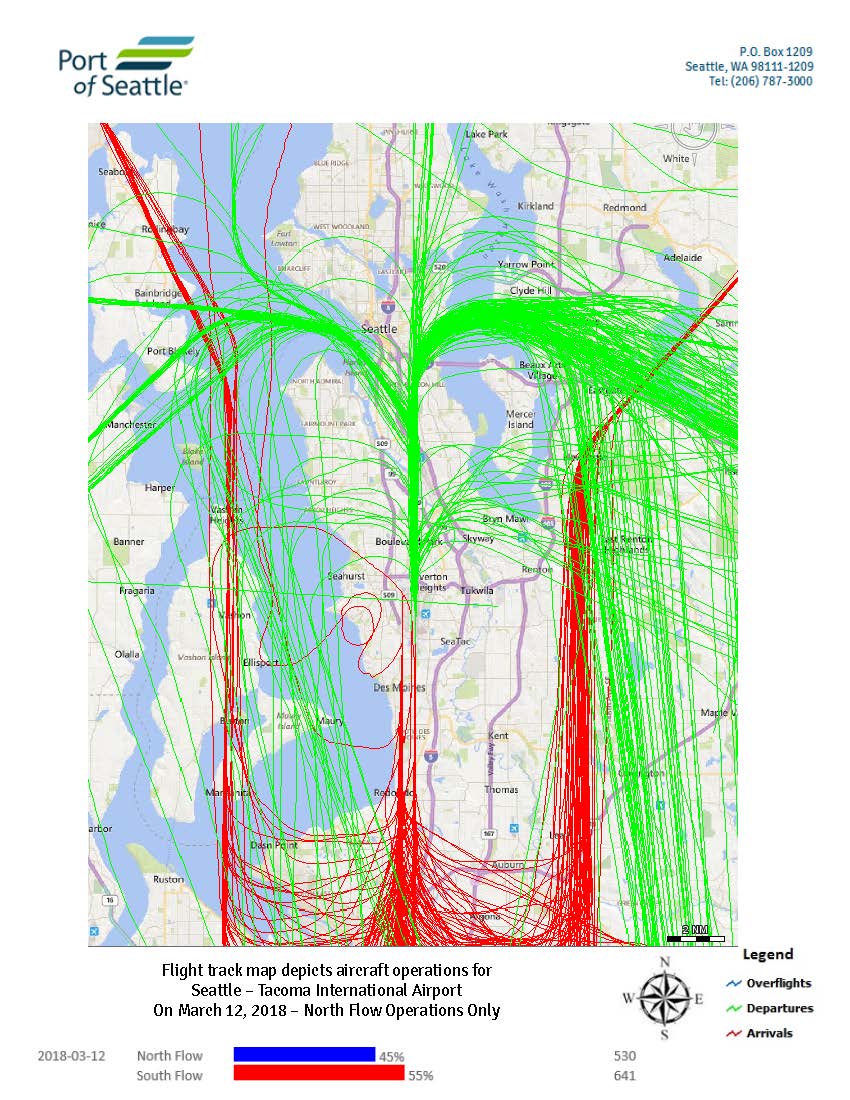
Port of Seattle flight track map depicting aircraft operations at Seattle-Tacoma International Airport on March 12, 2018, showing South Flow operations only. On that date, North Flow accounted for 45% of operations (530 flights) and South Flow accounted for 55% (641 flights); arrival tracks are shown in red and departure tracks in green. -
18-120 DailyFTMbyFlow_Page_17
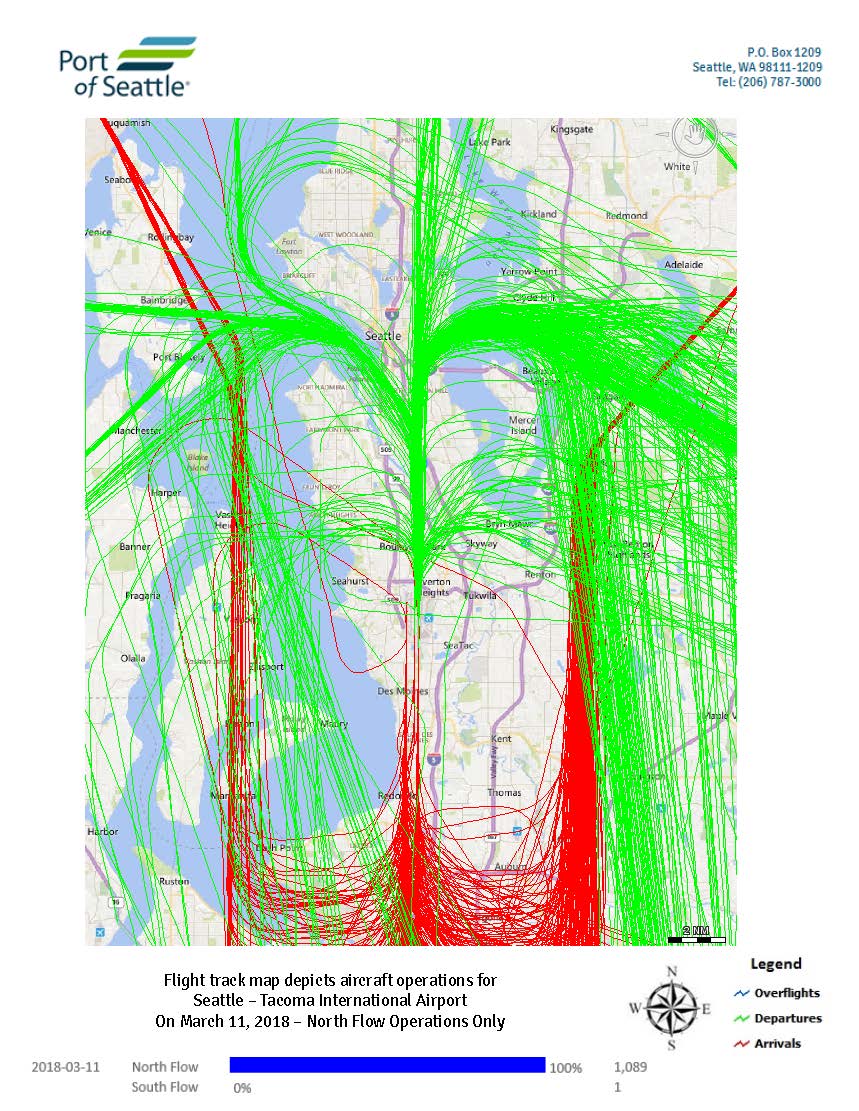
A Port of Seattle flight track map depicting all aircraft operations at Seattle-Tacoma International Airport on March 11, 2018, during North Flow operations only. The map shows 1,089 total operations (100% North Flow), with green lines indicating departures, red lines indicating arrivals, and blue lines indicating overflights, overlaid on a geographic map of the greater Seattle-Tacoma area. -
18-120 DailyFTMbyFlow_Page_20
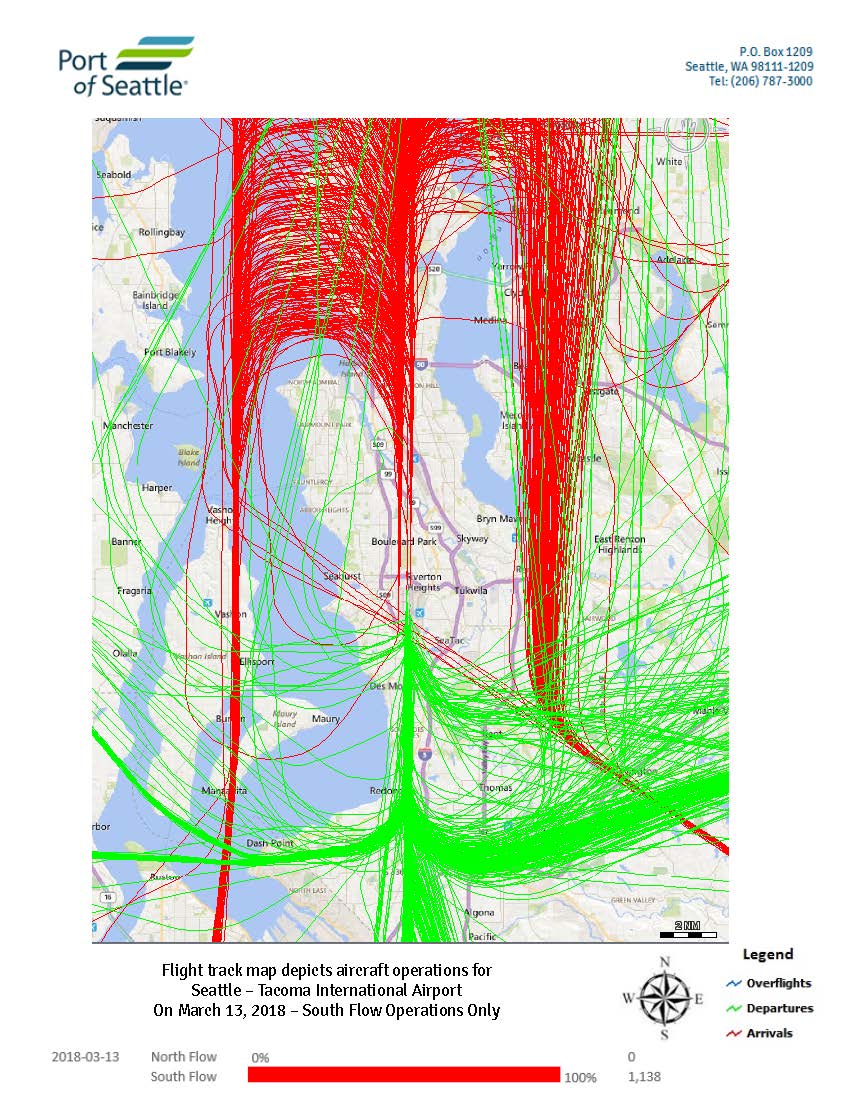
A Port of Seattle flight track map depicting all aircraft operations at Seattle-Tacoma International Airport on March 13, 2018, during South Flow operations only. The map shows 1,138 total operations at 100% South Flow, with green lines indicating departures, red lines indicating arrivals, and blue lines indicating overflights, overlaid on a geographic map of the greater Seattle-Tacoma area. -
18-120 DailyFTMbyFlow_Page_19
Port of Seattle flight track map showing aircraft operations at Seattle-Tacoma International Airport on March 12, 2018, depicting North Flow operations only. Green lines indicate departures and red lines indicate arrivals; North Flow accounted for 45% (530 operations) and South Flow 55% (641 operations) of the day's traffic. -
18-120 DailyFTMbyFlow_Page_22
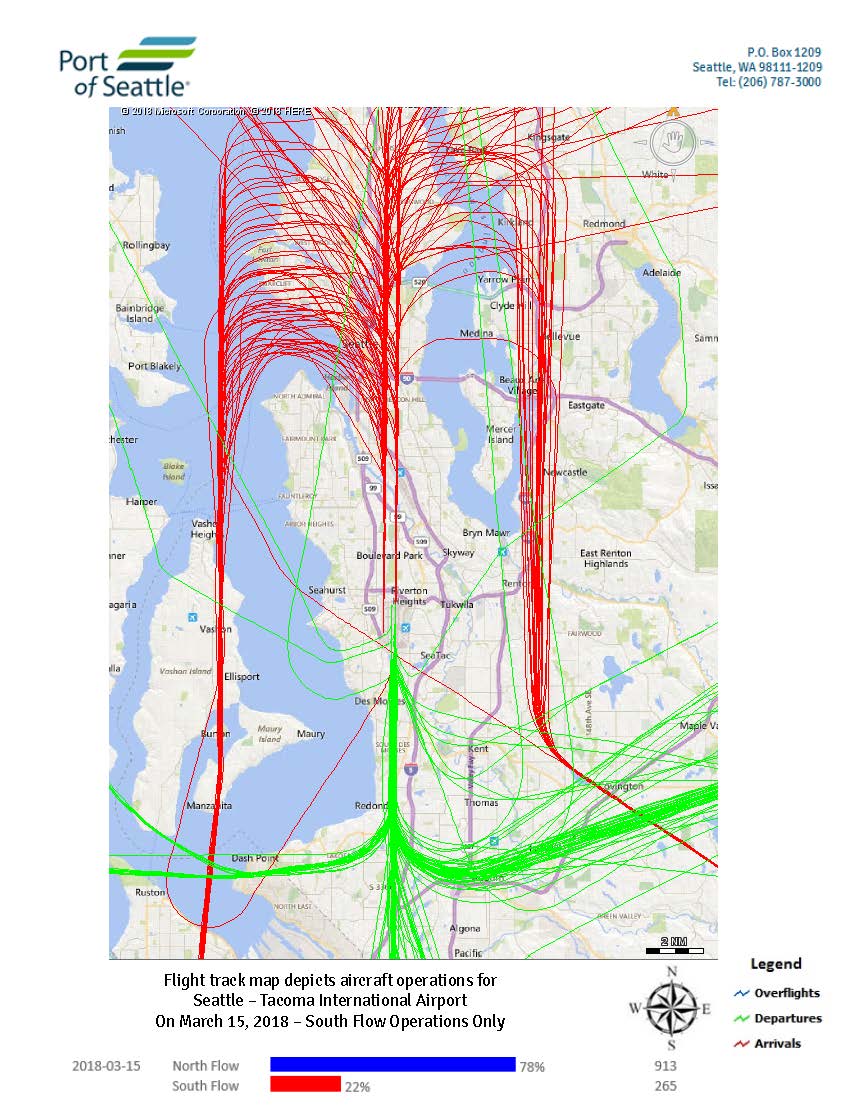
A Port of Seattle flight track map depicting aircraft operations at Seattle-Tacoma International Airport on March 15, 2018, showing South Flow operations only. The map displays arrivals (red), departures (green), and overflights (blue), with data indicating 78% North Flow (913 operations) and 22% South Flow (265 operations) for that date. -
18-120 DailyFTMbyFlow_Page_21
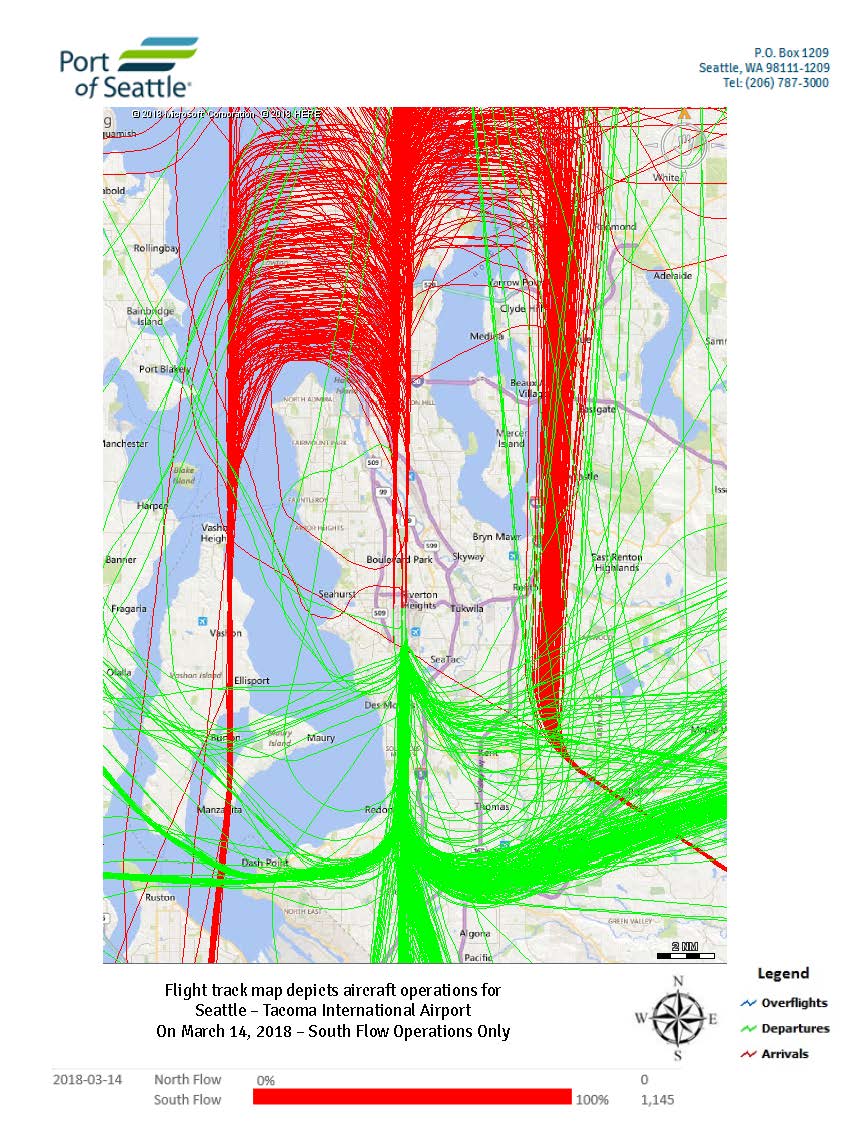
Port of Seattle flight track map depicting aircraft operations at Seattle-Tacoma International Airport on March 14, 2018, showing 100% South Flow operations totaling 1,145 flights. The map displays arrivals (red), departures (green), and overflights (blue) over the greater Seattle-Tacoma area. -
18-120 DailyFTMbyFlow_Page_24
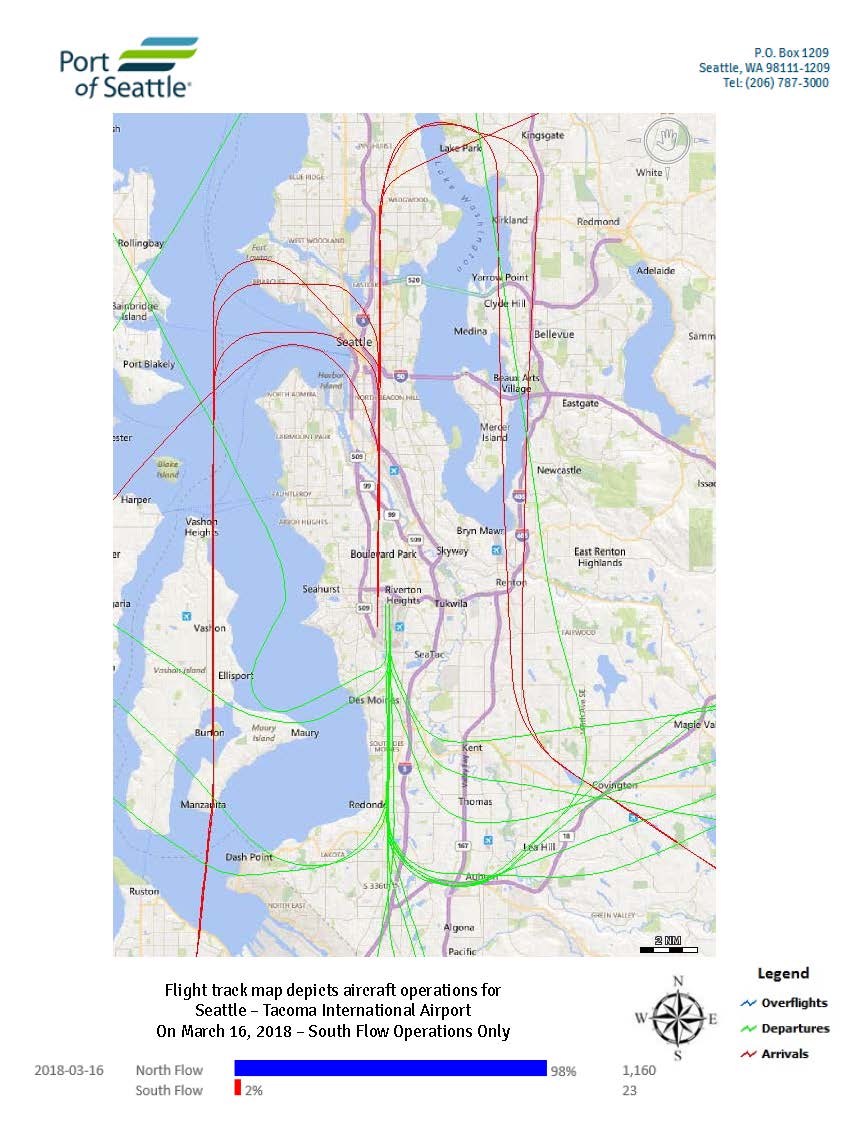
Port of Seattle flight track map depicting aircraft operations at Seattle-Tacoma International Airport on March 16, 2018, showing South Flow Operations Only. On that date, North Flow accounted for 98% of operations (1,160 flights) while South Flow accounted for 2% (23 flights); the map displays overflights (blue), departures (green), and arrivals (red) across the greater Seattle-Tacoma area. -
18-120 DailyFTMbyFlow_Page_23
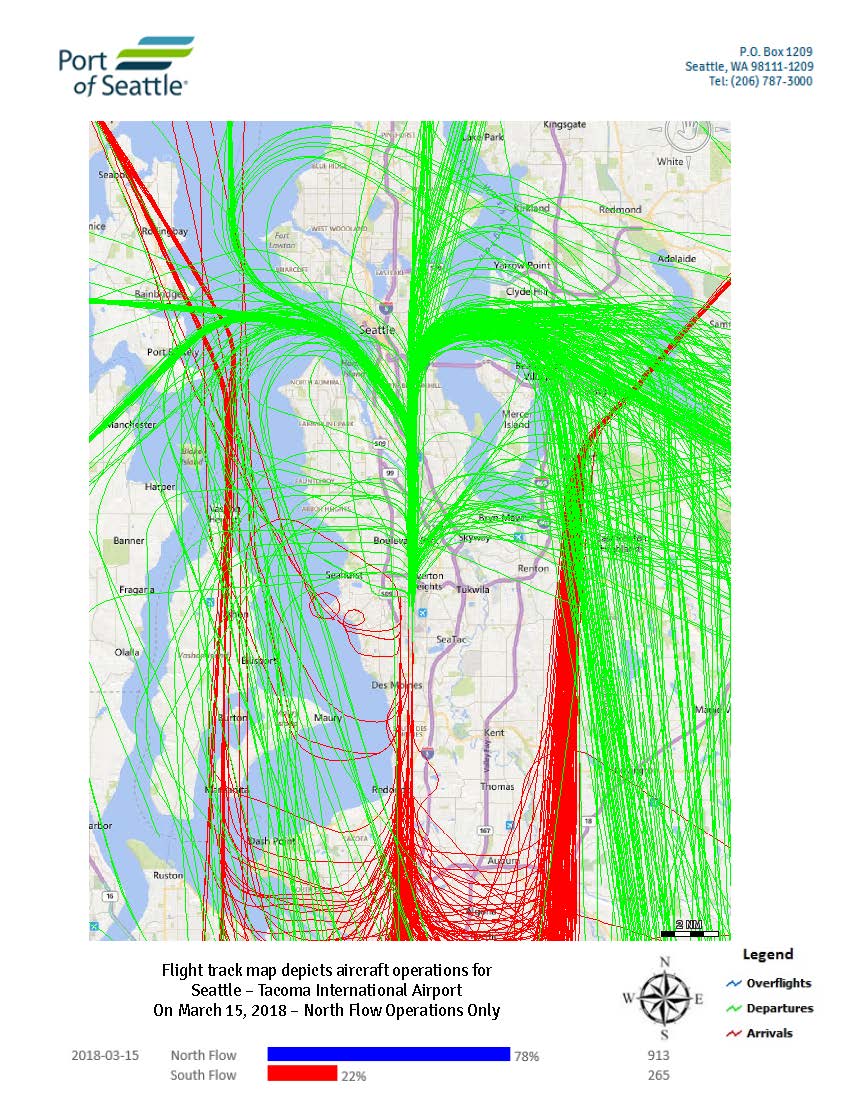
Port of Seattle flight track map depicting aircraft operations at Seattle-Tacoma International Airport on March 15, 2018, showing North Flow operations only (78%, 913 flights) and South Flow (22%, 265 flights). Green lines indicate departures, red lines indicate arrivals, and blue lines indicate overflights, with tracks shown over the greater Seattle-Tacoma metropolitan area. -
18-120 DailyFTMbyFlow_Page_26
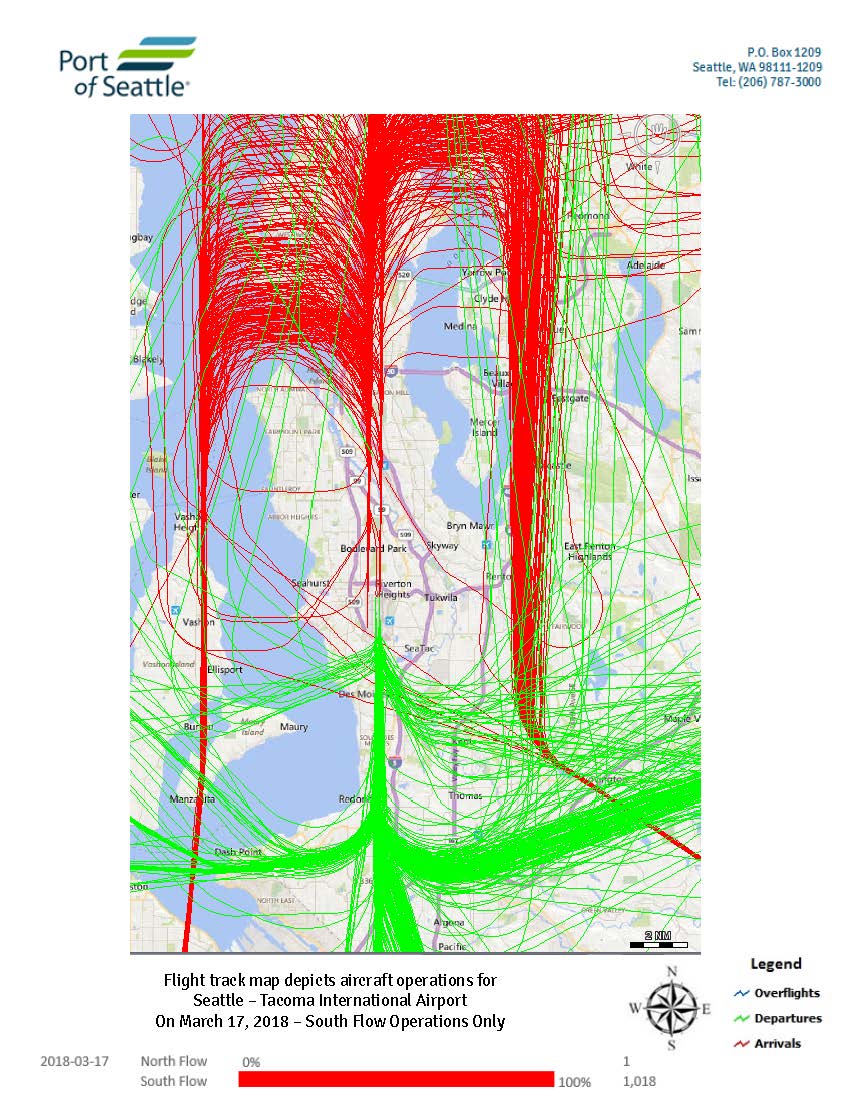
This Port of Seattle flight track map depicts all aircraft operations at Seattle-Tacoma International Airport on March 17, 2018, during 100% South Flow conditions, totaling 1,018 operations. Green lines represent departures, red lines represent arrivals, and blue lines represent overflights, with flight paths concentrated over the Puget Sound region and surrounding communities.