TagSea-Tac Airport(1855)
-
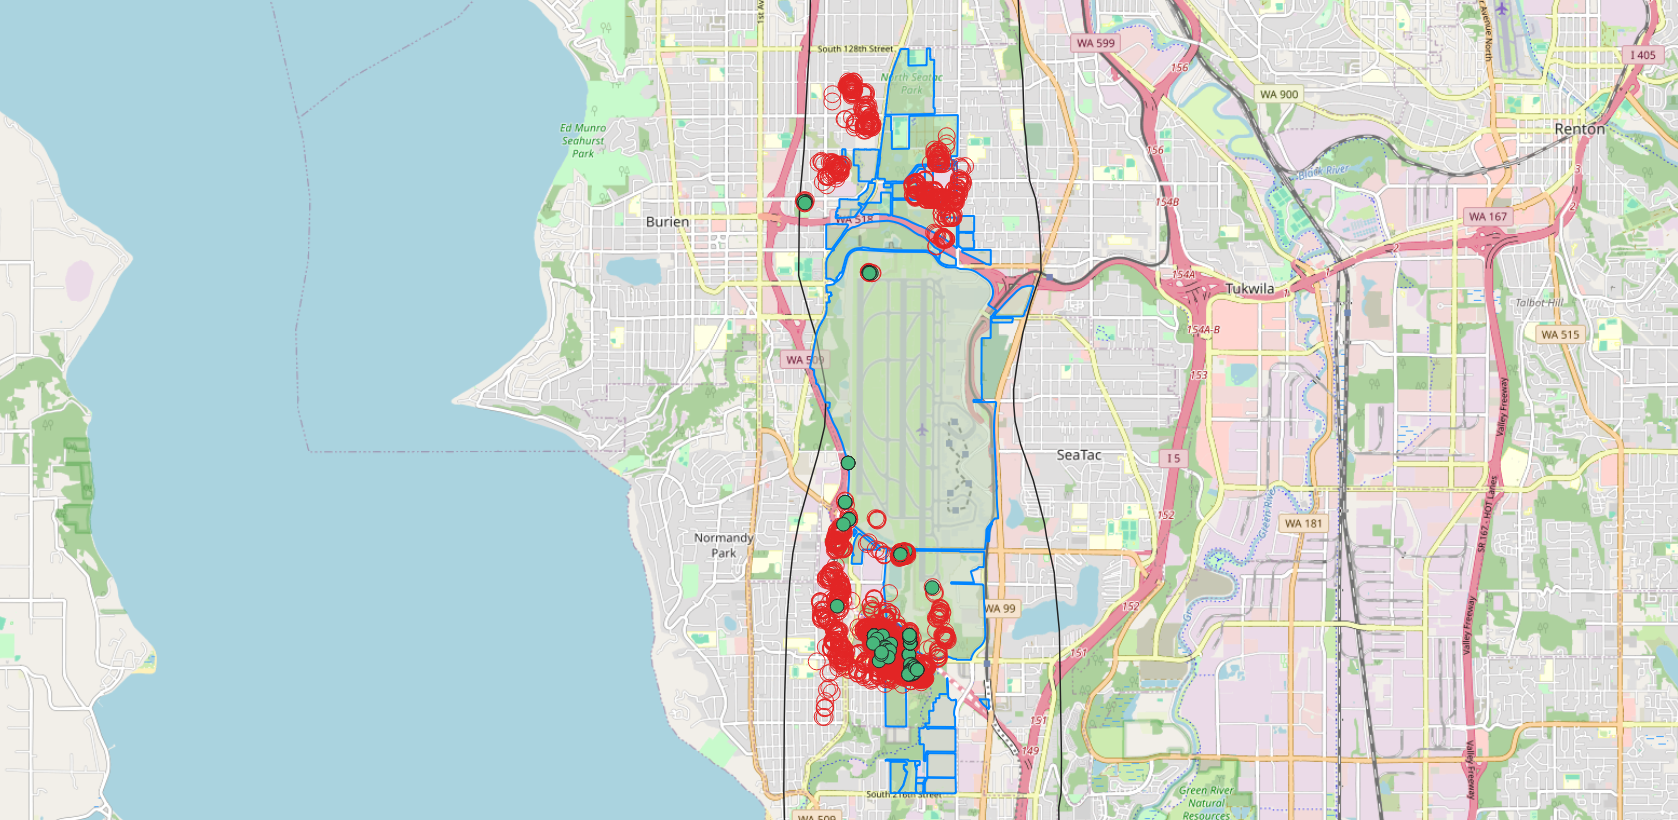
Port Properties and Trees GIS
A map centered on Seattle-Tacoma International Airport (Sea-Tac) showing clusters of red circles and green dots overlaid on the airport and surrounding communities including Burien, SeaTac, Tukwila, and Normandy Park. The blue outlined polygon appears to delineate a municipal or study boundary, and the red/green markers likely represent noise complaint locations or flight track data points used in airport noise policy analysis. -
 2025-08-12
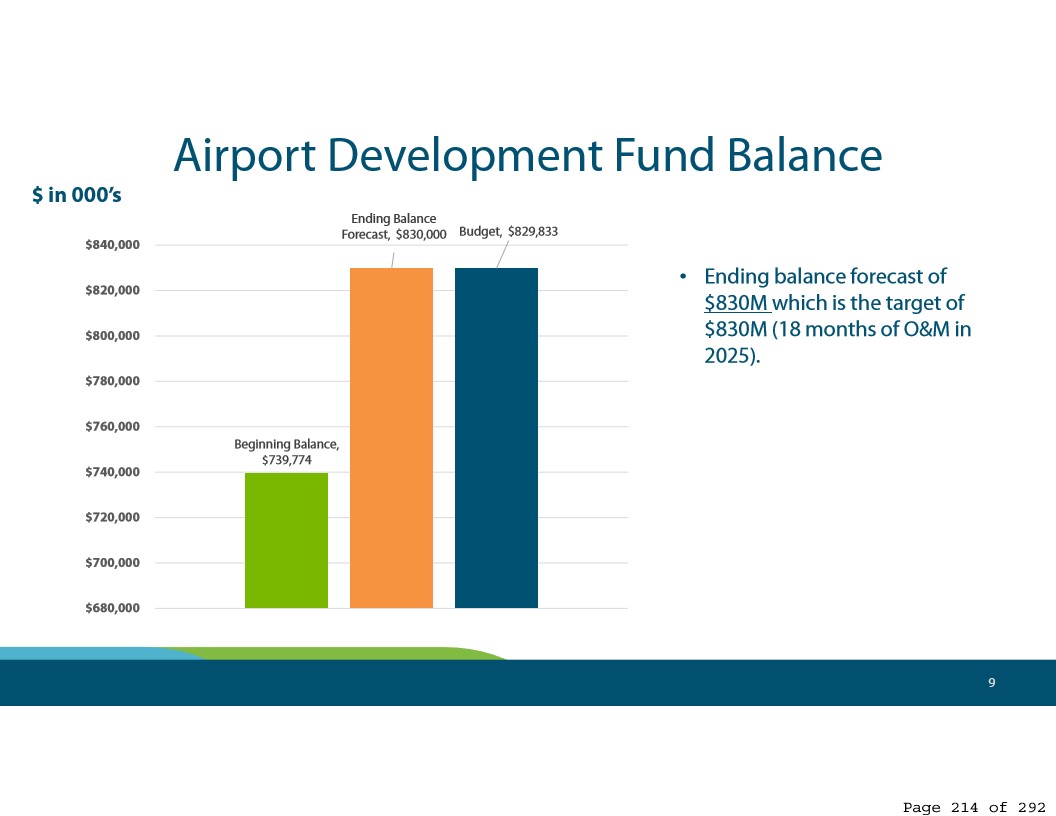
Sea-Tac Airport Development Fund Balance — Financial Presentation (Page 214)
A bar chart from a Sea-Tac Airport financial presentation (page 214 of 292) showing the Airport Development Fund Balance with a beginning balance of $739,774 thousand, an ending balance forecast of $830,000 thousand, and a budget of $829,833 thousand. The slide notes the ending balance forecast of $830M meets the target of 18 months of O&M in 2025. -
 2025-08-12
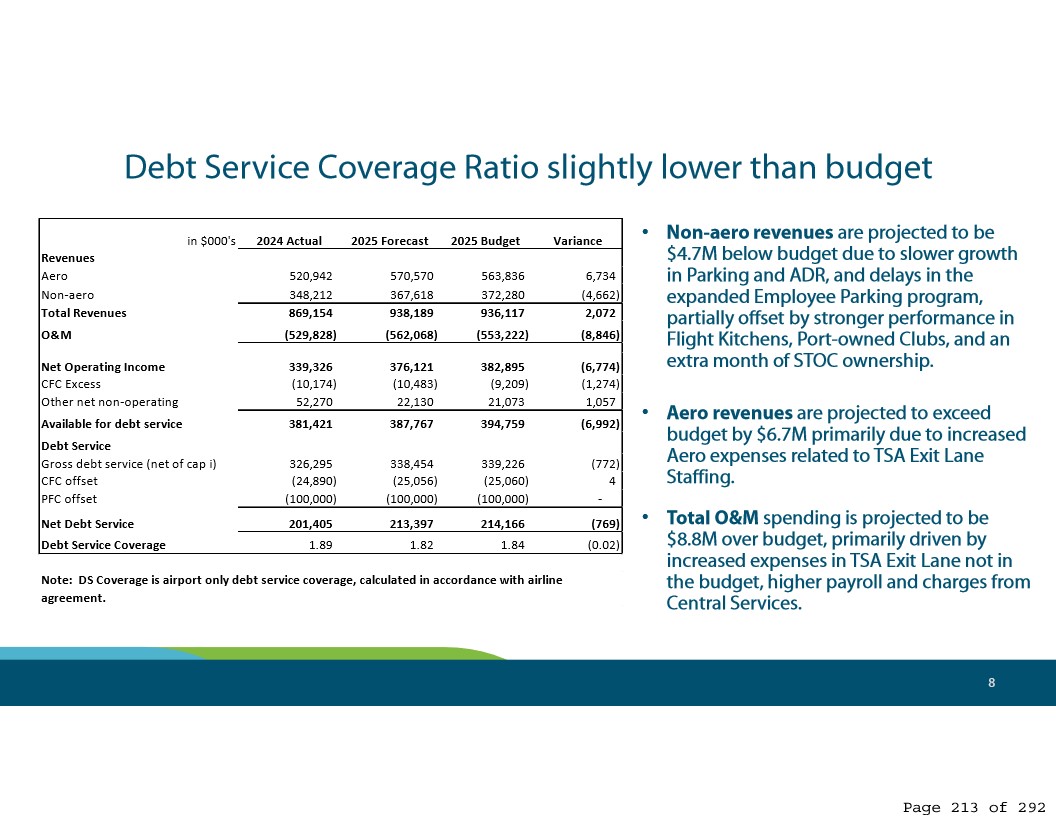
Port Of Seattle Debt Service Coverage Ratio — 2025 Forecast vs. Budget (Page 213)
A financial presentation slide from the Port of Seattle (Sea-Tac Airport) showing the Debt Service Coverage Ratio for 2025, comparing actual 2024 figures, 2025 forecast, and 2025 budget. The slide indicates the debt service coverage ratio is 1.82 (forecast) versus a budgeted 1.84, with total revenues of $938,189K forecasted, and notes that non-aero revenues are projected $4.7M below budget while O&M spending is projected $8.8M over budget. This is page 213 of 292 of a larger document. -
 2025-08-12
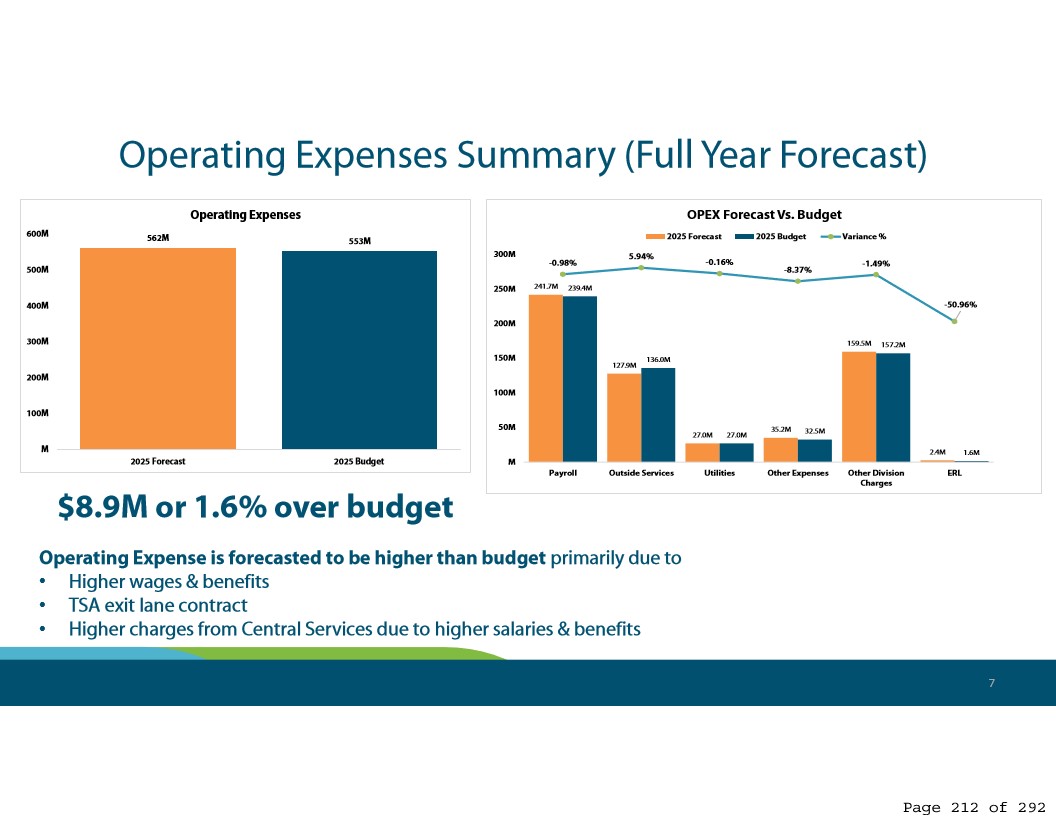
Sea-Tac Airport 2025 Operating Expenses vs. Budget — RM Packet Slide 212 (August 12, 2025)
A financial presentation slide showing 2025 operating expenses forecasted at $562M versus a budget of $553M, representing $8.9M or 1.6% over budget. The OPEX breakdown by category (Payroll, Outside Services, Utilities, Other Expenses, Other Division Charges, ERL) attributes the overage primarily to higher wages and benefits, a TSA exit lane contract, and higher Central Services charges. -
 2025-08-12
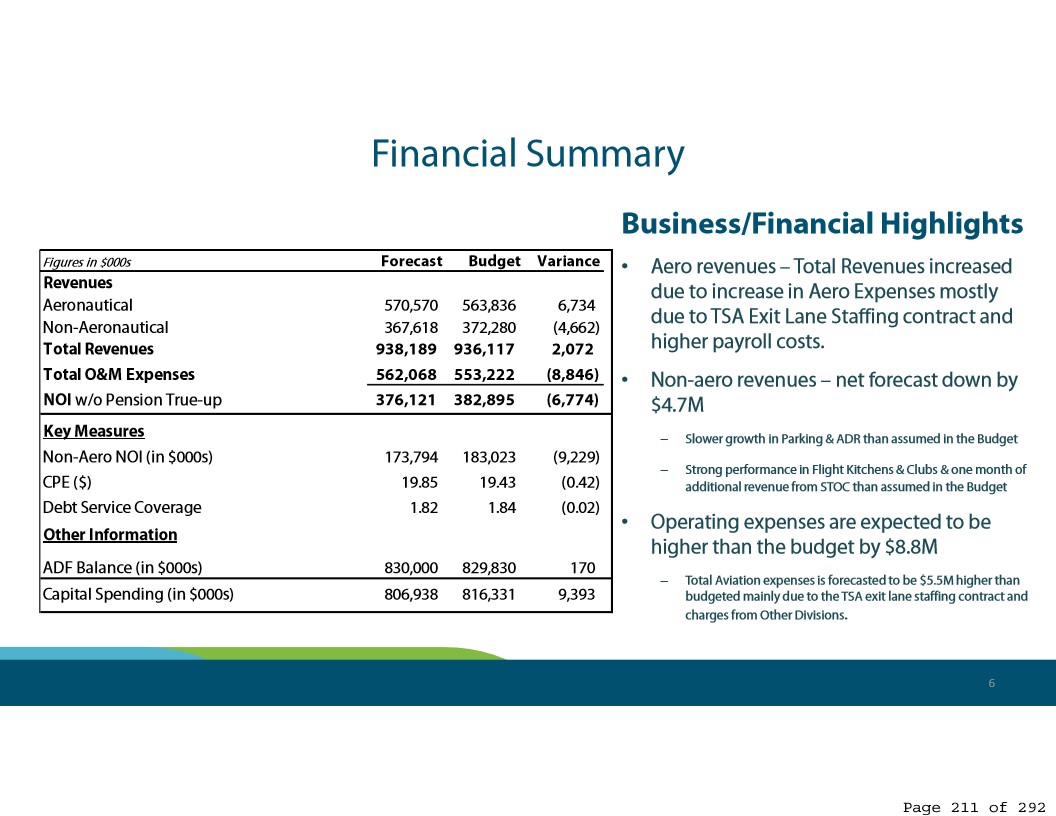
Sea-Tac Airport Financial Summary: Revenue and O&M Expense Forecast vs. Budget — Slide 211
A financial summary presentation slide showing revenue, O&M expenses, and key measures comparing forecast versus budget figures in thousands of dollars. Total revenues forecast at $938,189K versus budget of $936,117K, with operating expenses expected to exceed budget by $8.8M, partly attributed to TSA exit lane staffing contracts. -
 2025-08-12
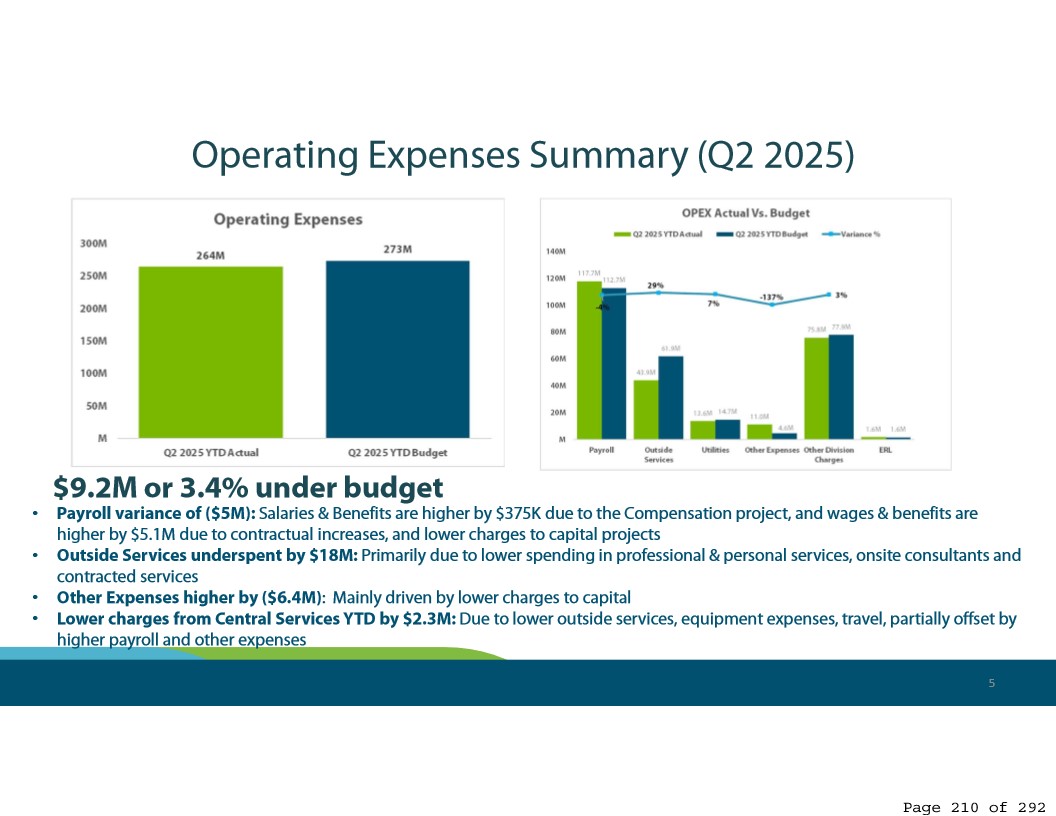
Port Of Seattle Commission Regular Meeting — Q2 2025 YTD Operating Expenses Financial Summary (Slide 210)
A financial summary slide showing Q2 2025 Year-To-Date operating expenses of $264M actual versus $273M budgeted, resulting in $9.2M or 3.4% under budget. Key variances include a $5M payroll overrun, $18M underspend in outside services, $6.4M higher other expenses, and $2.3M lower central services charges. -
 2025-08-12
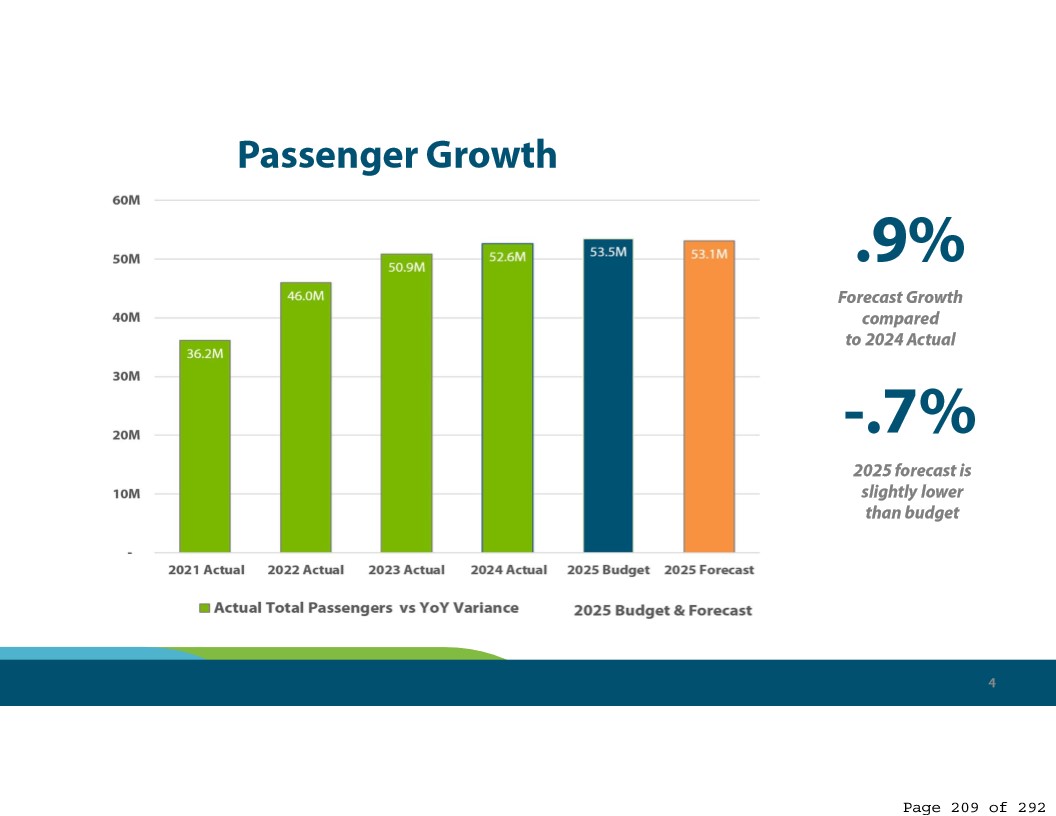
Sea-Tac Airport 2025 Passenger Forecast vs. Budget — RM Packet (Page 209)
A bar chart from a Sea-Tac Airport budget/forecast presentation (page 209 of 292) showing actual total passengers from 2021 (36.2M) through 2024 (52.6M), alongside a 2025 budget of 53.5M and 2025 forecast of 53.1M. The slide notes a 0.9% forecast growth compared to 2024 actual, and that the 2025 forecast is 0.7% lower than budget. -
 2025-08-12
Port Of Seattle Aviation Division 2025 Second Quarter Financial Performance Report — Title Slide (Page 208)
Title slide for the Port of Seattle Aviation Division's 2025 Second Quarter Financial Performance Report, bearing the Port of Seattle logo. This document appears on page 208 of a 292-page report. -
 2025-08-12
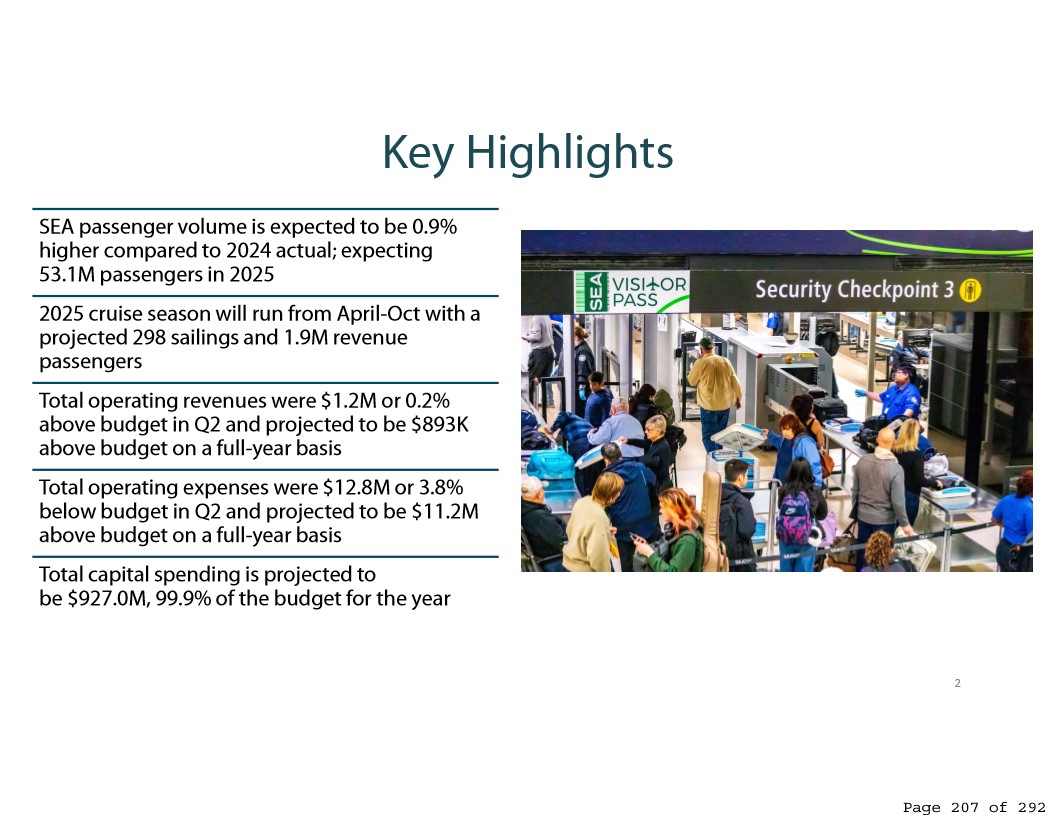
Sea-Tac Airport Operational Highlights — Slide 207 (August 12, 2025 RM Packet)
A presentation slide summarizing key operational highlights for Seattle-Tacoma International Airport (SEA), including projected 2025 passenger volume of 53.1M (0.9% above 2024 actuals), a 2025 cruise season with 298 sailings and 1.9M revenue passengers, Q2 operating revenues $1.2M above budget, and total capital spending projected at $927.0M. The accompanying photo shows passengers at SEA Security Checkpoint 3 with a visible 'SEA Visitor Pass' sign. -
 2025-08-12
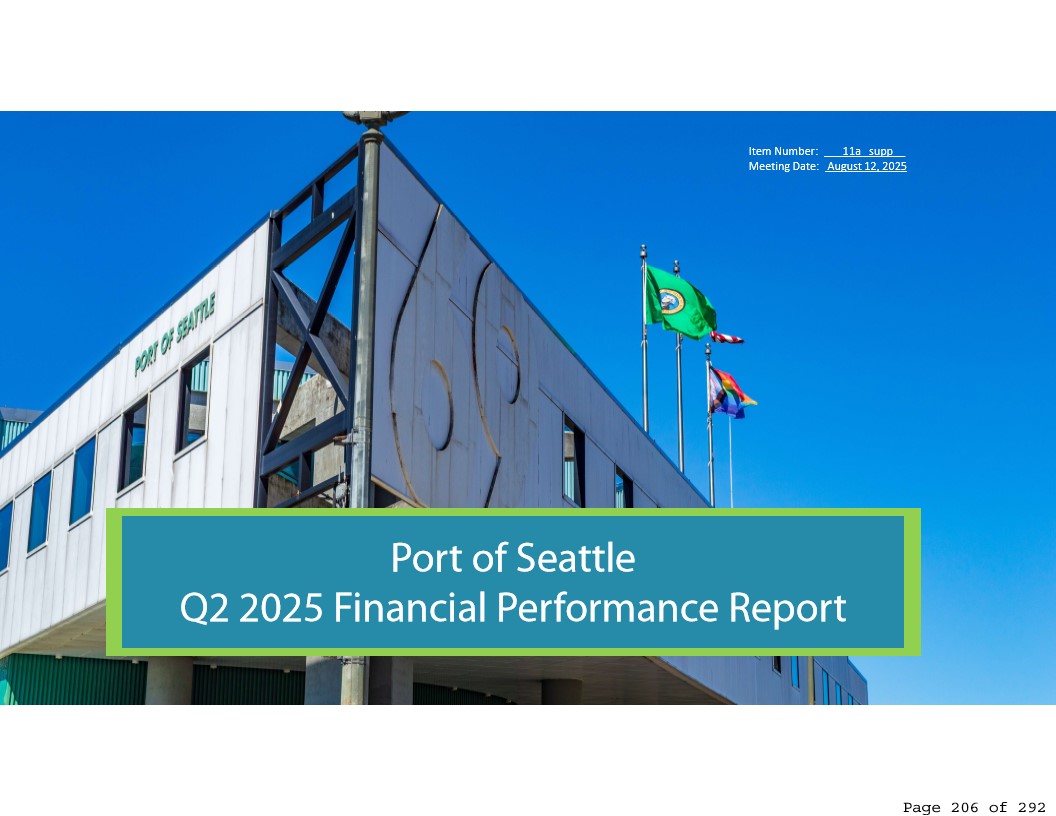
Port Of Seattle Q2 2025 Financial Performance Report Cover — August 12, 2025 RM Packet (Page 206)
Cover page of the Port of Seattle Q2 2025 Financial Performance Report, presented as Item Number 11a supp at a meeting dated August 12, 2025. The image shows the Port of Seattle headquarters building with flags flying, and the document is page 206 of 292.