TagProperty Tax Levy(83)
-
 2024-10-22
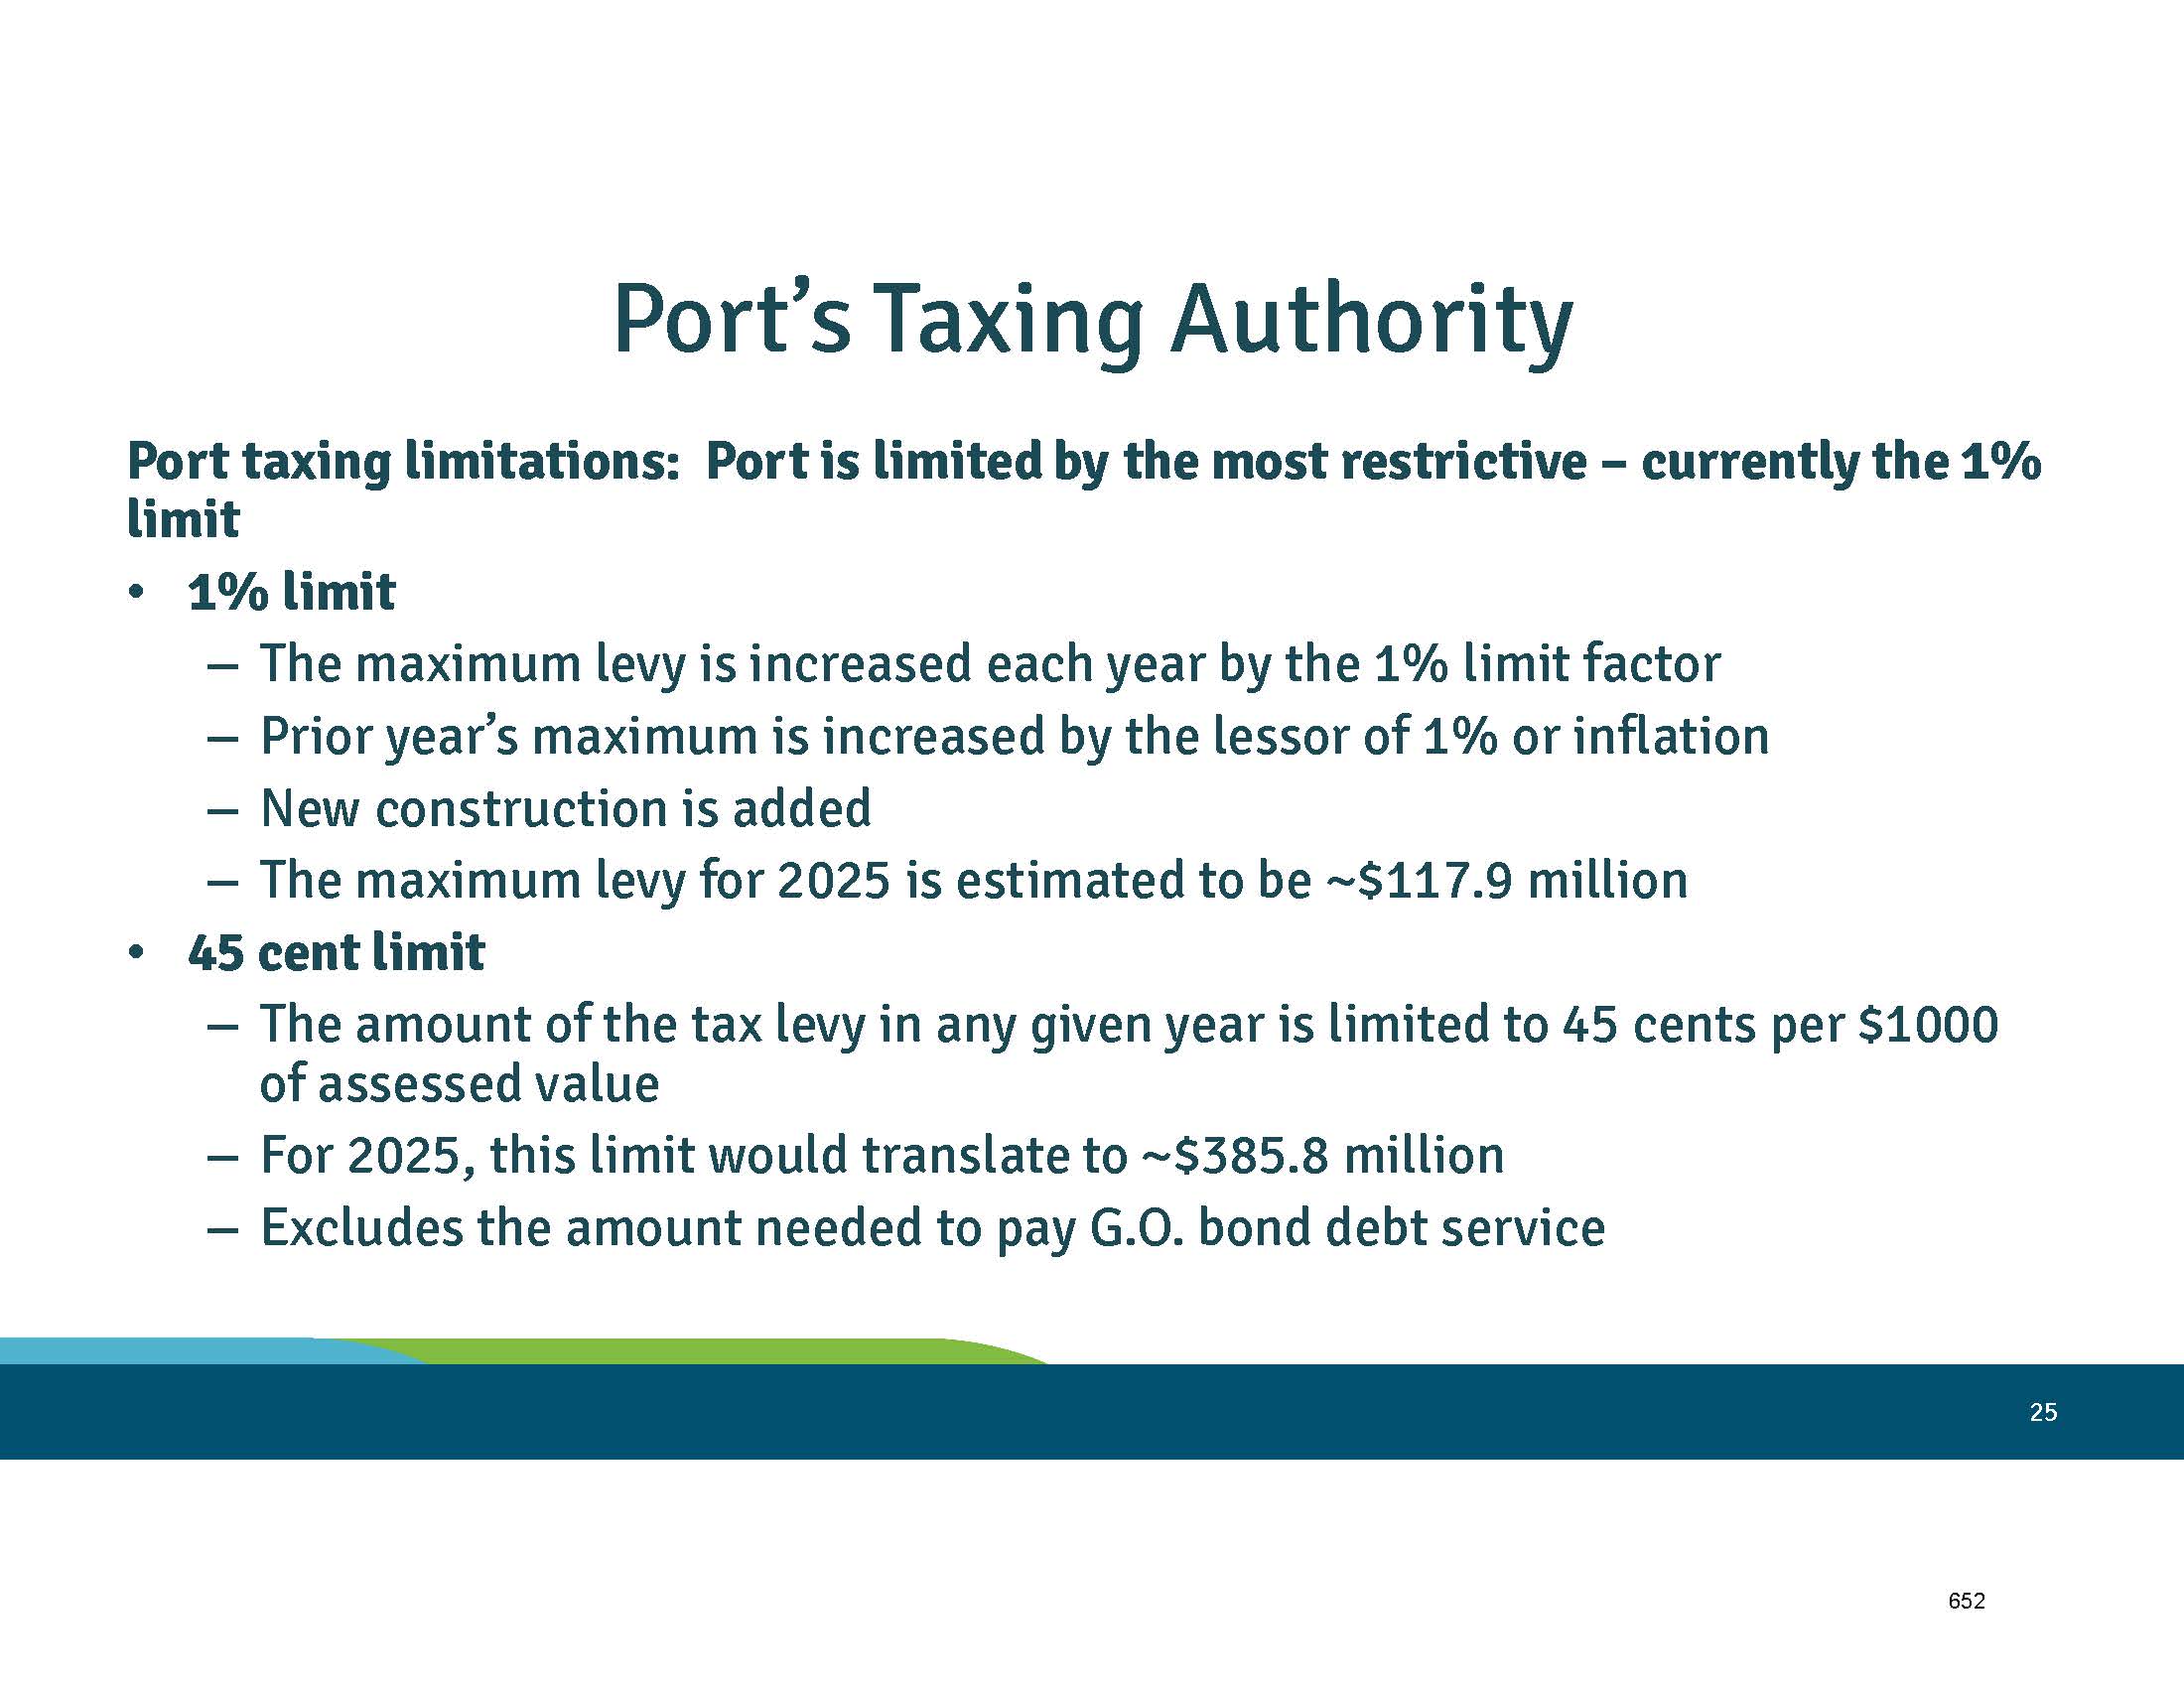
Port Of Seattle Taxing Authority — 1% Limit and 45-Cent Limit Explained (Page 27)
A presentation slide titled 'Port's Taxing Authority' (slide 25, page 652) explains the Port of Seattle's two taxing limitations: the 1% limit, under which the maximum levy for 2025 is estimated at ~$117.9 million, and the 45-cent limit, under which the 2025 cap would translate to ~$385.8 million per $1,000 of assessed value, excluding G.O. bond debt service. -
 2024-10-22
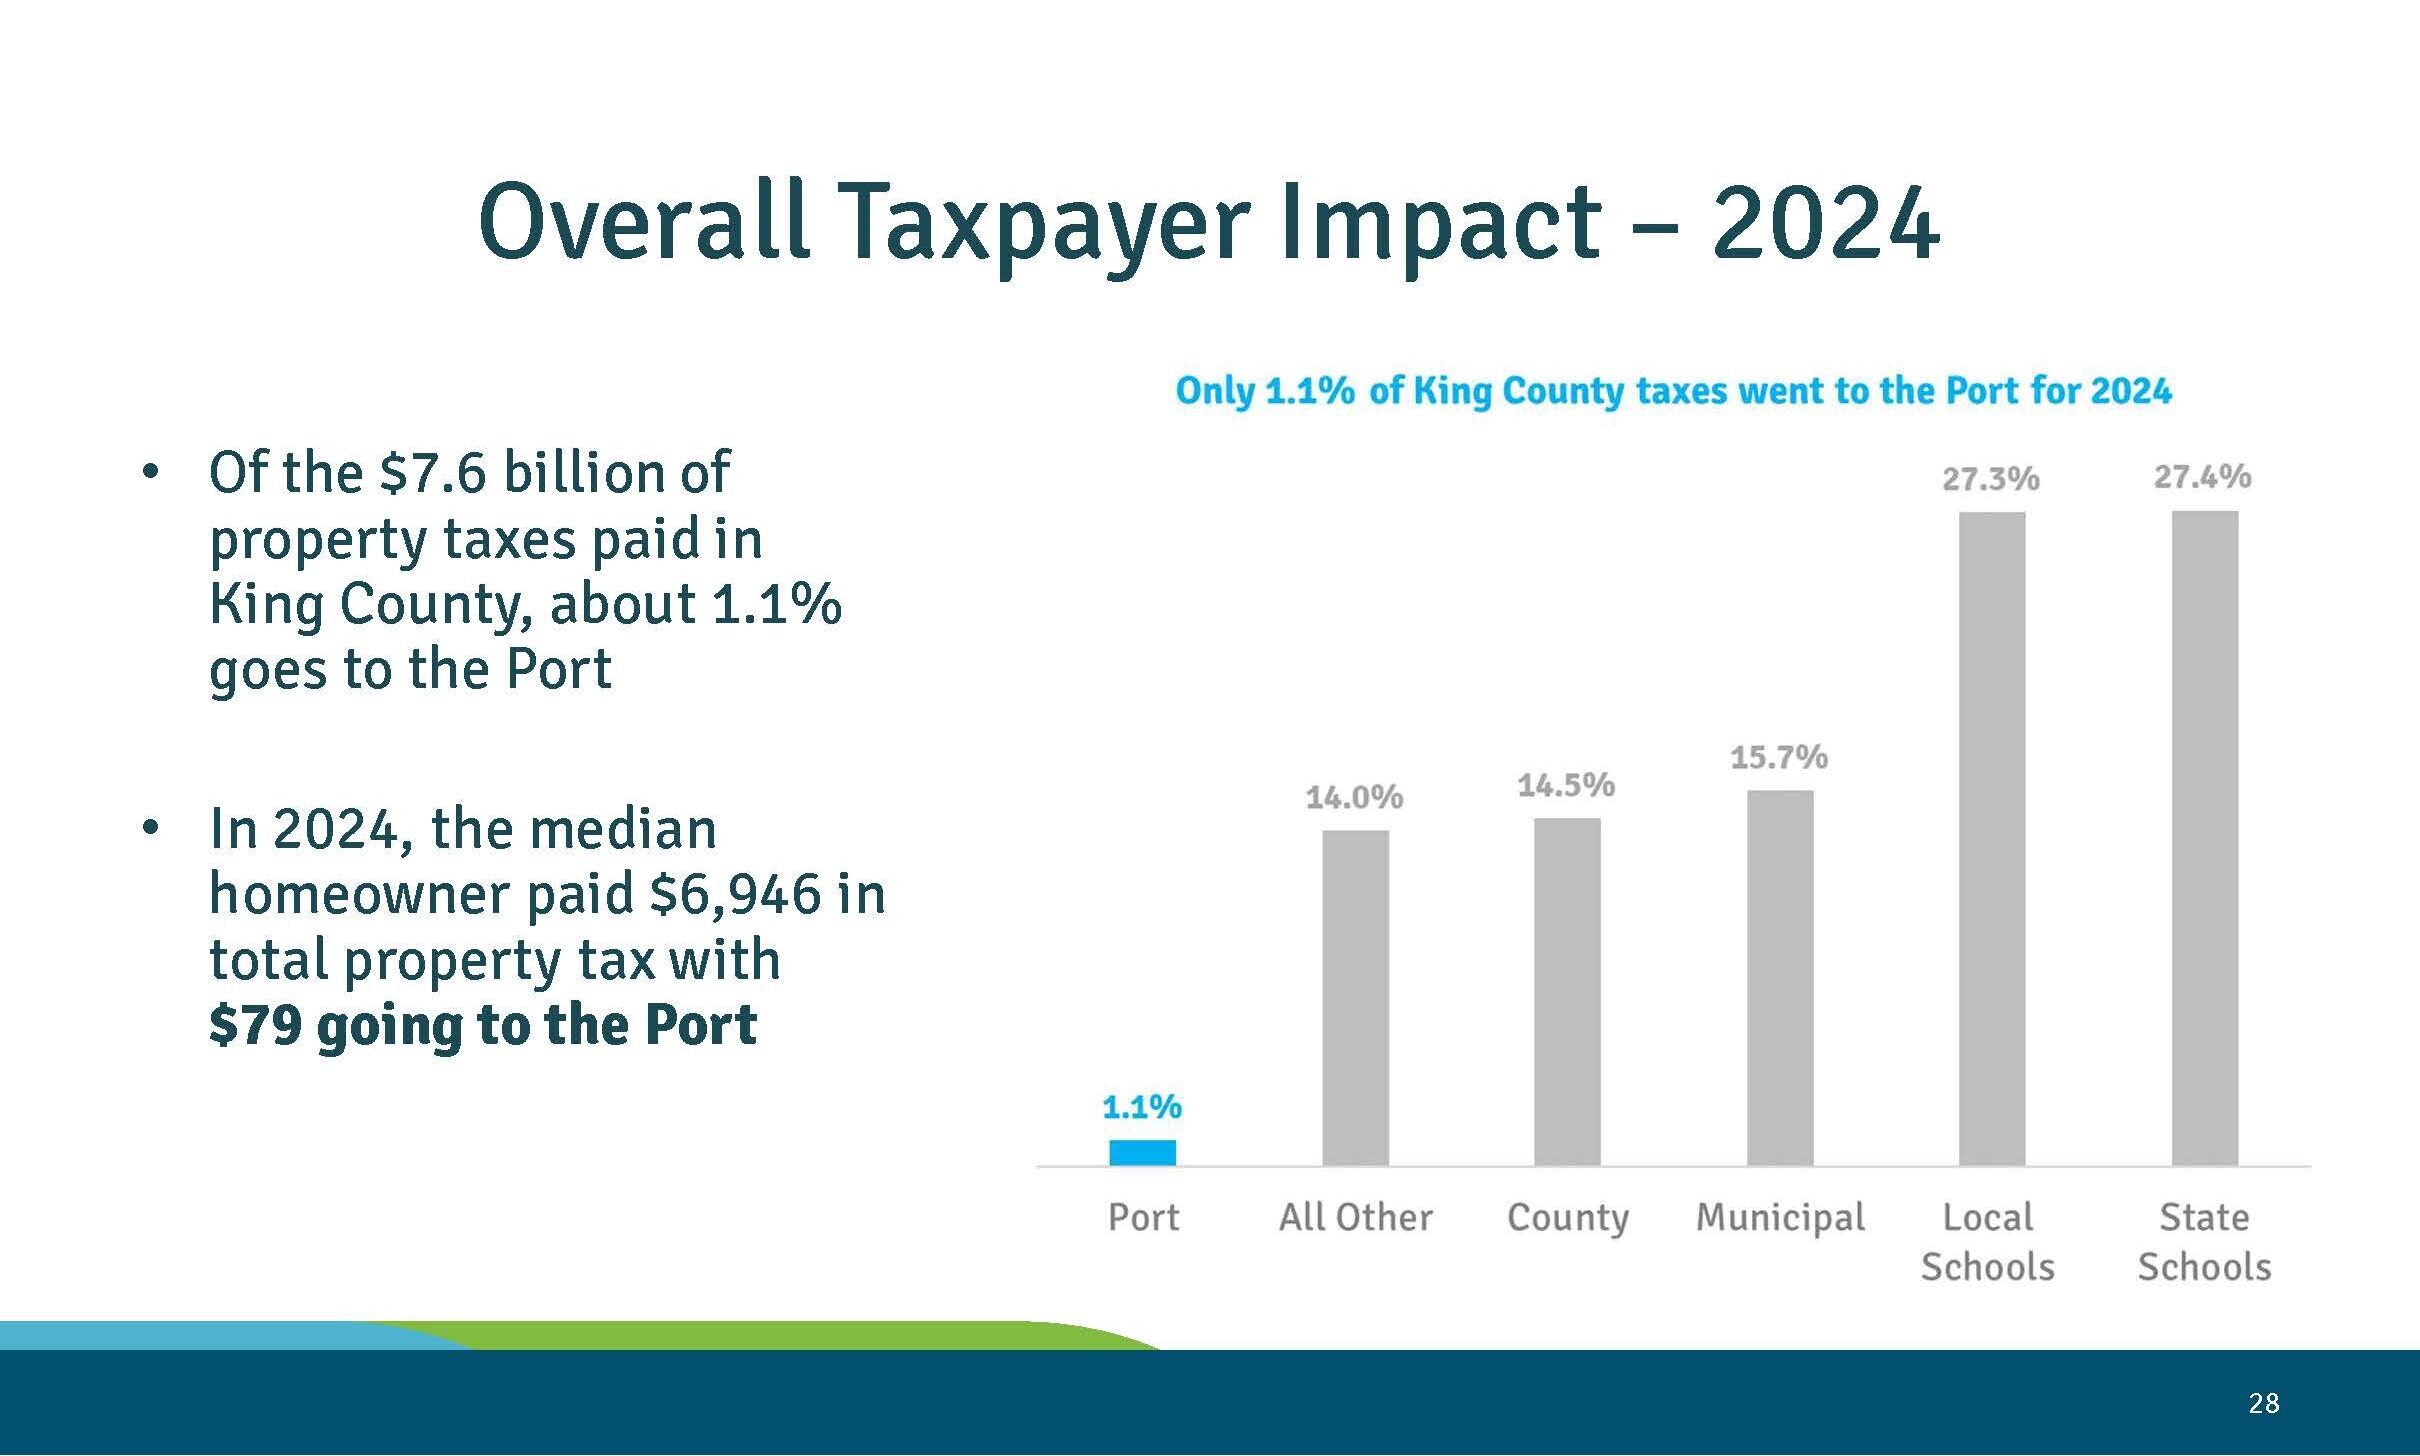
Port Of Seattle Share of King County Property Tax — 2025 Tax Levy Presentation (Page 30)
A presentation slide showing that only 1.1% of King County's $7.6 billion in 2024 property taxes went to the Port of Seattle, with the median homeowner paying $79 to the Port out of $6,946 total property tax. A bar chart compares the Port's 1.1% share against other taxing districts including State Schools (27.4%), Local Schools (27.3%), Municipal (15.7%), County (14.5%), and All Other (14.0%). -
 2024-10-22
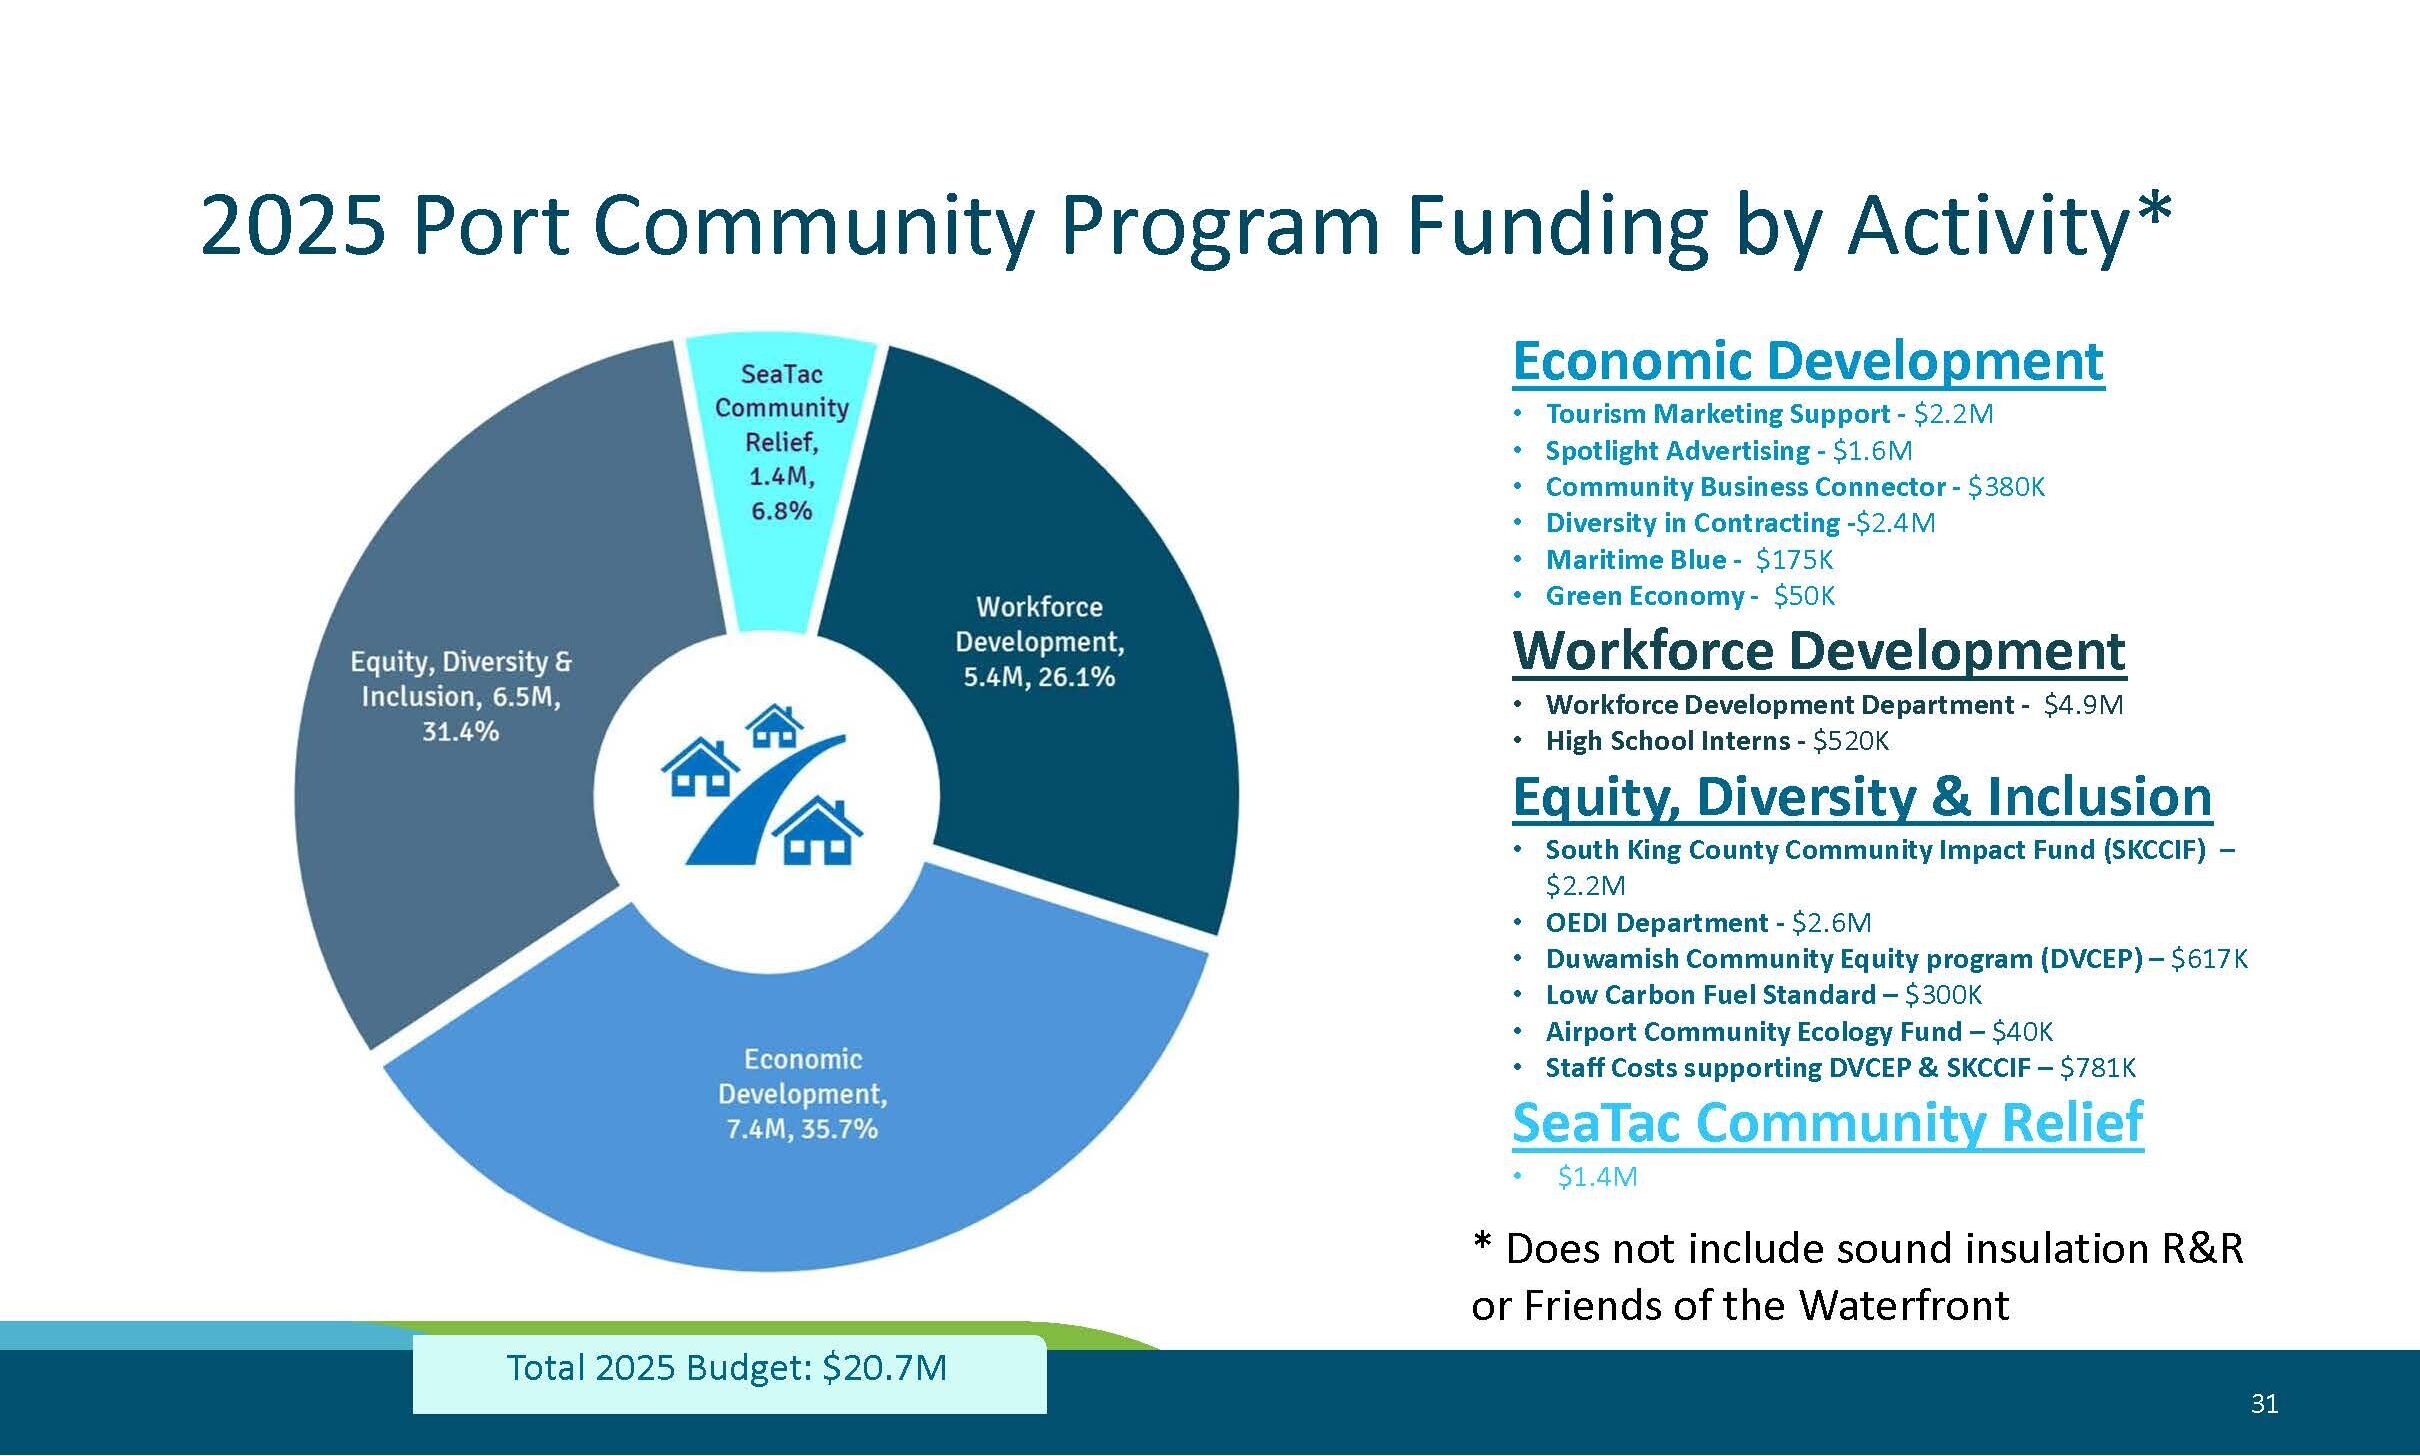
Port Of Seattle 2025 Community Program Budget Breakdown — $20.7M by Activity Area (Page 33)
A presentation slide showing the 2025 Port of Seattle Community Program budget of $20.7M broken down by four activity areas: Economic Development ($7.4M, 35.7%), Equity, Diversity & Inclusion ($6.5M, 31.4%), Workforce Development ($5.4M, 26.1%), and SeaTac Community Relief ($1.4M, 6.8%). The slide itemizes sub-programs including Tourism Marketing Support, Diversity in Contracting, South King County Community Impact Fund (SKCCIF), OEDI Department, and Duwamish Community Equity Program (DVCEP), among others. -
 2024-10-22
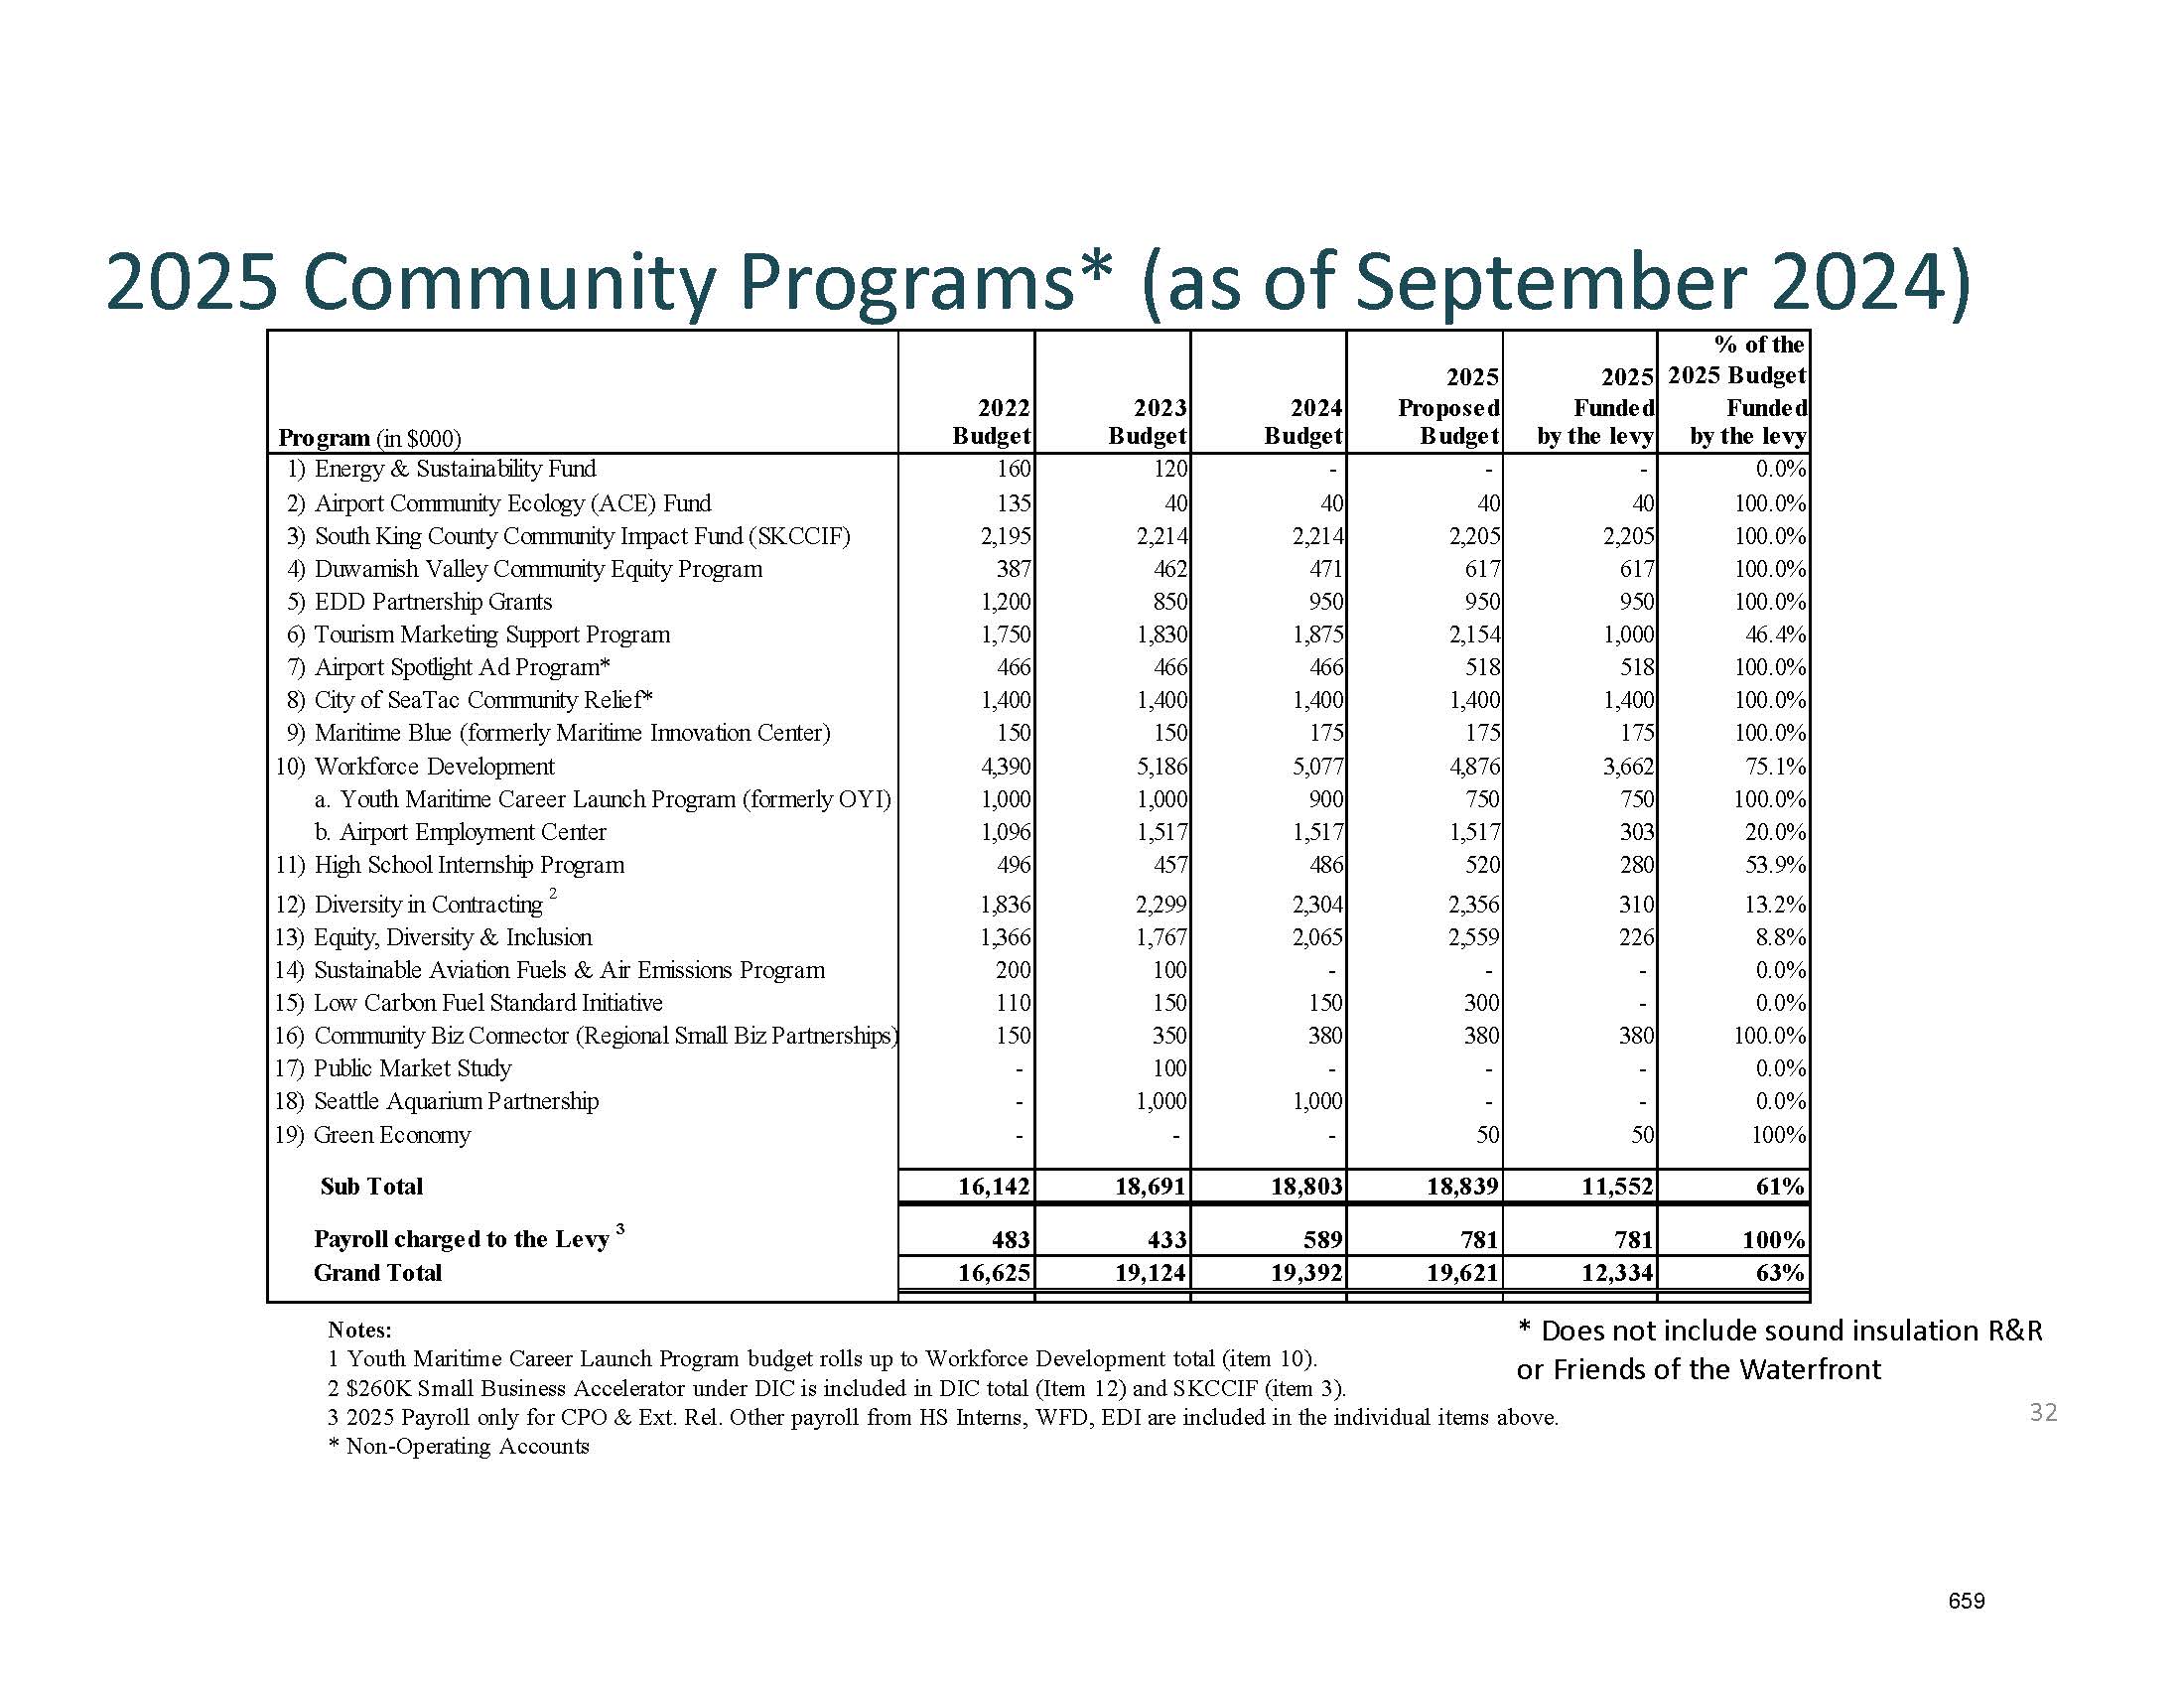
Port Of Seattle 2025 Community Programs Budget Table — Draft Plan of Finance Property Tax Levy (Page 34)
A budget table from the Port of Seattle presenting 2025 Community Programs funding as of September 2024, showing 19 line-item programs with budgets from 2022–2025. The Grand Total proposed 2025 budget is $19,621,000, with $12,334,000 (63%) funded by the levy; programs include the South King County Community Impact Fund, Duwamish Valley Community Equity Program, Workforce Development, and others related to Sea-Tac Airport operations. -
 2024-10-22
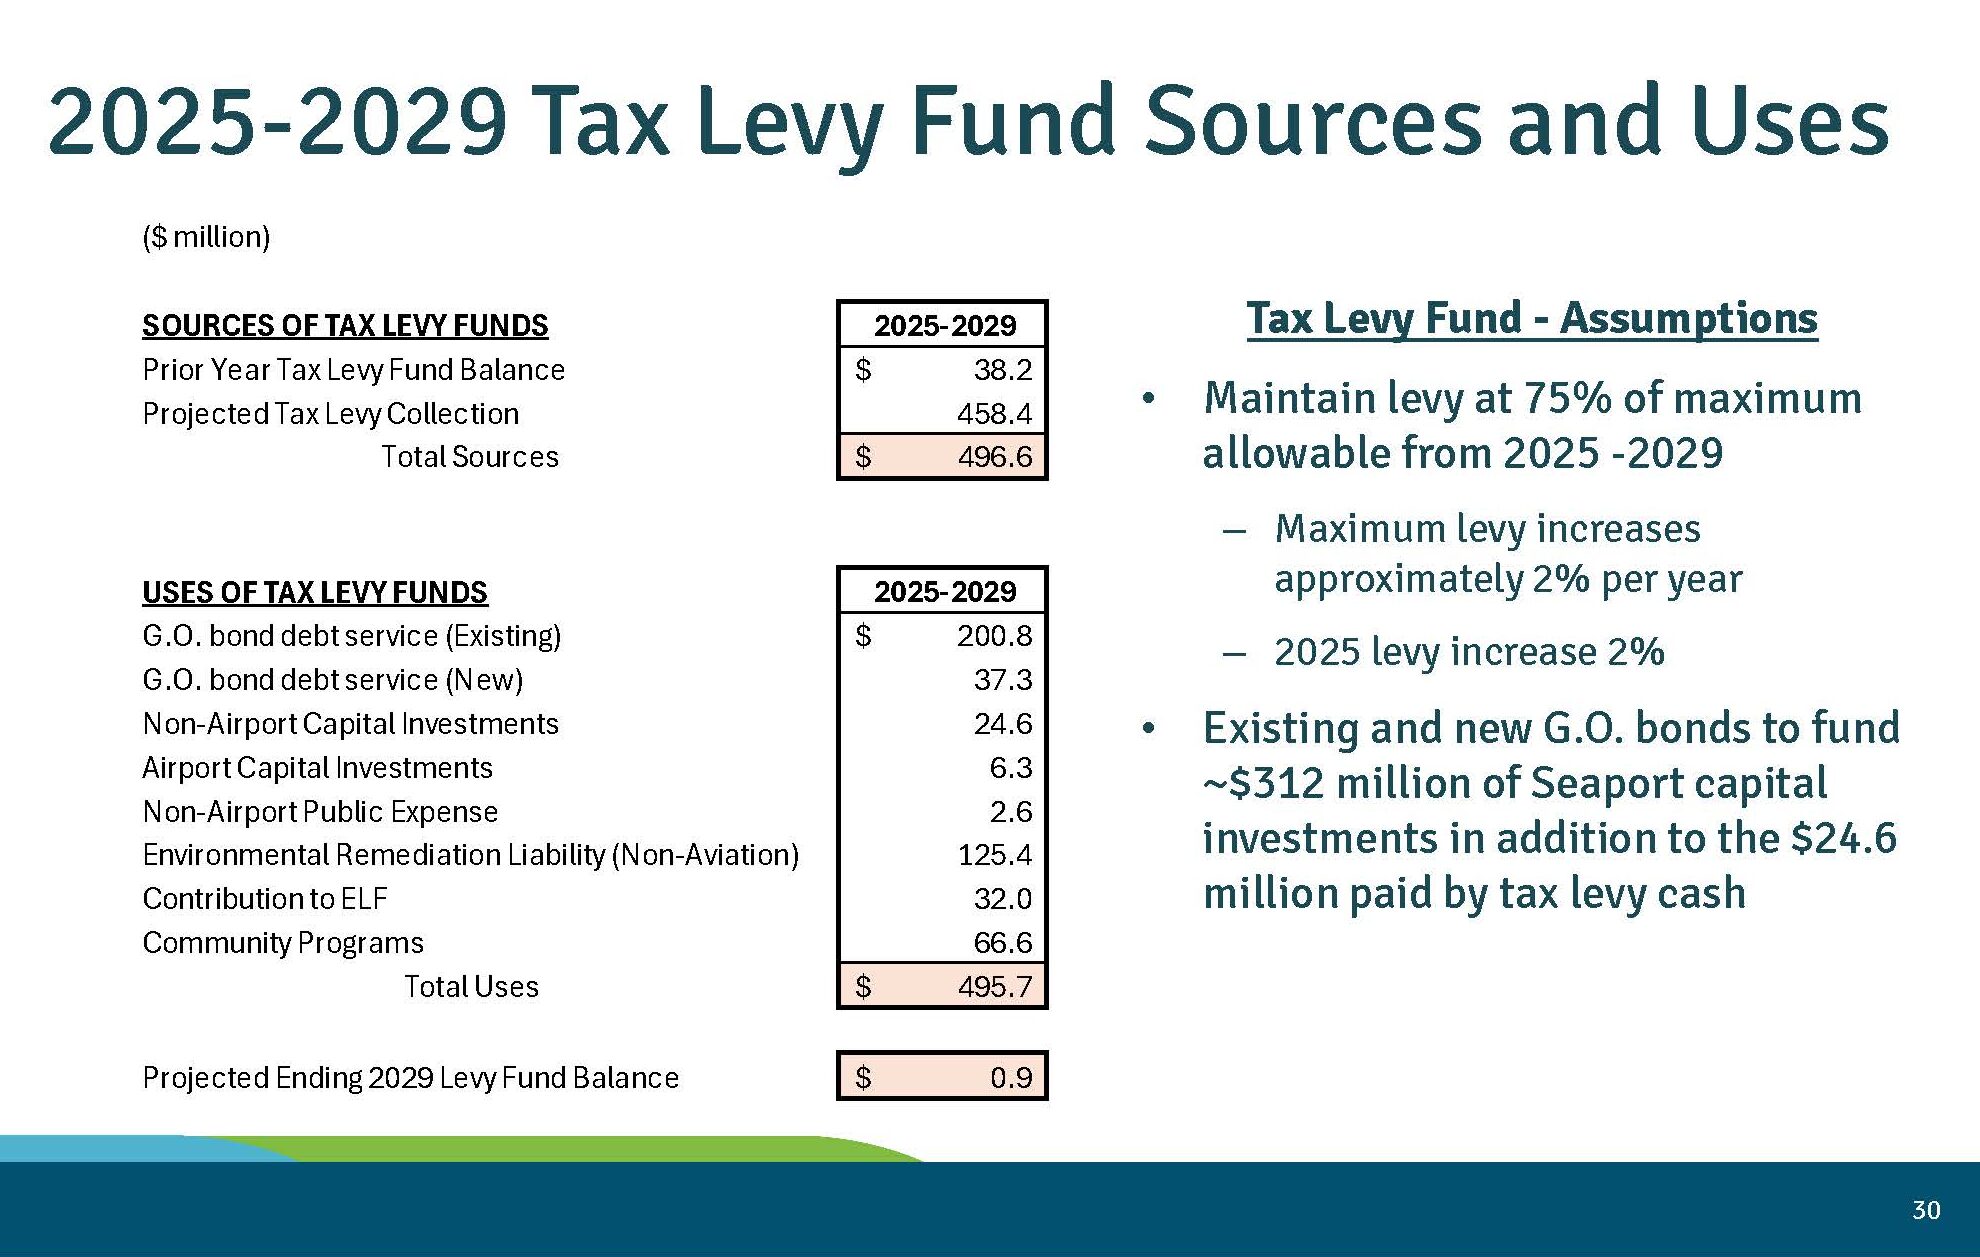
Port Of Seattle 2025–2029 Tax Levy Fund Sources and Uses Summary — Page 32
A budget presentation slide detailing the Port of Seattle's 2025-2029 Tax Levy Fund sources ($496.6 million total, including $38.2 million prior year balance and $458.4 million projected collection) and uses ($495.7 million total, including G.O. bond debt service, environmental remediation liability, and community programs), with a projected ending 2029 levy fund balance of $0.9 million. Key assumptions include maintaining the levy at 75% of maximum allowable and using existing and new G.O. bonds to fund approximately $312 million in Seaport capital investments. -
 2024-10-22
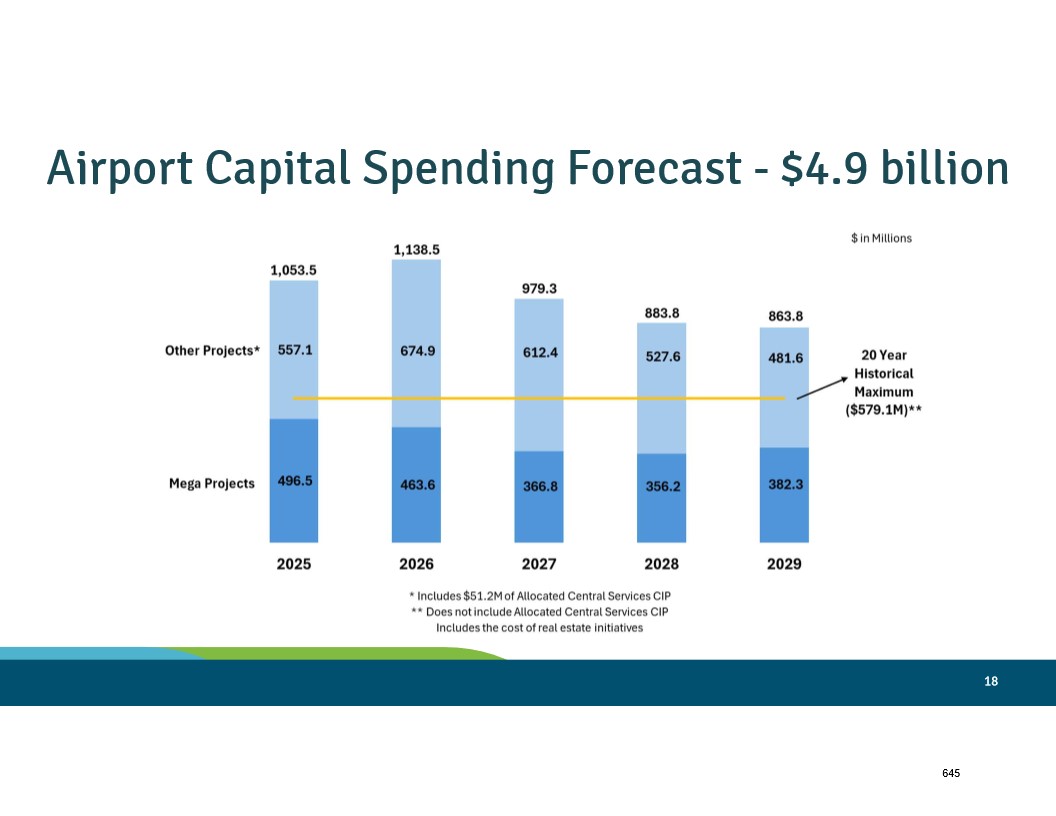
Sea-Tac Airport Capital Spending Projections 2025–2029 — Slide 20 (Draft Plan of Finance, October 2024)
A bar chart from a Sea-Tac Airport presentation (slide 18) projects $4.9 billion in airport capital spending from 2025 through 2029, broken down annually into Mega Projects and Other Projects. Annual totals range from $863.8M (2029) to $1,138.5M (2026), with a reference line marking the 20-year historical maximum of $579.1M. -
 2024-10-22
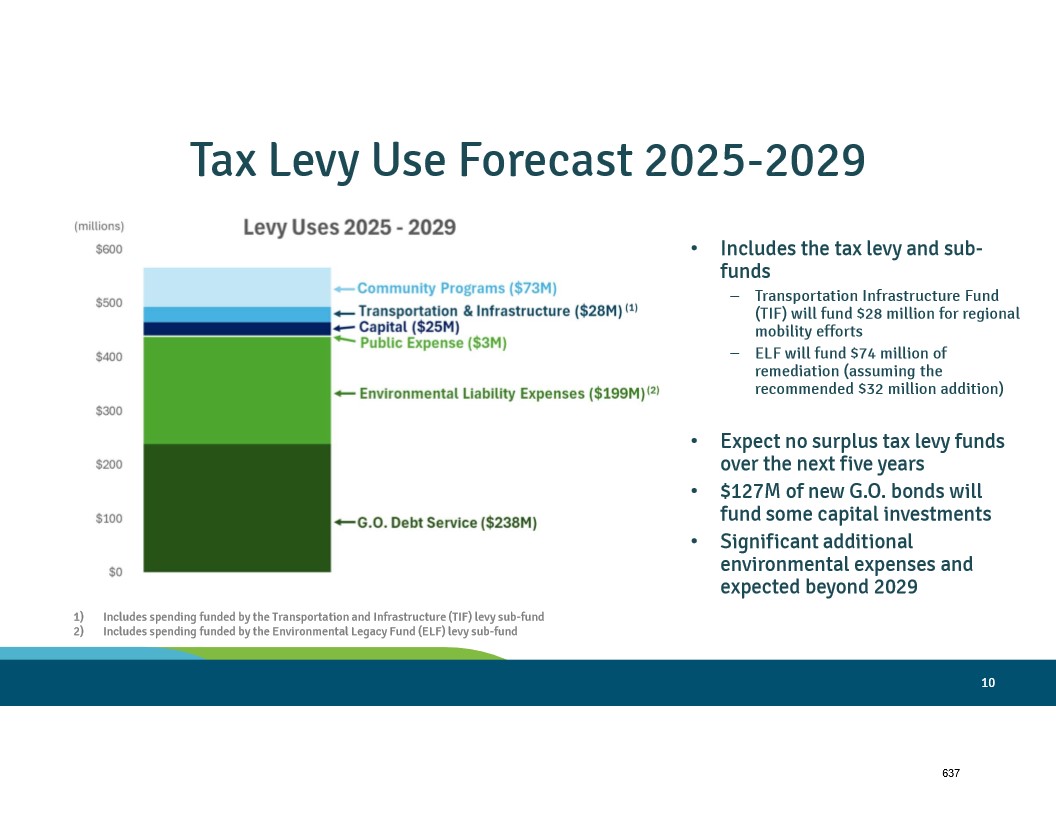
Tax Levy Use Forecast 2025–2029 — Slide 12 (Port Of Sea-Tac Draft Plan of Finance, October 2024)
A presentation slide titled 'Tax Levy Use Forecast 2025-2029' showing a stacked bar chart of levy uses totaling approximately $565M, broken down into G.O. Debt Service ($238M), Environmental Liability Expenses ($199M), Public Expense ($3M), Capital ($25M), Transportation & Infrastructure ($28M), and Community Programs ($73M). Key notes indicate no surplus tax levy funds are expected over five years, $127M in new G.O. bonds will fund capital investments, and significant additional environmental expenses are anticipated beyond 2029. -
 2024-10-22
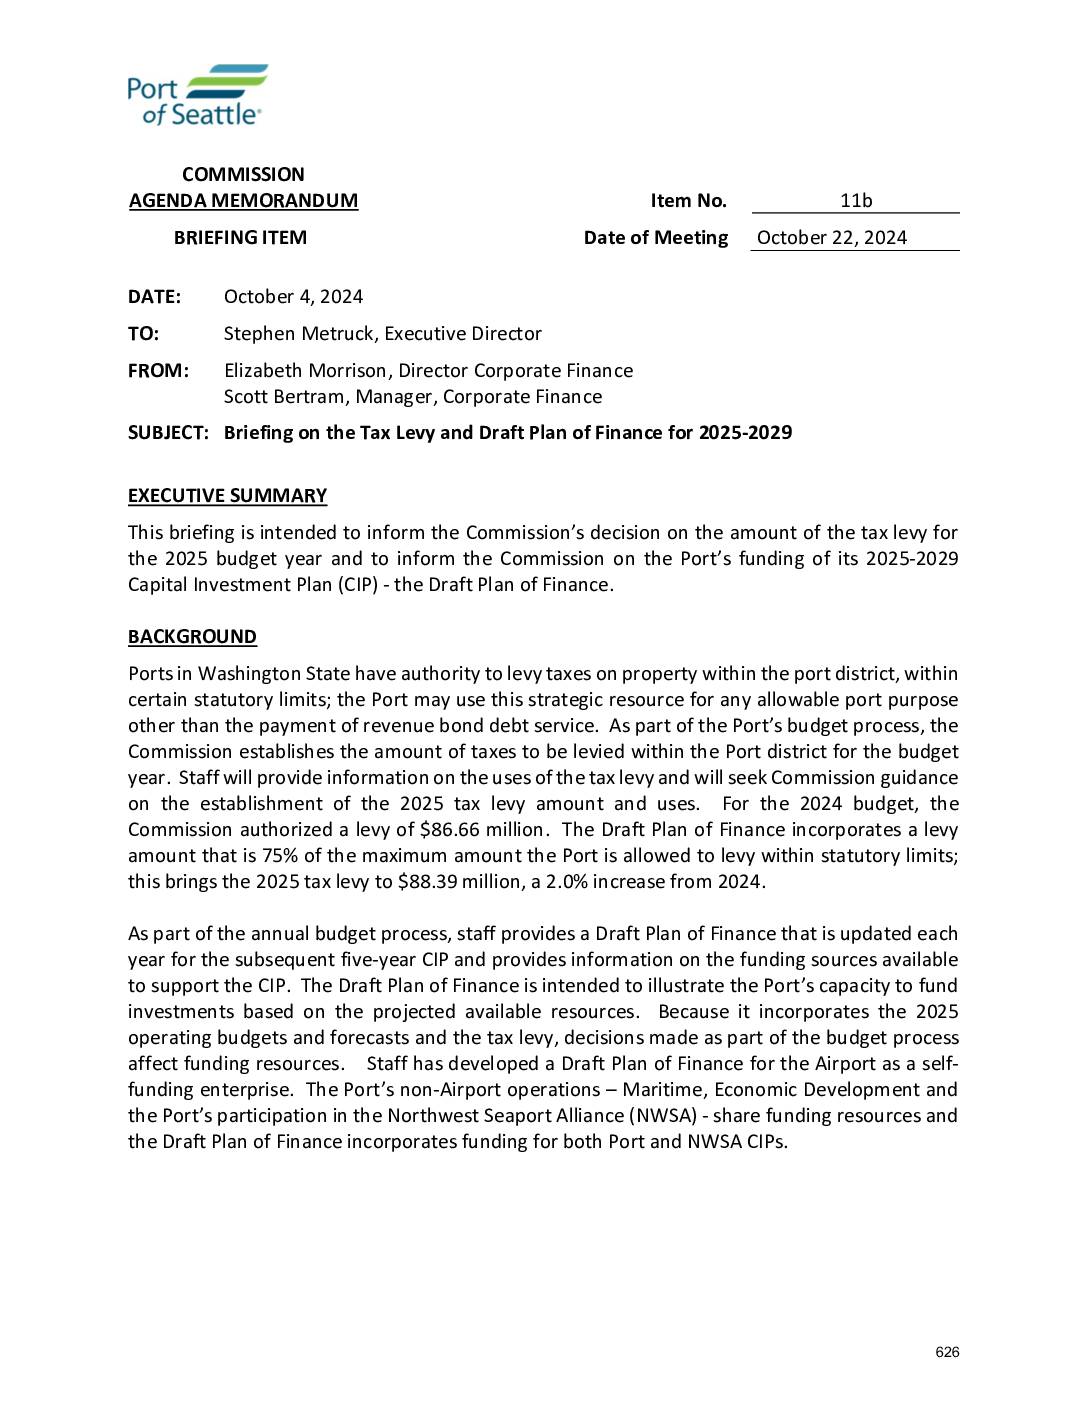
Draft Plan of Finance 2025-2029 and Tax Levy Briefing
The Port of Seattle Commission reviewed a briefing on its proposed 2025 tax levy and five-year financial plan for 2025–2029. The 2025 property tax levy is proposed at $88.39 million, a 2% increase over the 2024 levy of $86.66 million, set at 75% of the maximum allowed under Washington State law. The Draft Plan of Finance outlines how the Port will fund capital investments across its Airport, Maritime, and Economic Development divisions over the coming five years. -
 2024-04-04
King County Tax Assessor presentation: Hot Market Finally Cools: What’s Up on Property Values, Taxes & the Financial Landscape
King County Department of Assessments presentation by Assessor John Wilson on property values, taxes, and exemptions, delivered at a study session on April 4, 2024. Covers DOA functions including valuation of 720,000+ King County residential and commercial properties, physical inspection cycles (once every 6 years), trending 5/6th of properties to market values, residential and commercial -
 2024-04-04
King County Tax Assessor presentation: Hot Market Finally Cools: What’s Up on Property Values, Taxes & the Financial Landscape
King County Department of Assessments presentation by Assessor John Wilson on property values, taxes, and exemptions, delivered at a study session on April 4, 2024. Covers DOA functions including valuation of 720,000+ King County residential and commercial properties, physical inspection cycles (once every 6 years), trending 5/6th of properties to market values, residential and commercial