TagAir Quality Monitors(111)
-
 2025-10-01
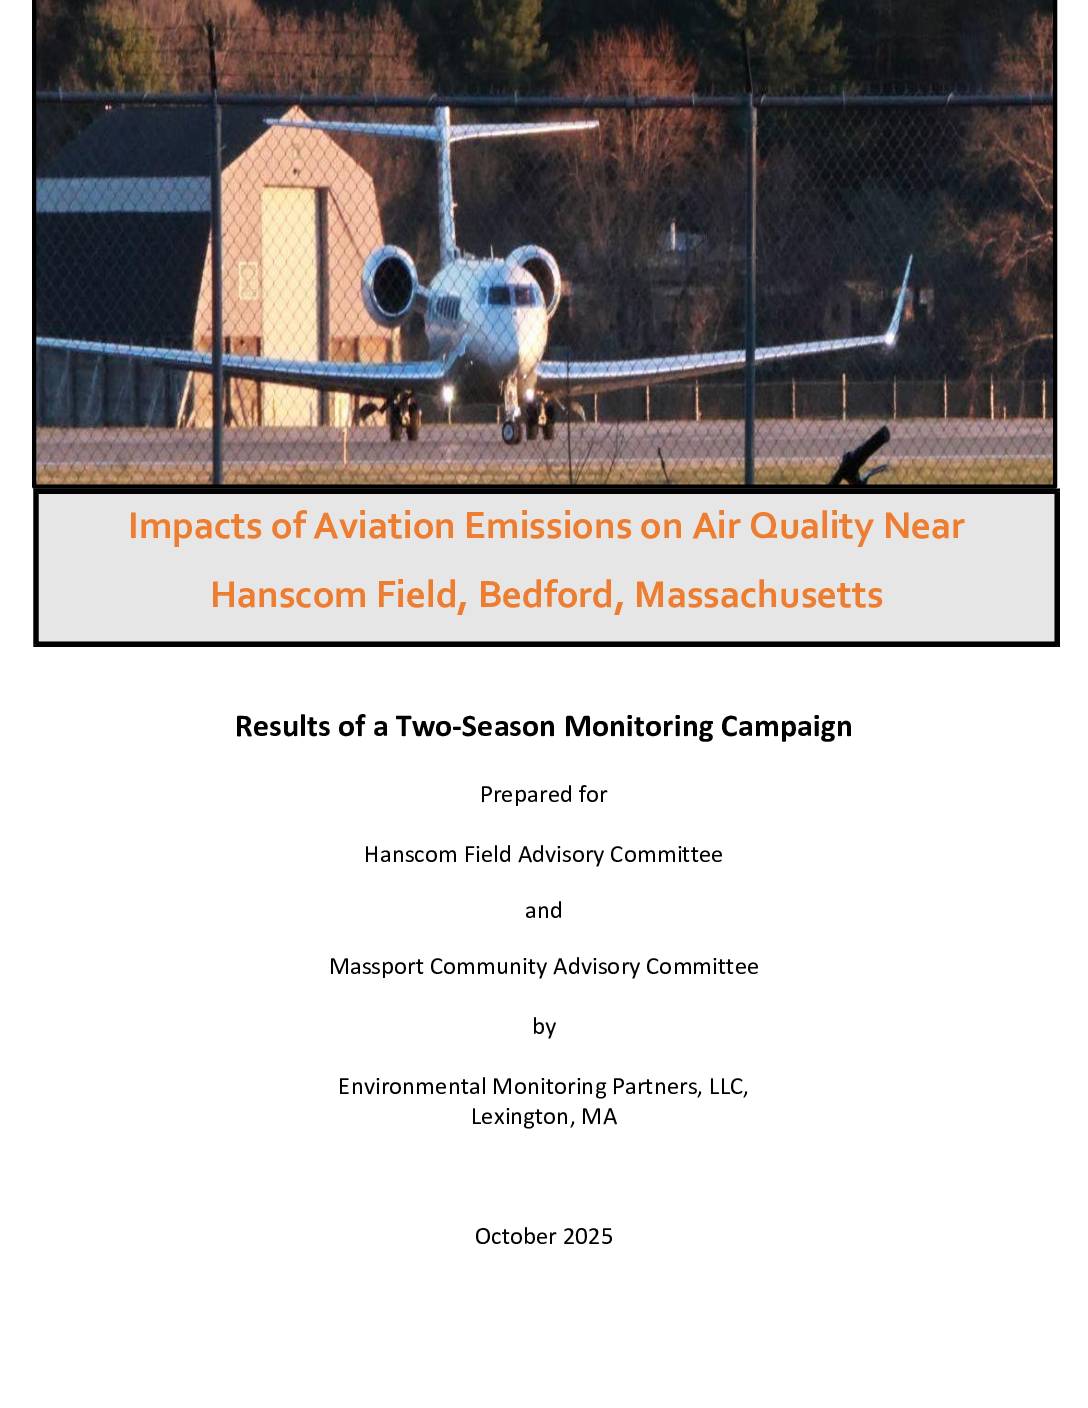
Impacts of Aviation Emissions on Air Quality Near Hanscom Field, Bedford, Massachusetts – Results of a Two-Season Monitoring Campaign
A comprehensive study measuring ultrafine particles, lead, and other air pollutants from aviation emissions at Hanscom Field across four surrounding Massachusetts towns. The study found that UFP concentrations were up to two-fold higher at downwind sites and often exceeded WHO guidelines, with the highest impacts in Bedford and Lexington. -
 2025-09-16
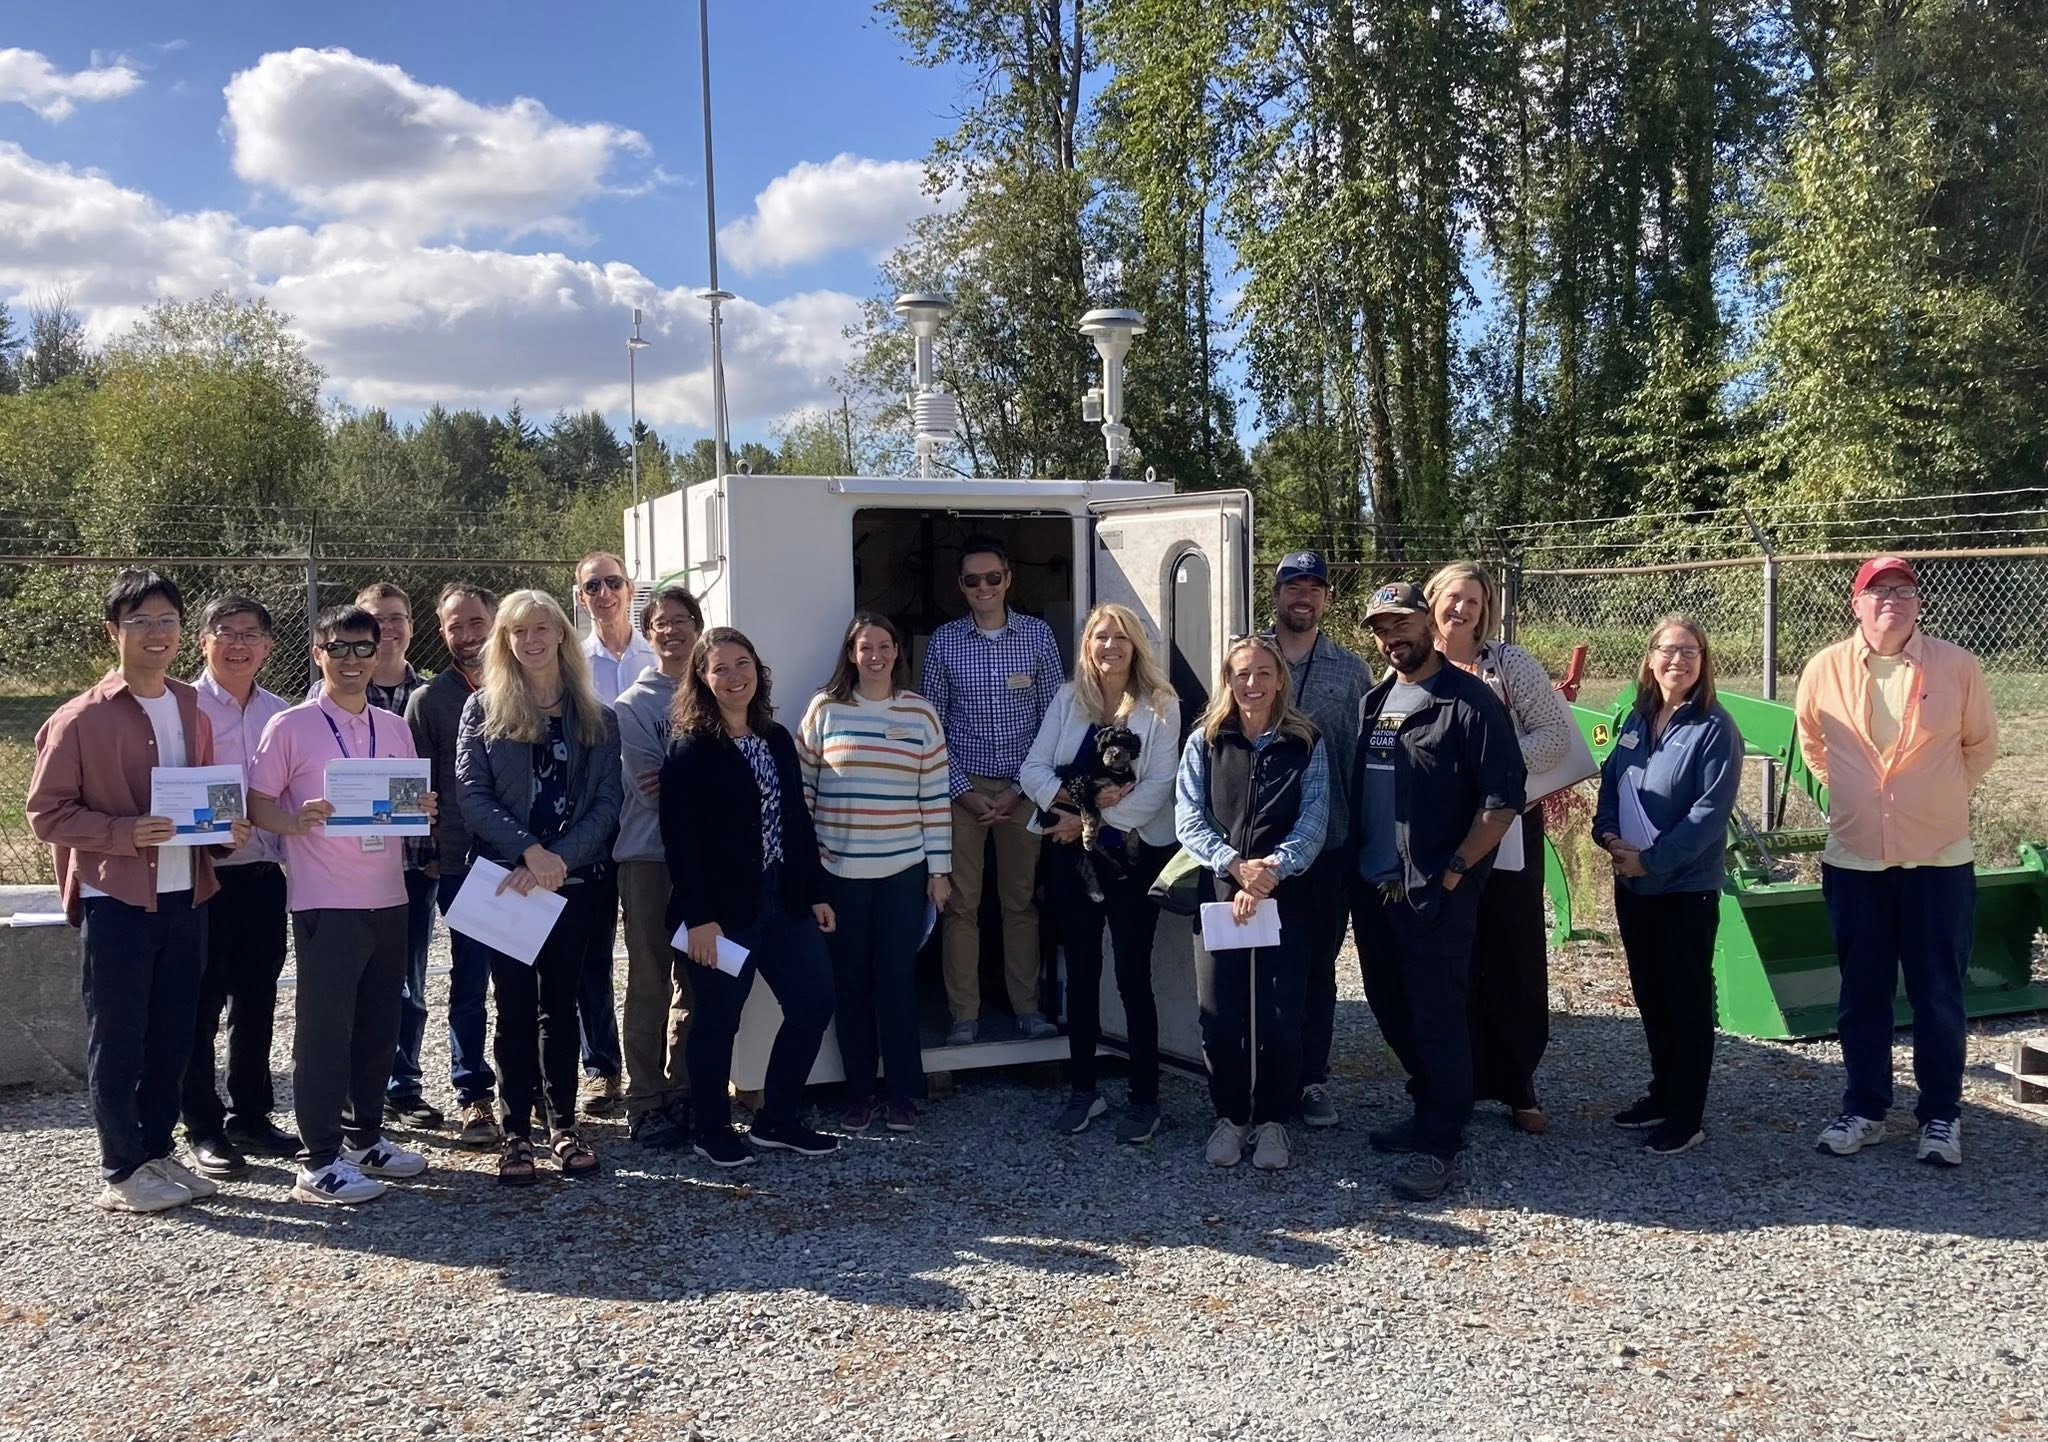
Air Quality Monitor Site Visit
Progress towards the first aviation air quality network in the nation SeaTac: State and local officials from Puget Sound Clean Air Agency (PSCAA) and Des Moines gathered today with researchers from University of Washington Department of Occupation and Environmental Health Sciences (UWDEOHS) at Sunset Park to learn about the latest PSCAA Air monitoring site, and -
2025-09-16
Air Quality Monitoring Equipment Training Group Photo
A group of approximately 18 people pose in front of a white environmental monitoring enclosure equipped with air sampling instruments and an antenna mast. The setting appears to be a fenced outdoor monitoring site with gravel ground cover, trees in the background, and a green piece of equipment visible at right; several participants are holding papers or documents. -
 2025-09-15
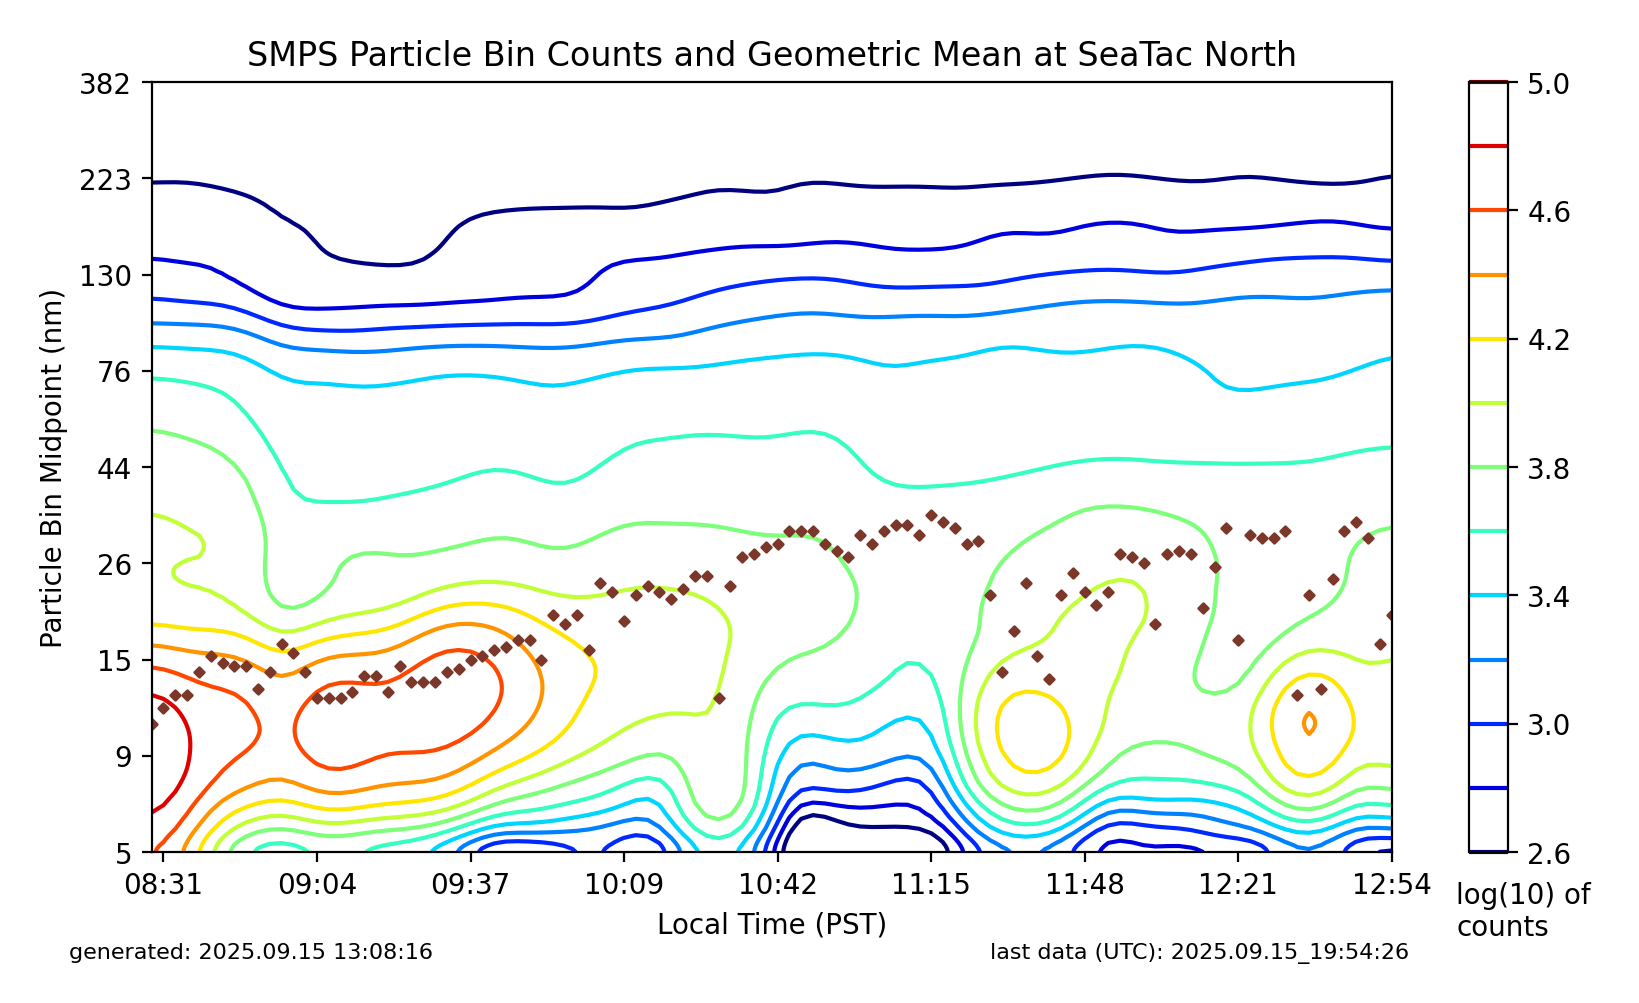
SMPS Particle Bin Counts and Geometric Mean at SeaTac North
This contour plot displays Scanning Mobility Particle Sizer (SMPS) particle bin counts (log10 scale, 2.6–5.0) by particle size (5–382 nm) and local PST time (08:31–12:54) at the SeaTac North monitoring station on September 15, 2025. Brown diamond markers indicate the geometric mean particle diameter over time, generally ranging between approximately 15–30 nm. The chart was generated at 13:08:16 local time on 2025-09-15, with last UTC data at 19:54:26. -
 2025-09-15
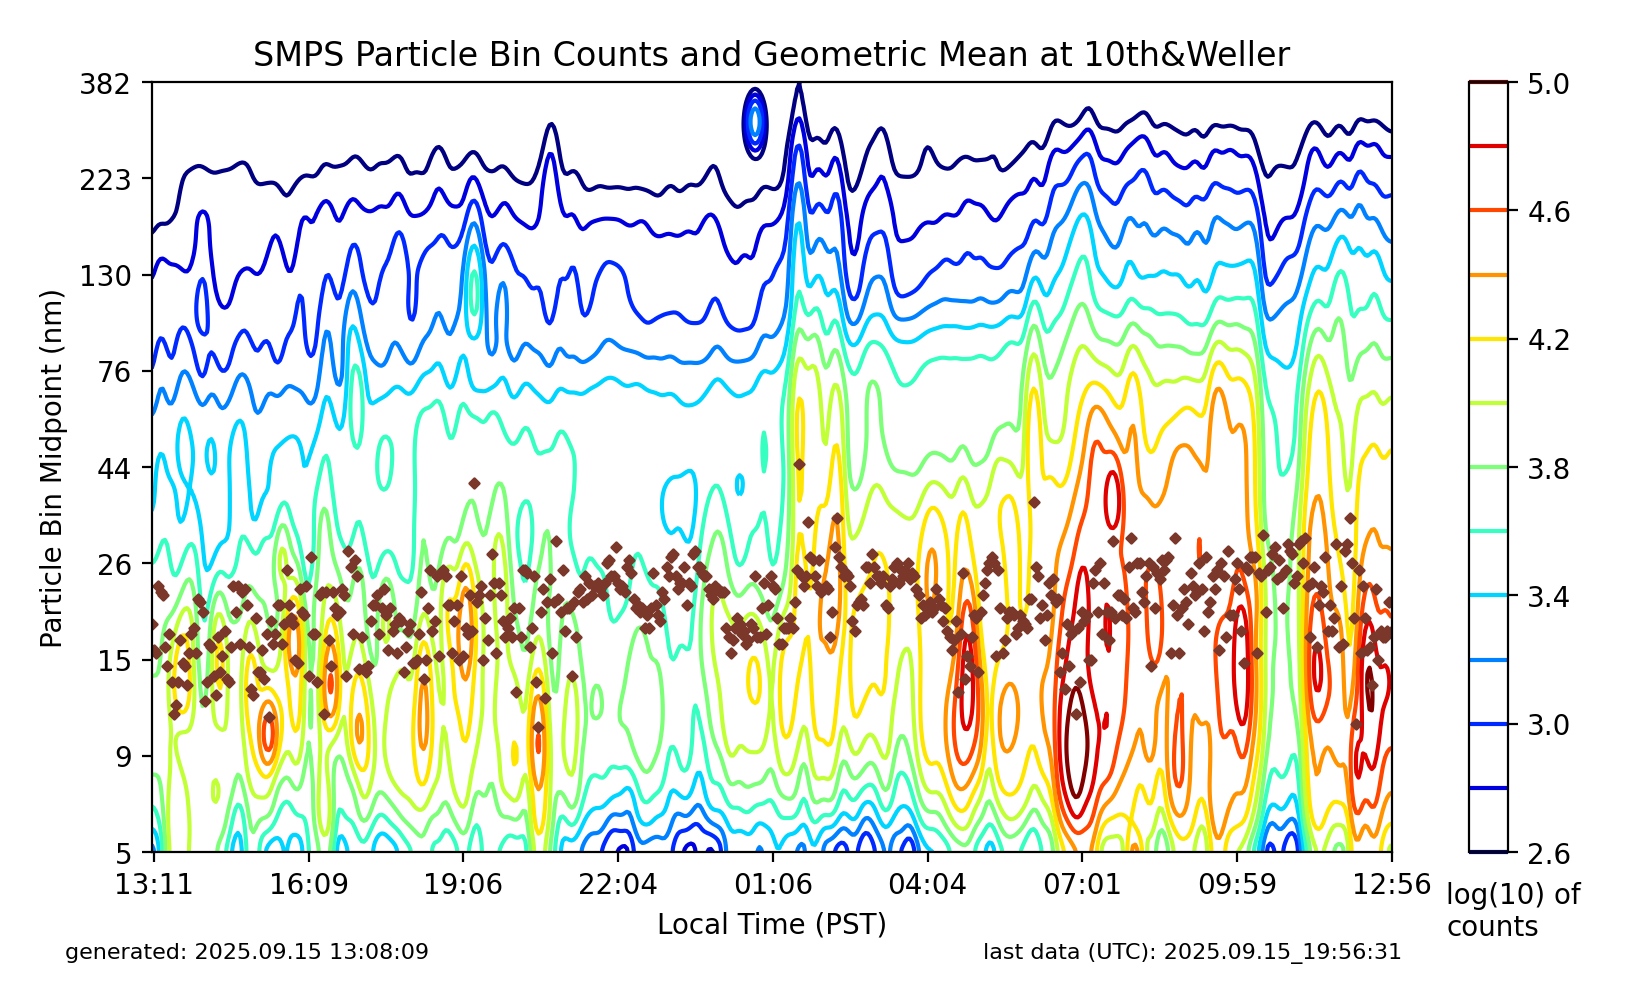
SMPS Particle Bin Counts and Geometric Mean at 10th&Weller
This plot shows Scanning Mobility Particle Sizer (SMPS) aerosol particle size distribution data (5–382 nm) collected at the 10th & Weller monitoring site, generated on 2025-09-15 at 13:08:09 PST with last UTC data timestamp of 2025-09-15 19:56:31. The contour plot displays log(10) particle counts over local PST time from approximately 13:11 on September 14 through 12:56 on September 15, with brown diamond markers indicating the geometric mean particle diameter over time. -
 2025-09-15
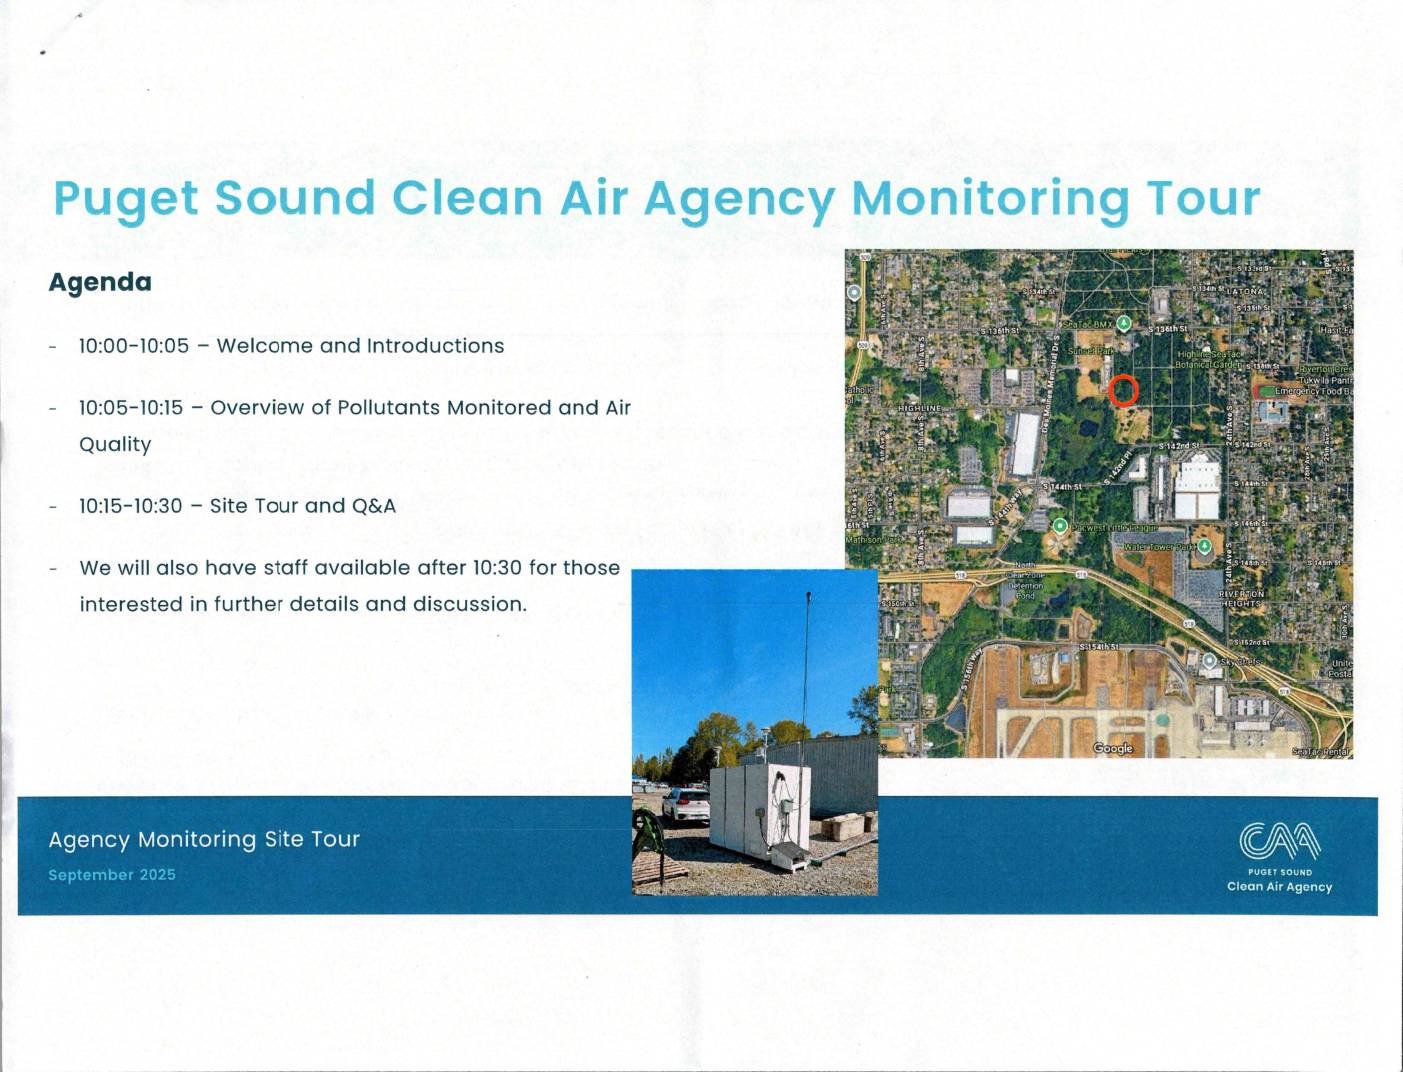
Puget Sound Clean Air Agency Monitoring Site Tour: Agenda and Overview
This document presents materials from a Puget Sound Clean Air Agency Monitoring Site Tour held in September 2025, covering the agency's mission to protect air quality across King, Pierce, Snohomish, and Kitsap counties. It outlines key programs including climate action planning, wood stove replacement, and diesel emissions reduction, with a focus on fine particulate matter (PM2.5), which accounts for 90% of cardiac and respiratory health risk from air pollution in the region. Note: this document relates to regional air quality monitoring and does not contain information about Sea-Tac Airport noise policy. -
 2025-06-01
2025 Ambient Air Monitoring Network Plan
This 2025 Ambient Air Monitoring Network Plan, published by the Washington State Department of Ecology's Air Quality Program, outlines the state's ambient air quality monitoring network across Washington. Authored by Jill Schulte and released in June 2025, it provides regional office contact information and details the counties served by each of Ecology's four regional offices. Note: this document covers air quality monitoring statewide and does not contain content specifically related to Sea-Tac Airport noise policy. -
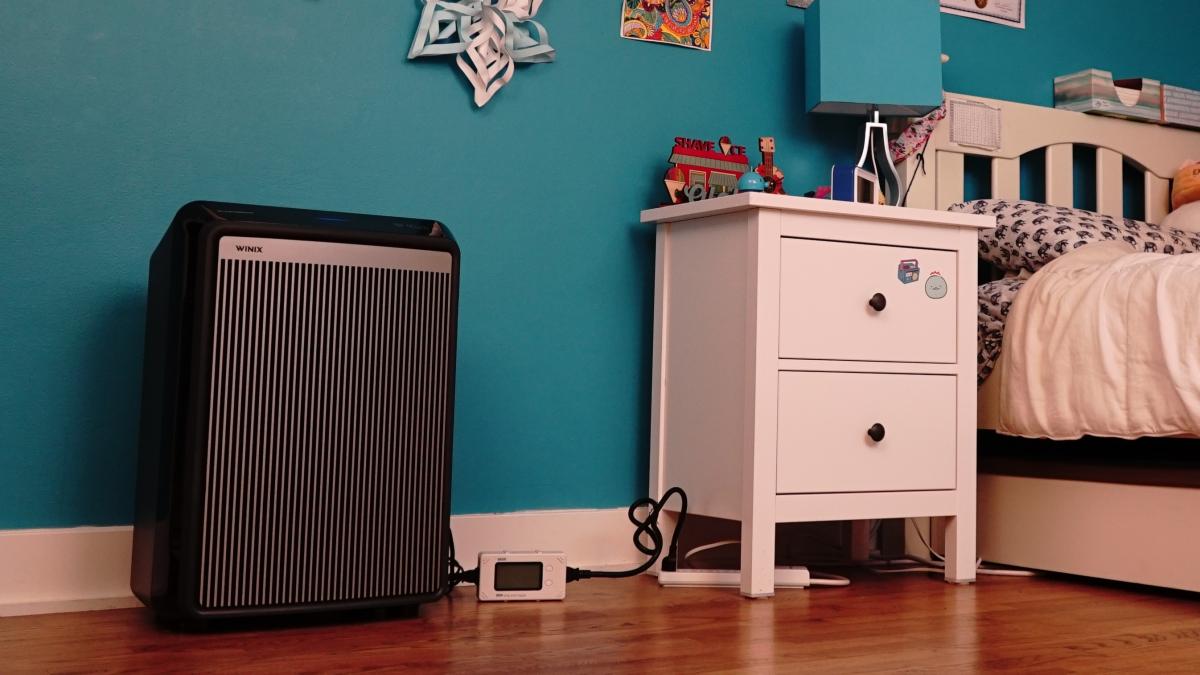
UWDEOHS air purifier in child’s bedroom
A Winix-brand air purifier (logo visible on unit) sits on a hardwood floor against a teal wall in a child's bedroom, connected to a small air quality monitor device. The room contains a white nightstand and bed with patterned bedding. -
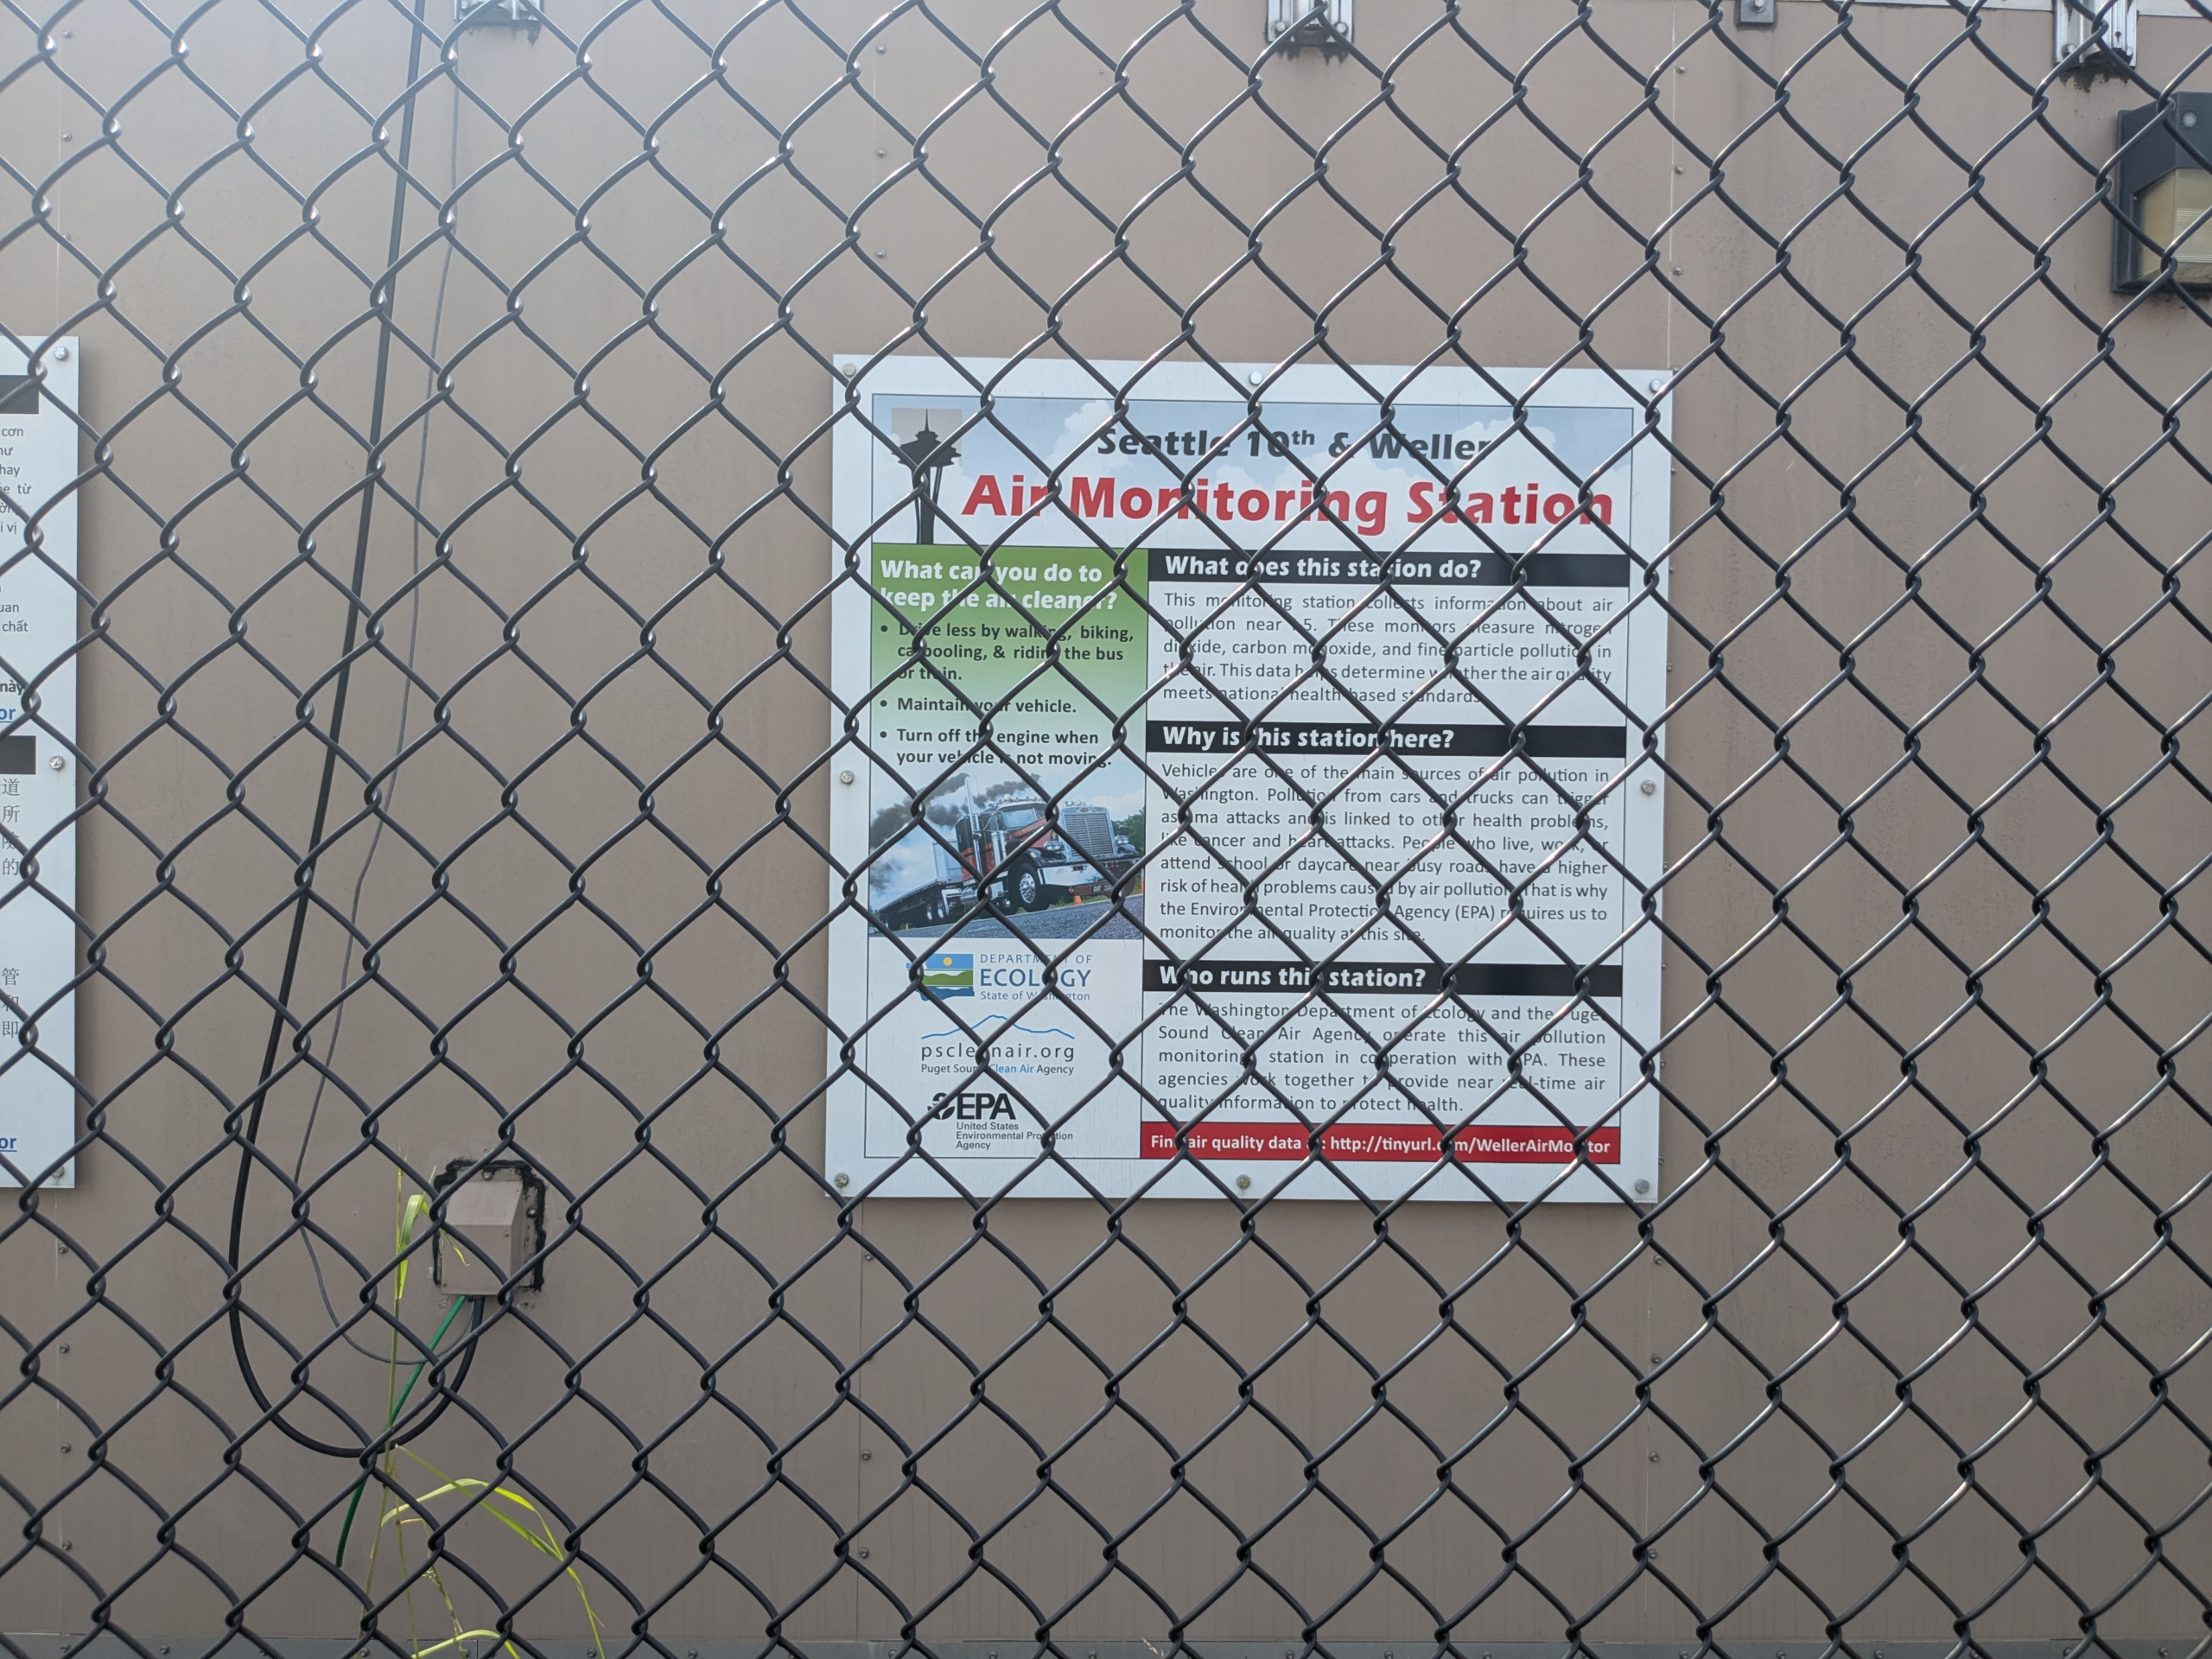
PSCAA 10th and Weller Air Quality Monitoring Site — May 6, 2025, 22:02:51
A sign mounted on a chain-link fence identifies this as the Seattle 19th & Weller Air Monitoring Station, operated by the Washington Department of Ecology and the Puget Sound Clean Air Agency in cooperation with the EPA. The sign explains that the station monitors nitrogen dioxide, carbon monoxide, and fine particle pollution near vehicle traffic, with data accessible at http://tinyurl.com/WellerAirMonitor. -