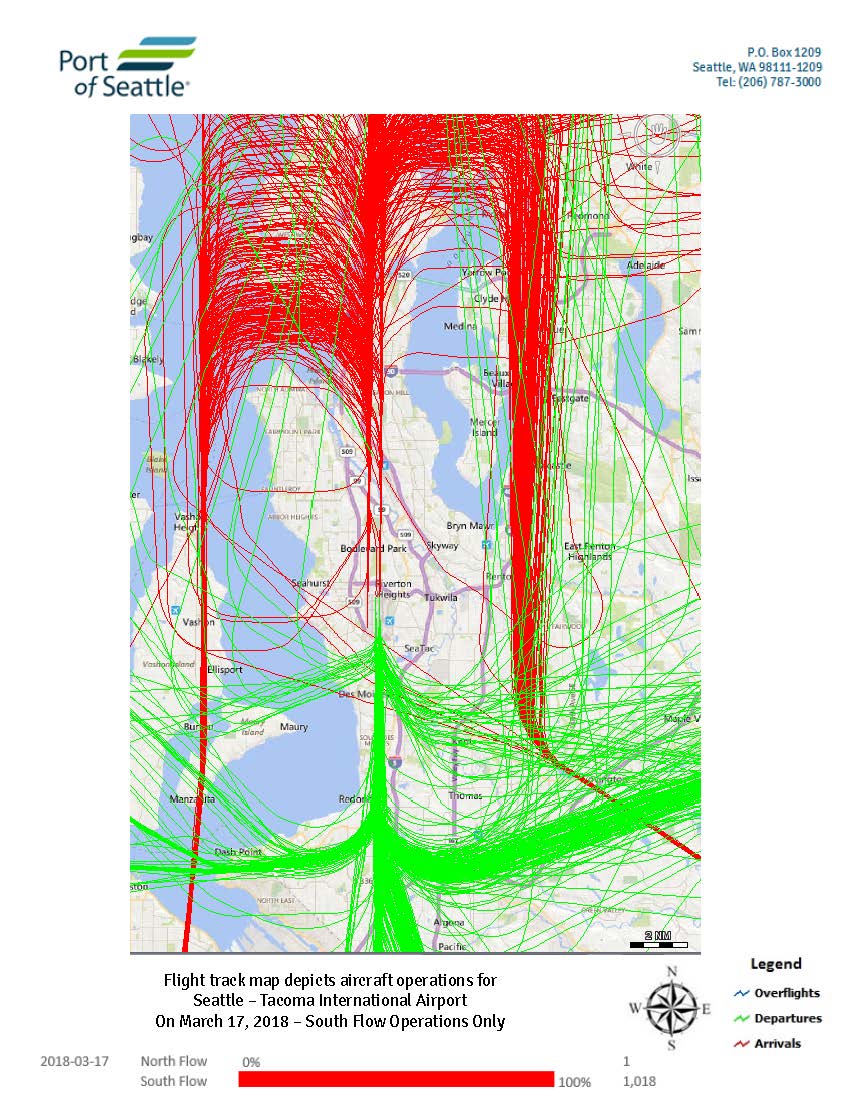
This Port of Seattle flight track map depicts all aircraft operations at Seattle-Tacoma International Airport on March 17, 2018, during 100% South Flow conditions, totaling 1,018 operations. Green lines represent departures, red lines represent arrivals, and blue lines represent overflights, with flight paths concentrated over the Puget Sound region and surrounding communities.Open full document
Notes
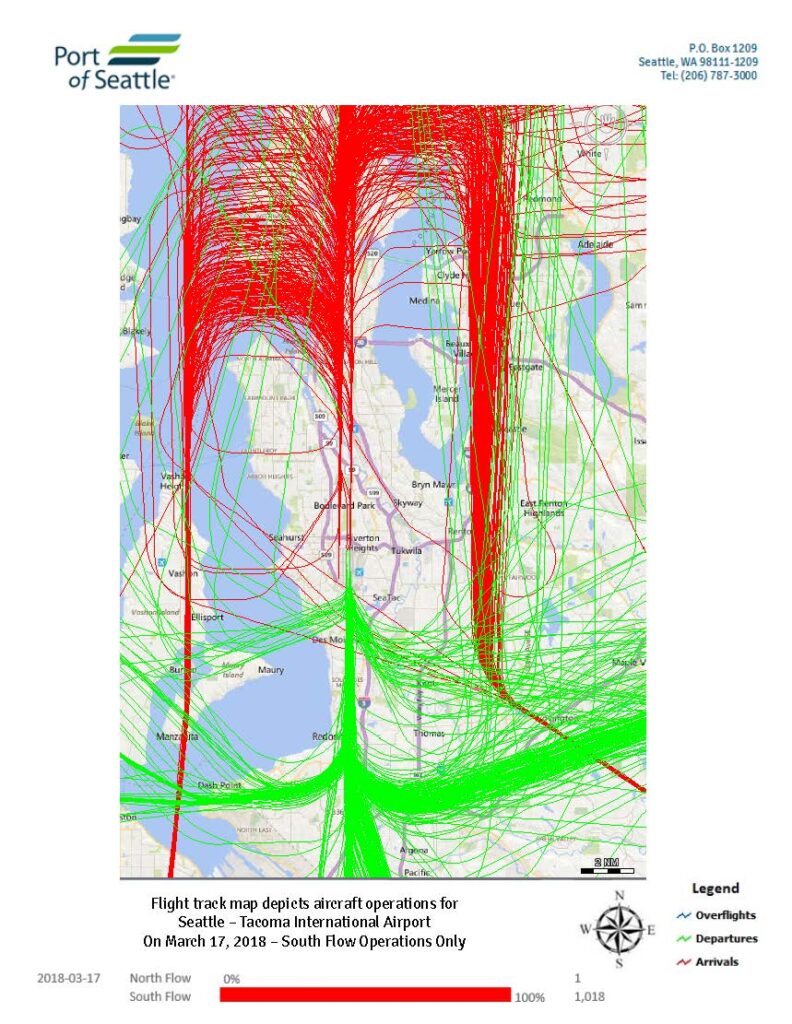
This Port of Seattle flight track map depicts all aircraft operations at Seattle-Tacoma International Airport on March 17, 2018, during 100% South Flow conditions, totaling 1,018 operations. Green lines represent departures, red lines represent arrivals, and blue lines represent overflights, with flight paths concentrated over the Puget Sound region and surrounding communities.