TagProperty Tax Levy(83)
-
Draft Finance Plan 201-2023-2018_11_13_SM_7c_supp_Page_02
A presentation slide titled 'Topics' lists four agenda items: Draft Plan of Finance, Capital Planning and Funding: Airport, Capital Planning and Funding: Non-Airport, and Tax Levy Background and 2018 Update. The slide is numbered page 2 and uses a teal and green color scheme consistent with a port or airport authority organization. -
Draft Finance Plan 201-2023-2018_11_13_SM_7c_supp_Page_01
Title slide for Port of Seattle agenda Item No. 7c, presented at the November 13, 2018 commission meeting. The document covers the Draft Plan of Finance for 2019-2023 and a Tax Levy Briefing, and bears the Port of Seattle logo. -
Draft Finance Plan 201-2023-2018_11_13_SM_7c_supp_Page_04
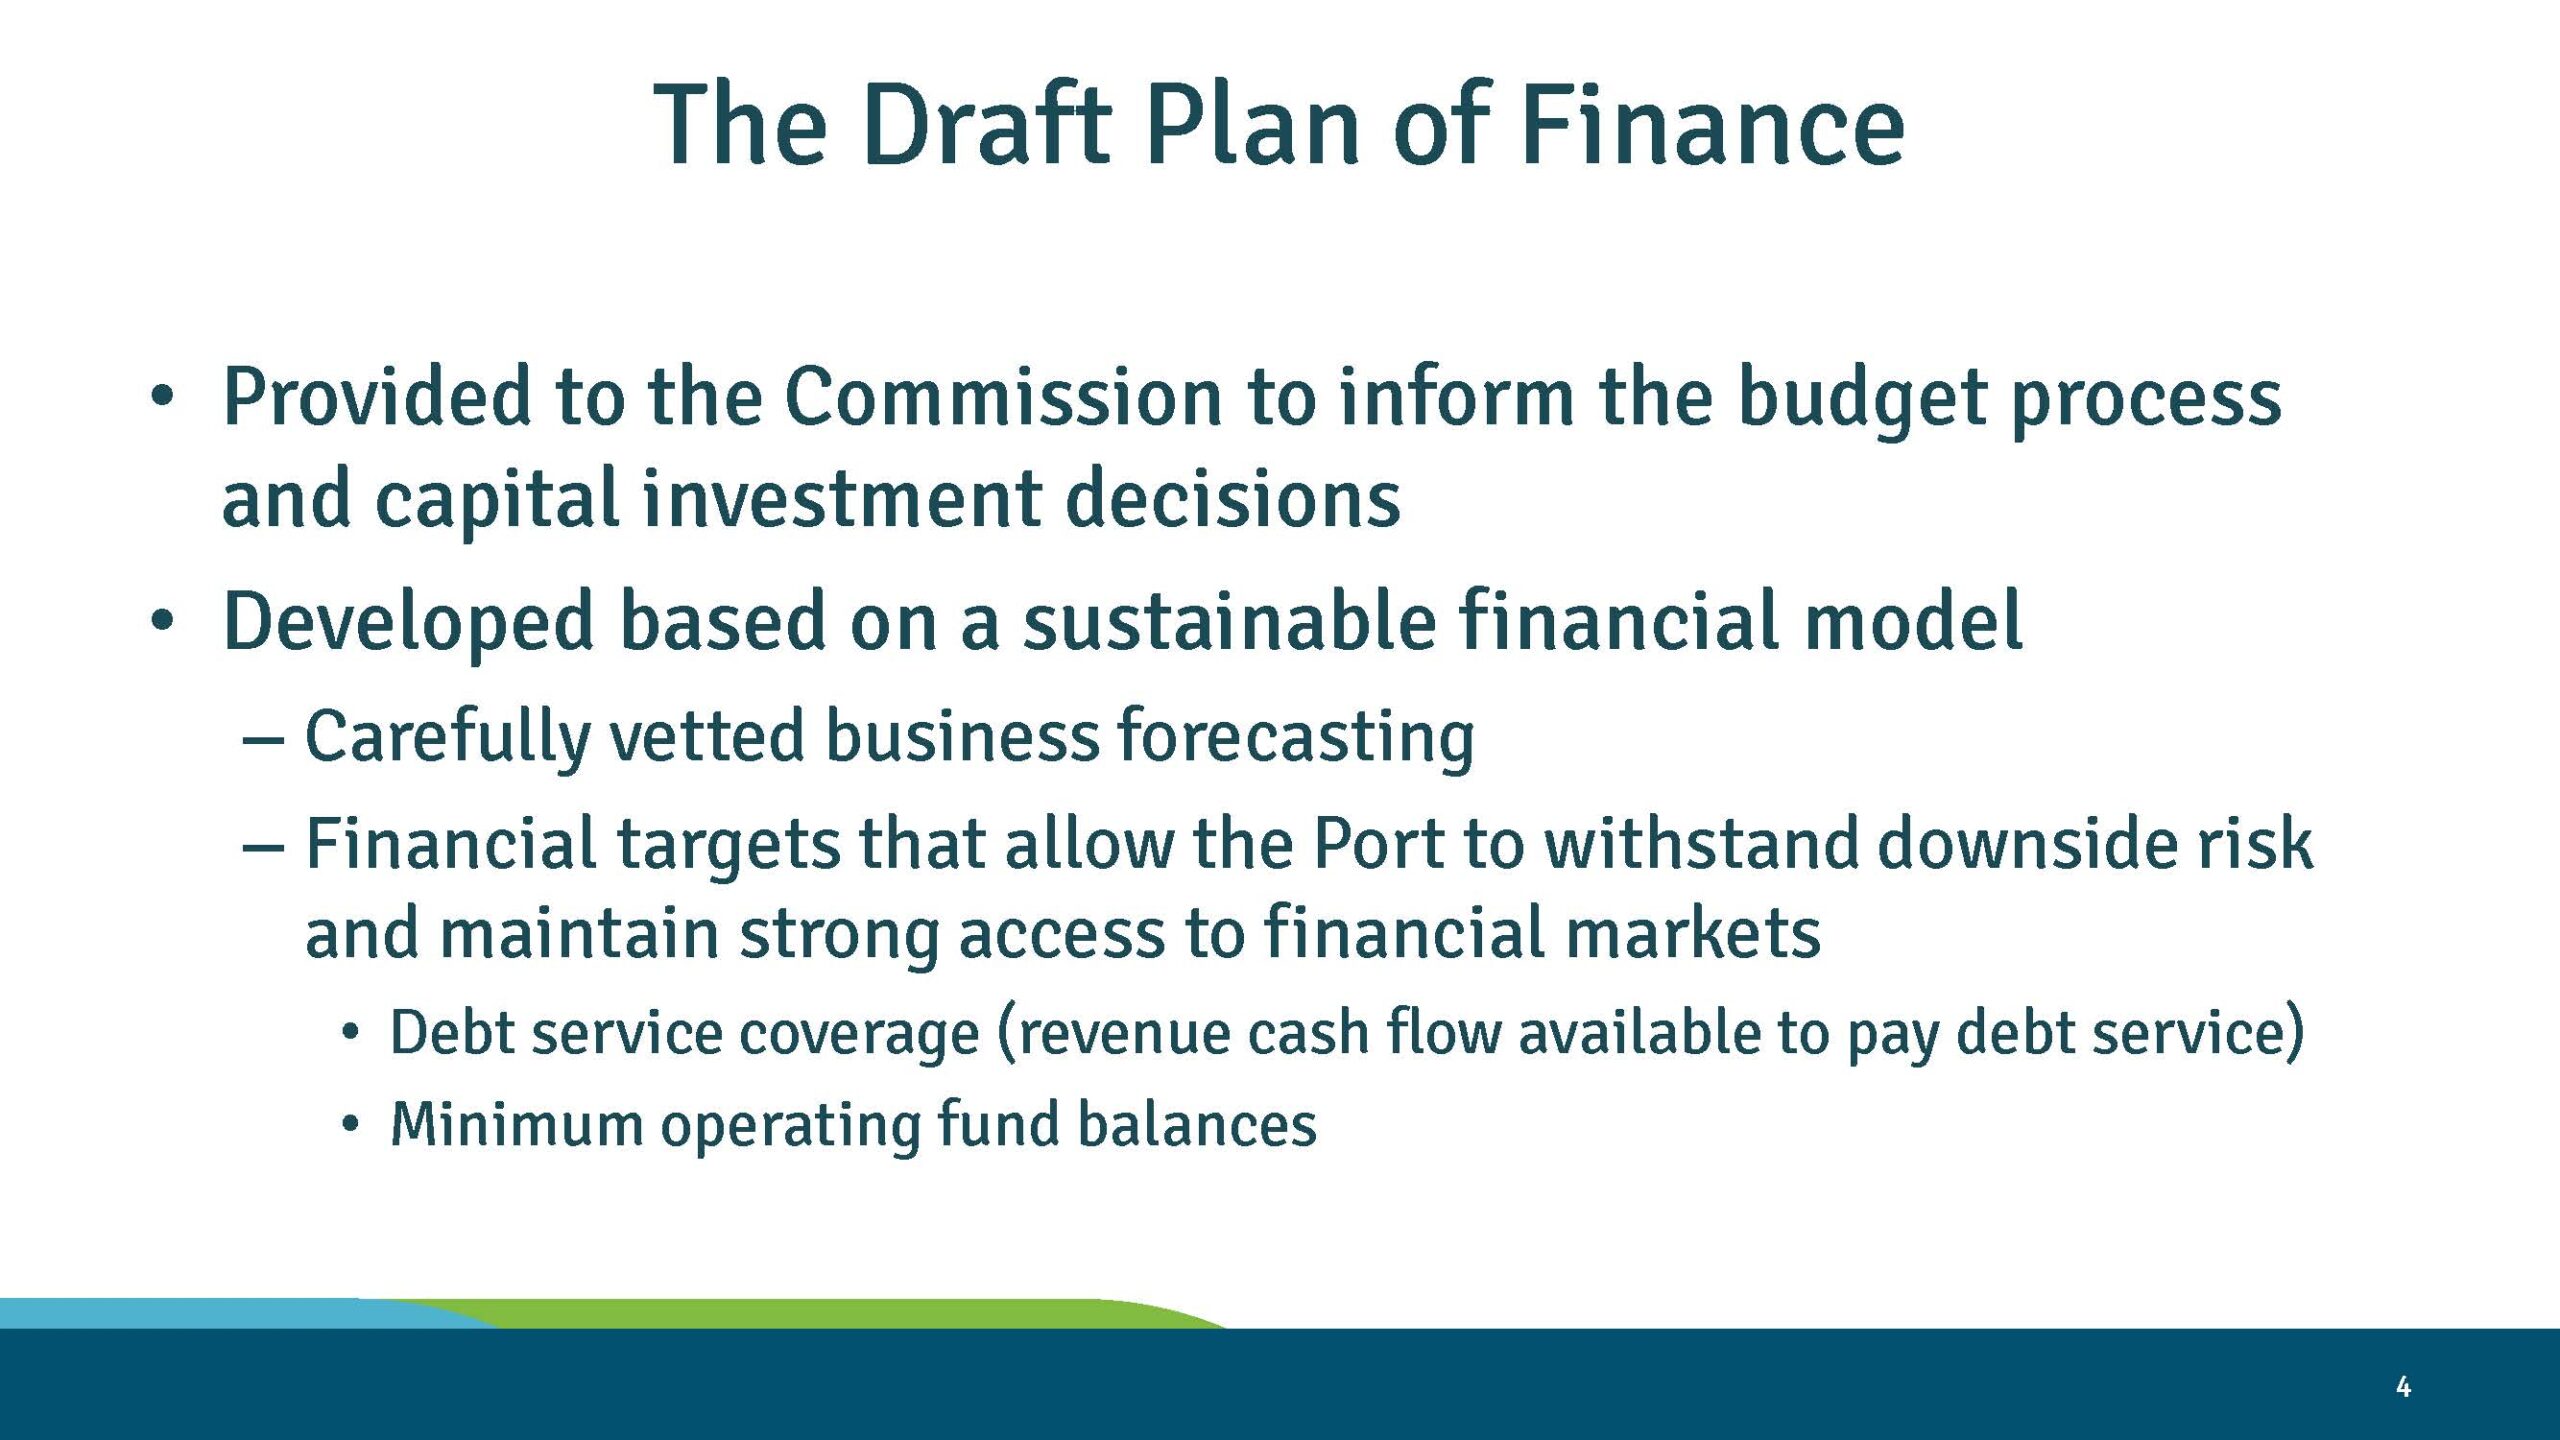
A presentation slide titled 'The Draft Plan of Finance' outlining a sustainable financial model provided to a Commission to inform budget and capital investment decisions. Key elements include vetted business forecasting, financial targets for downside risk resilience, debt service coverage, and minimum operating fund balances. The slide references 'the Port' but no specific port name, date, or organizational logo is visible. -
Draft Finance Plan 201-2023-2018_11_13_SM_7c_supp_Page_03
Title slide for the Port of Seattle's Draft Plan of Finance covering 2019-2023, bearing the official Port of Seattle logo. This document is relevant to Sea-Tac Airport financial planning and noise-policy budgeting for that five-year period. -
Draft Finance Plan 201-2023-2018_11_13_SM_7c_supp_Page_08
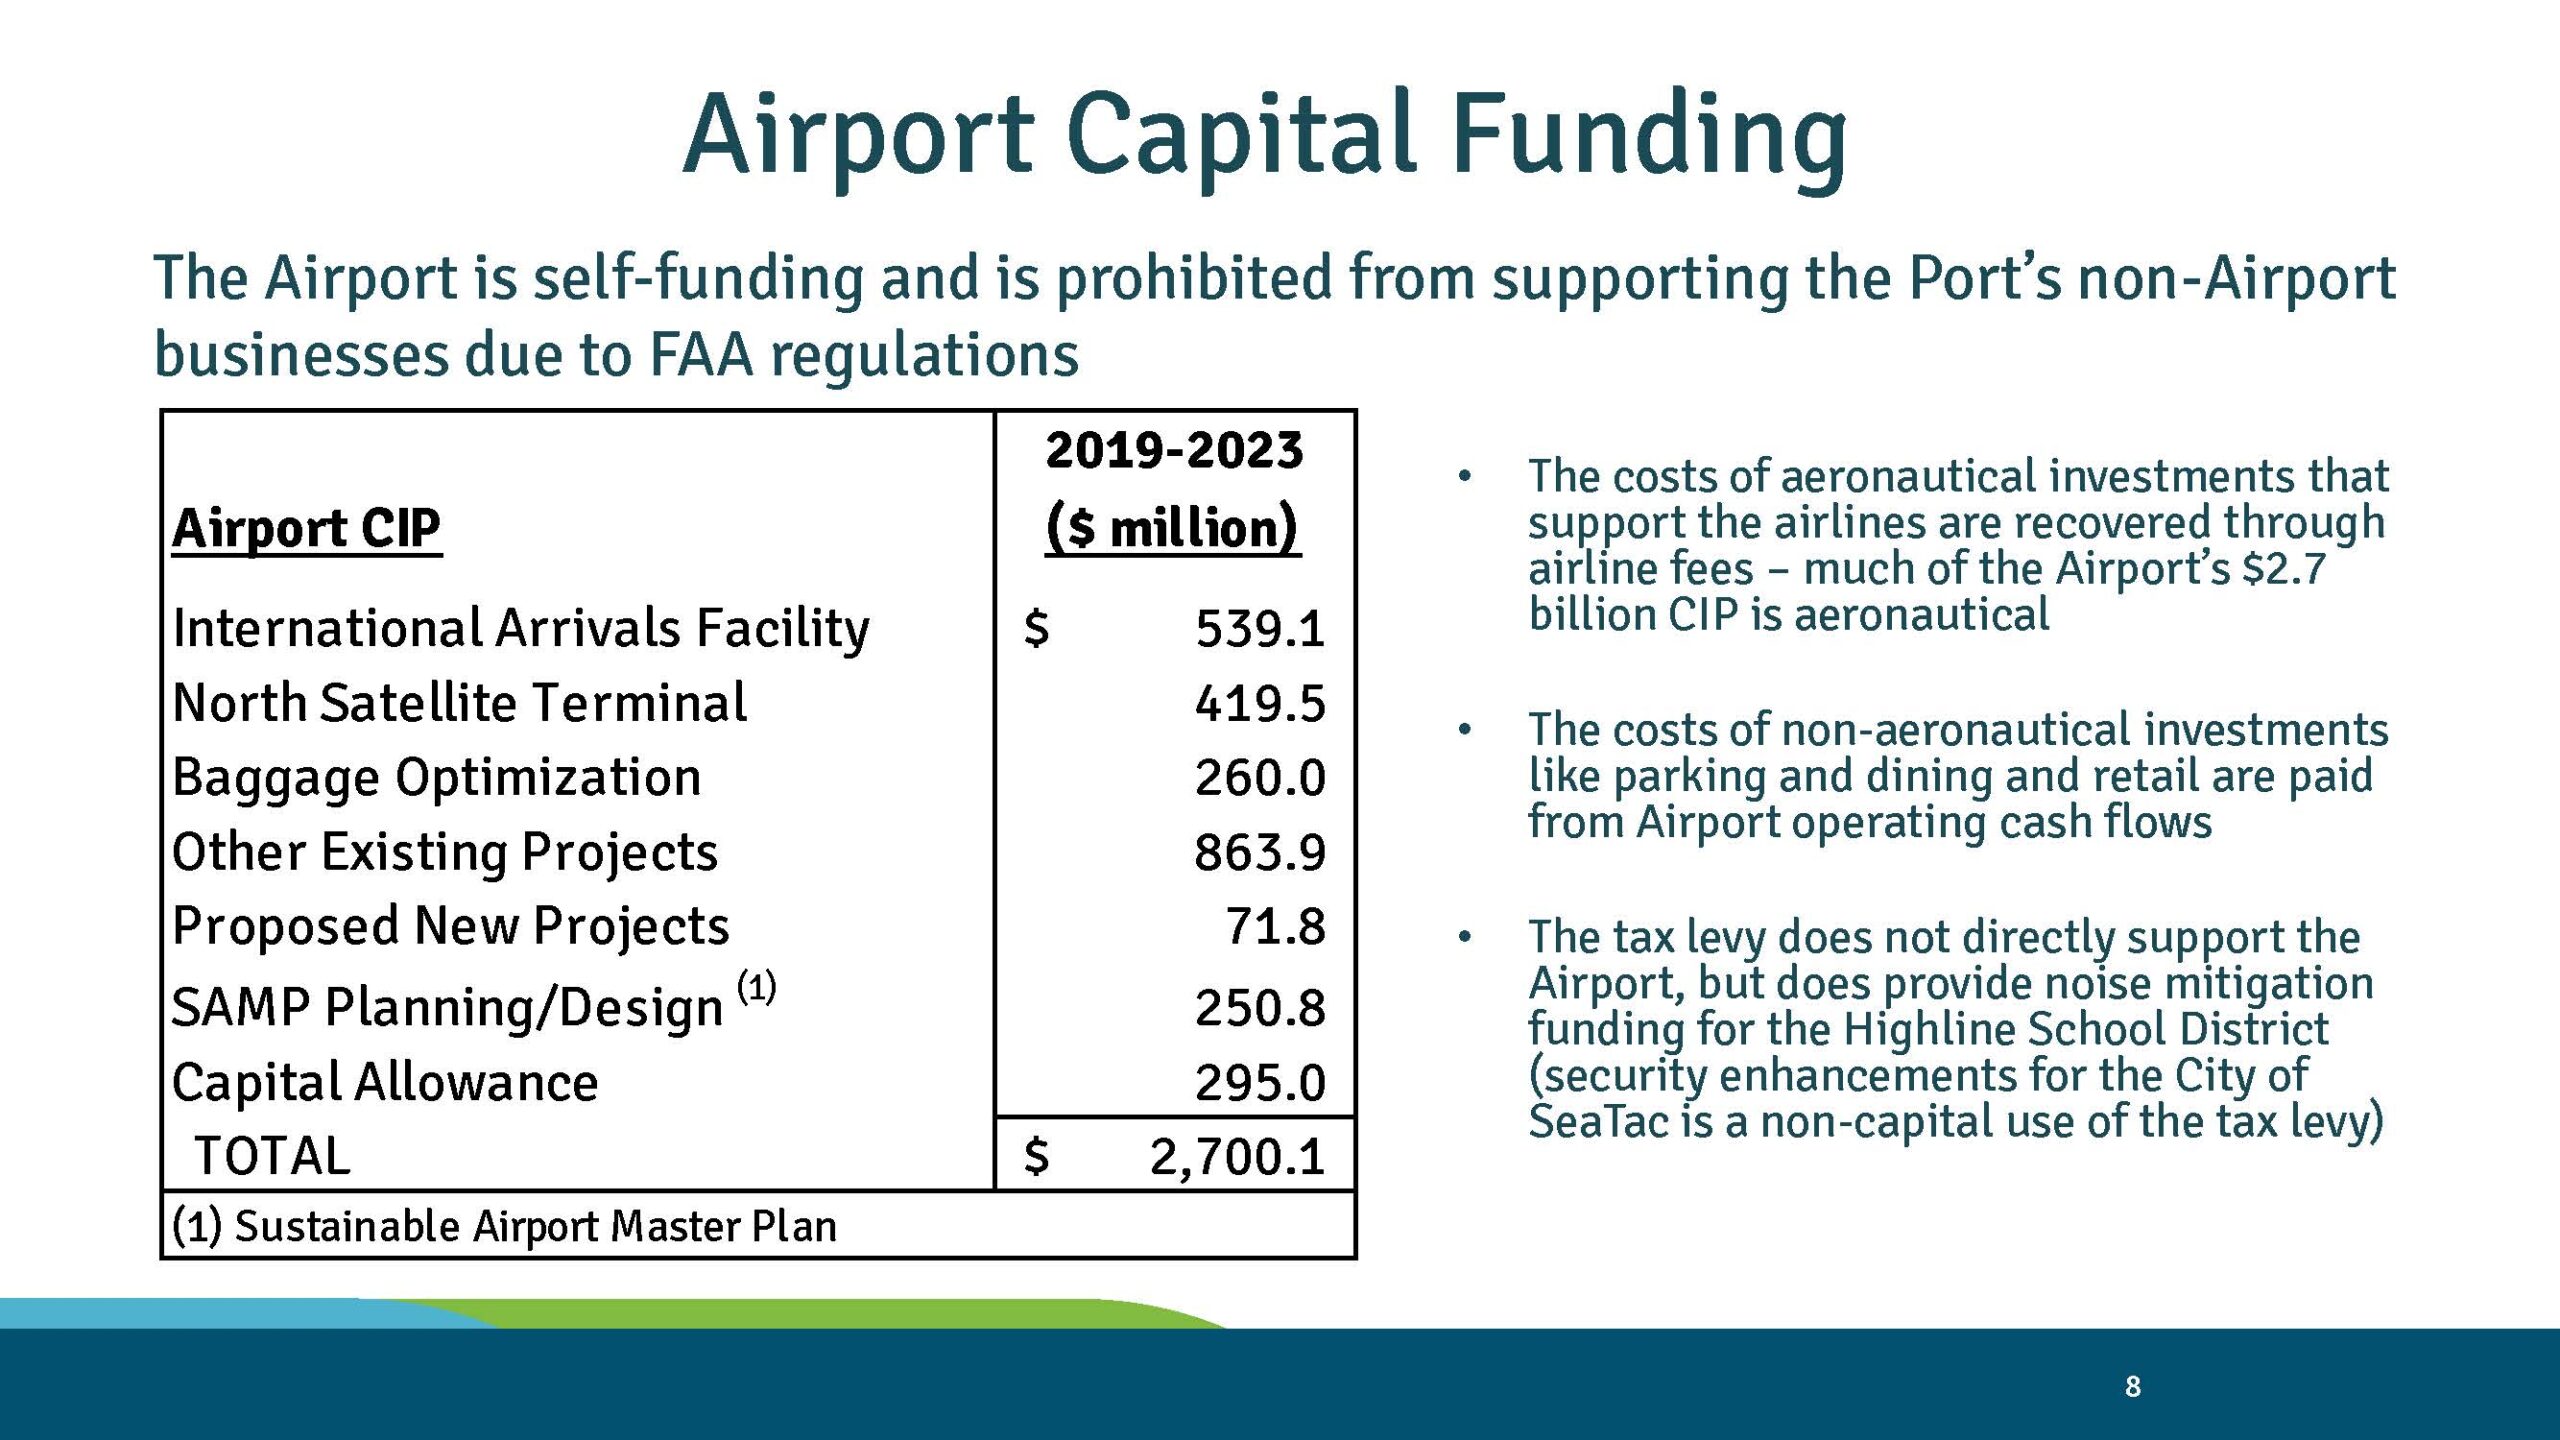
A Port of Seattle presentation slide titled 'Airport Capital Funding' details the Sea-Tac Airport Capital Improvement Program (CIP) for 2019–2023, totaling $2.7 billion across projects including the International Arrivals Facility ($539.1M), North Satellite Terminal ($419.5M), Baggage Optimization ($260.0M), and SAMP (Sustainable Airport Master Plan) Planning/Design ($250.8M). The slide notes the airport is self-funding under FAA regulations and that the tax levy provides noise mitigation funding for the Highline School District. -
Draft Finance Plan 201-2023-2018_11_13_SM_7c_supp_Page_07
Slide 7 from a Port of Seattle presentation titled 'Capital Planning and Funding – Airport,' featuring the Port of Seattle logo. The slide appears to be a section-divider slide within a larger capital planning or budget briefing document related to Sea-Tac Airport. -
Draft Finance Plan 201-2023-2018_11_13_SM_7c_supp_Page_06
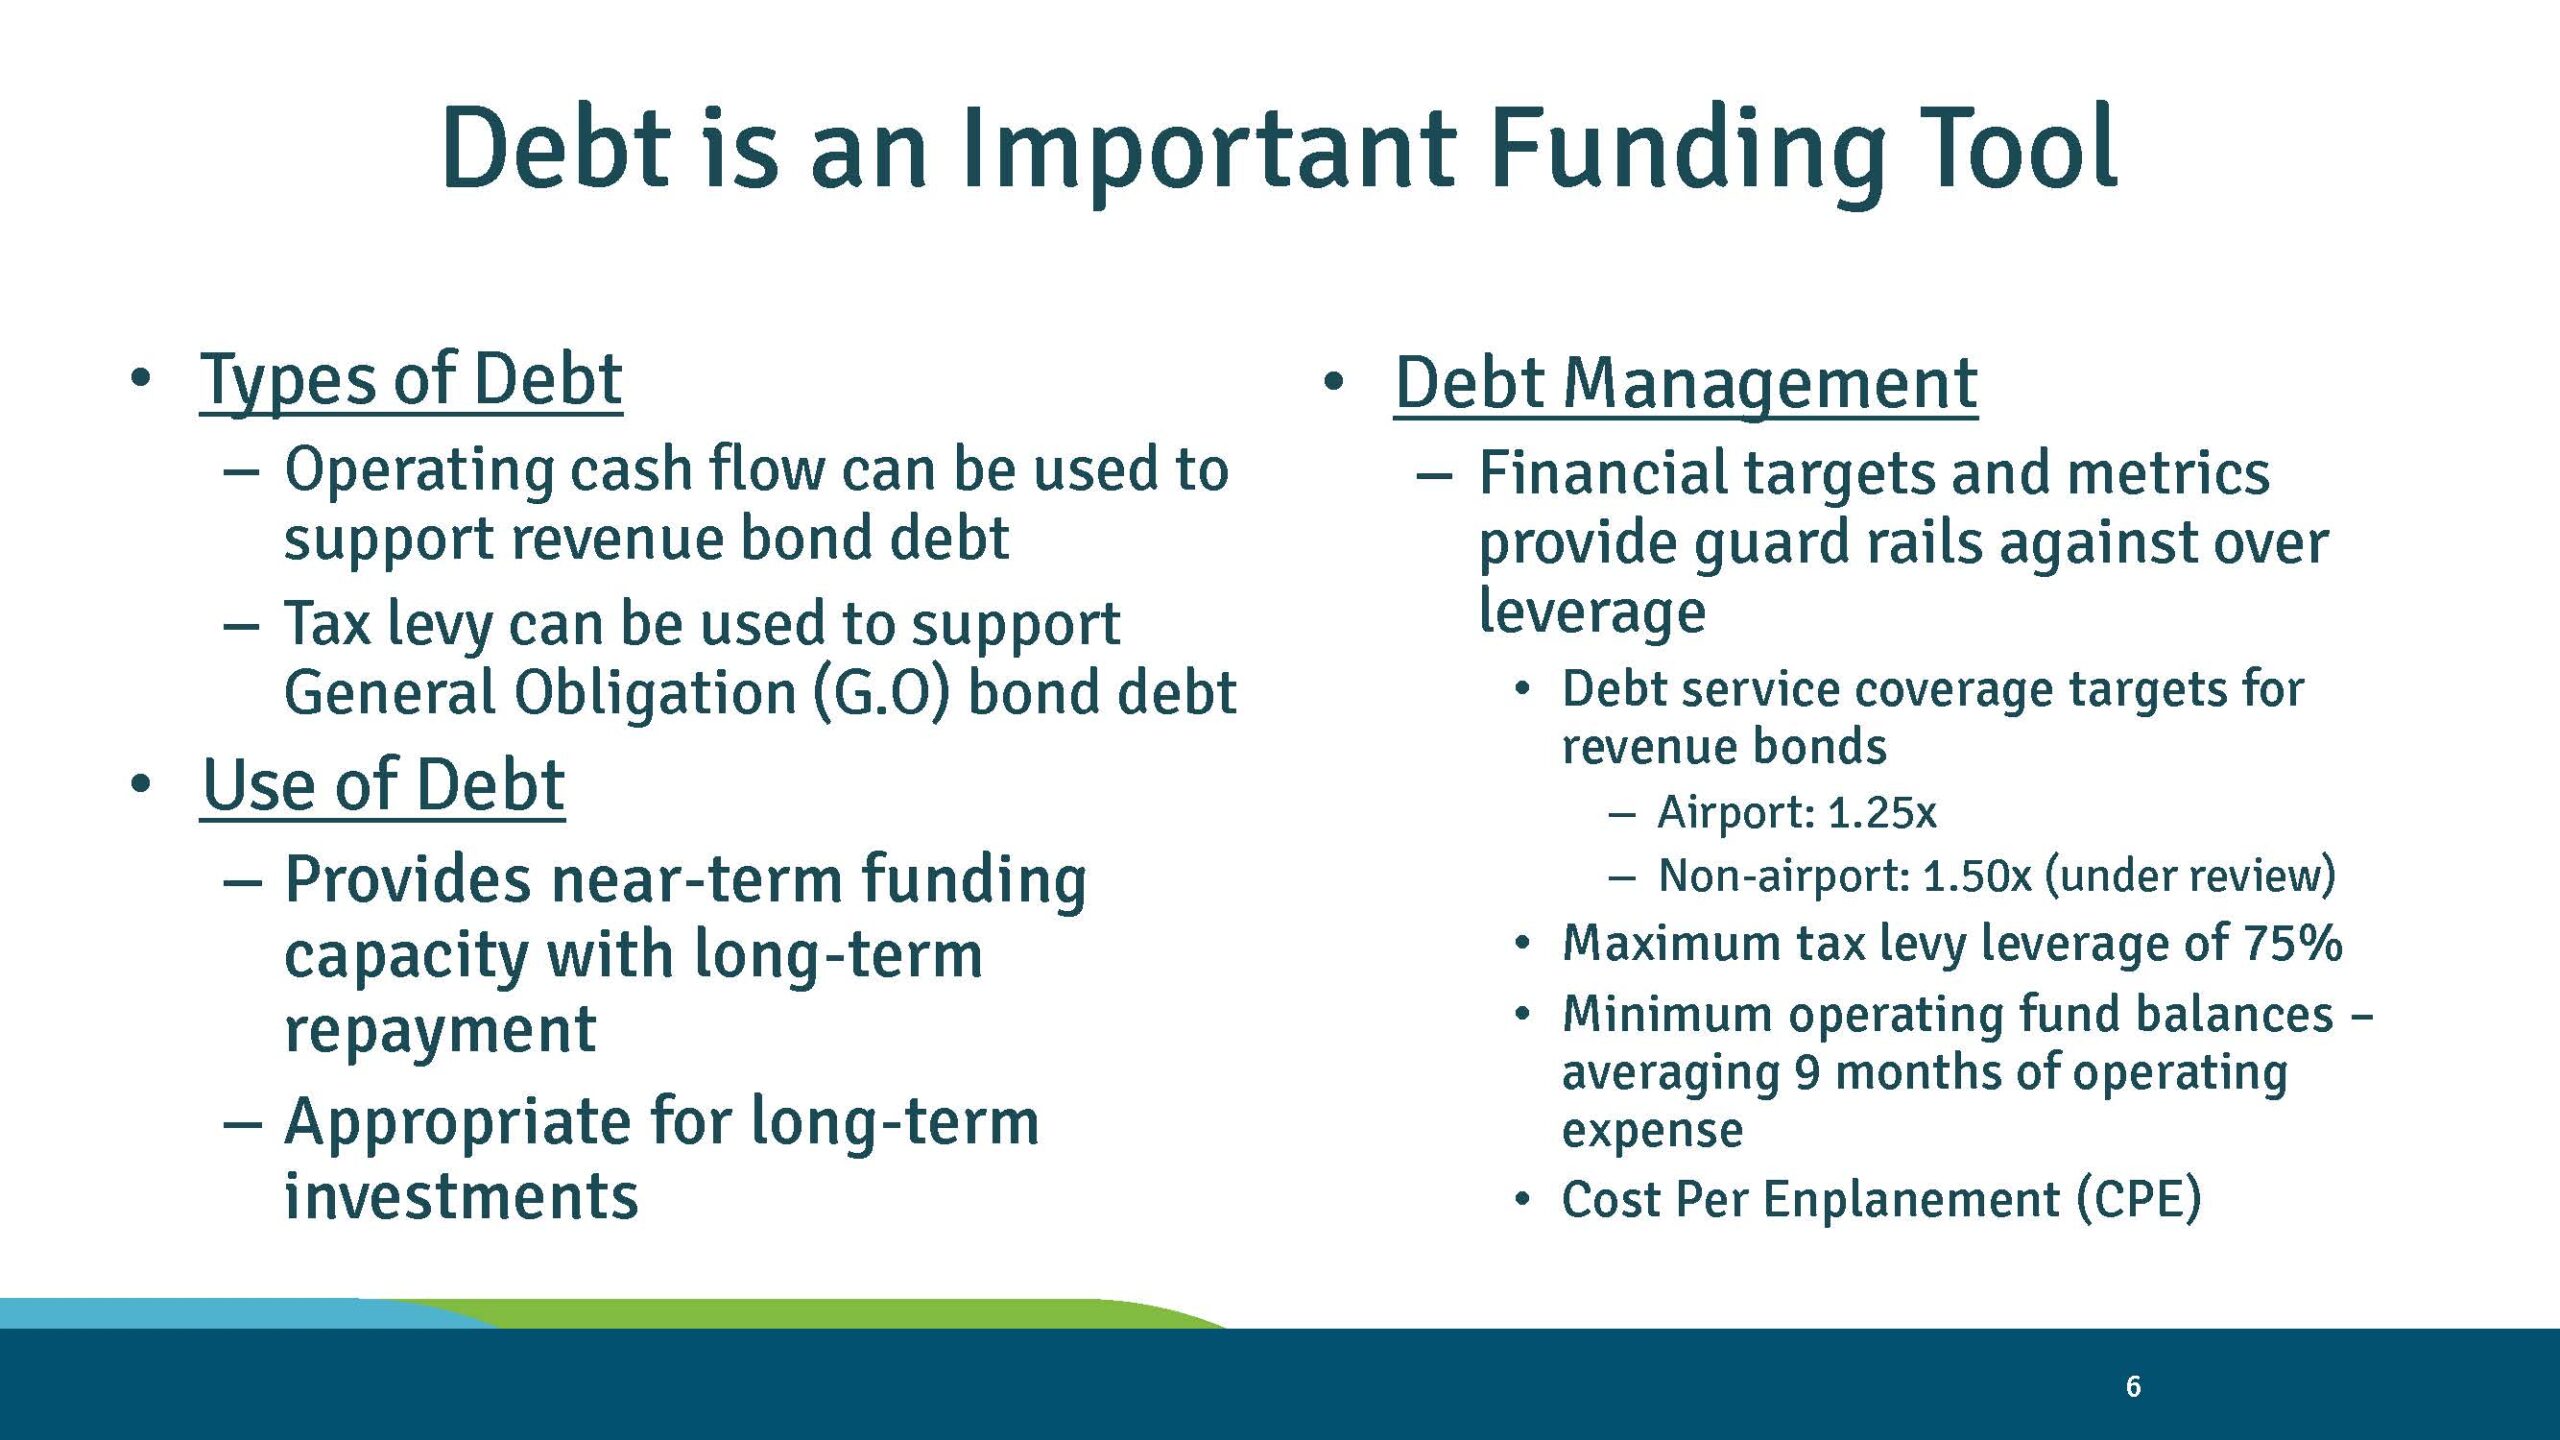
A presentation slide titled 'Debt is an Important Funding Tool' outlining types of debt (revenue bonds supported by operating cash flow, General Obligation bonds supported by tax levy), uses of debt, and debt management metrics including debt service coverage targets (Airport: 1.25x, Non-airport: 1.50x under review), maximum tax levy leverage of 75%, minimum operating fund balances averaging 9 months of operating expense, and Cost Per Enplanement (CPE). No organizational logo or date is visible, though the airport-specific metrics suggest relevance to a major airport authority finance briefing. -
Draft Finance Plan 201-2023-2018_11_13_SM_7c_supp_Page_05
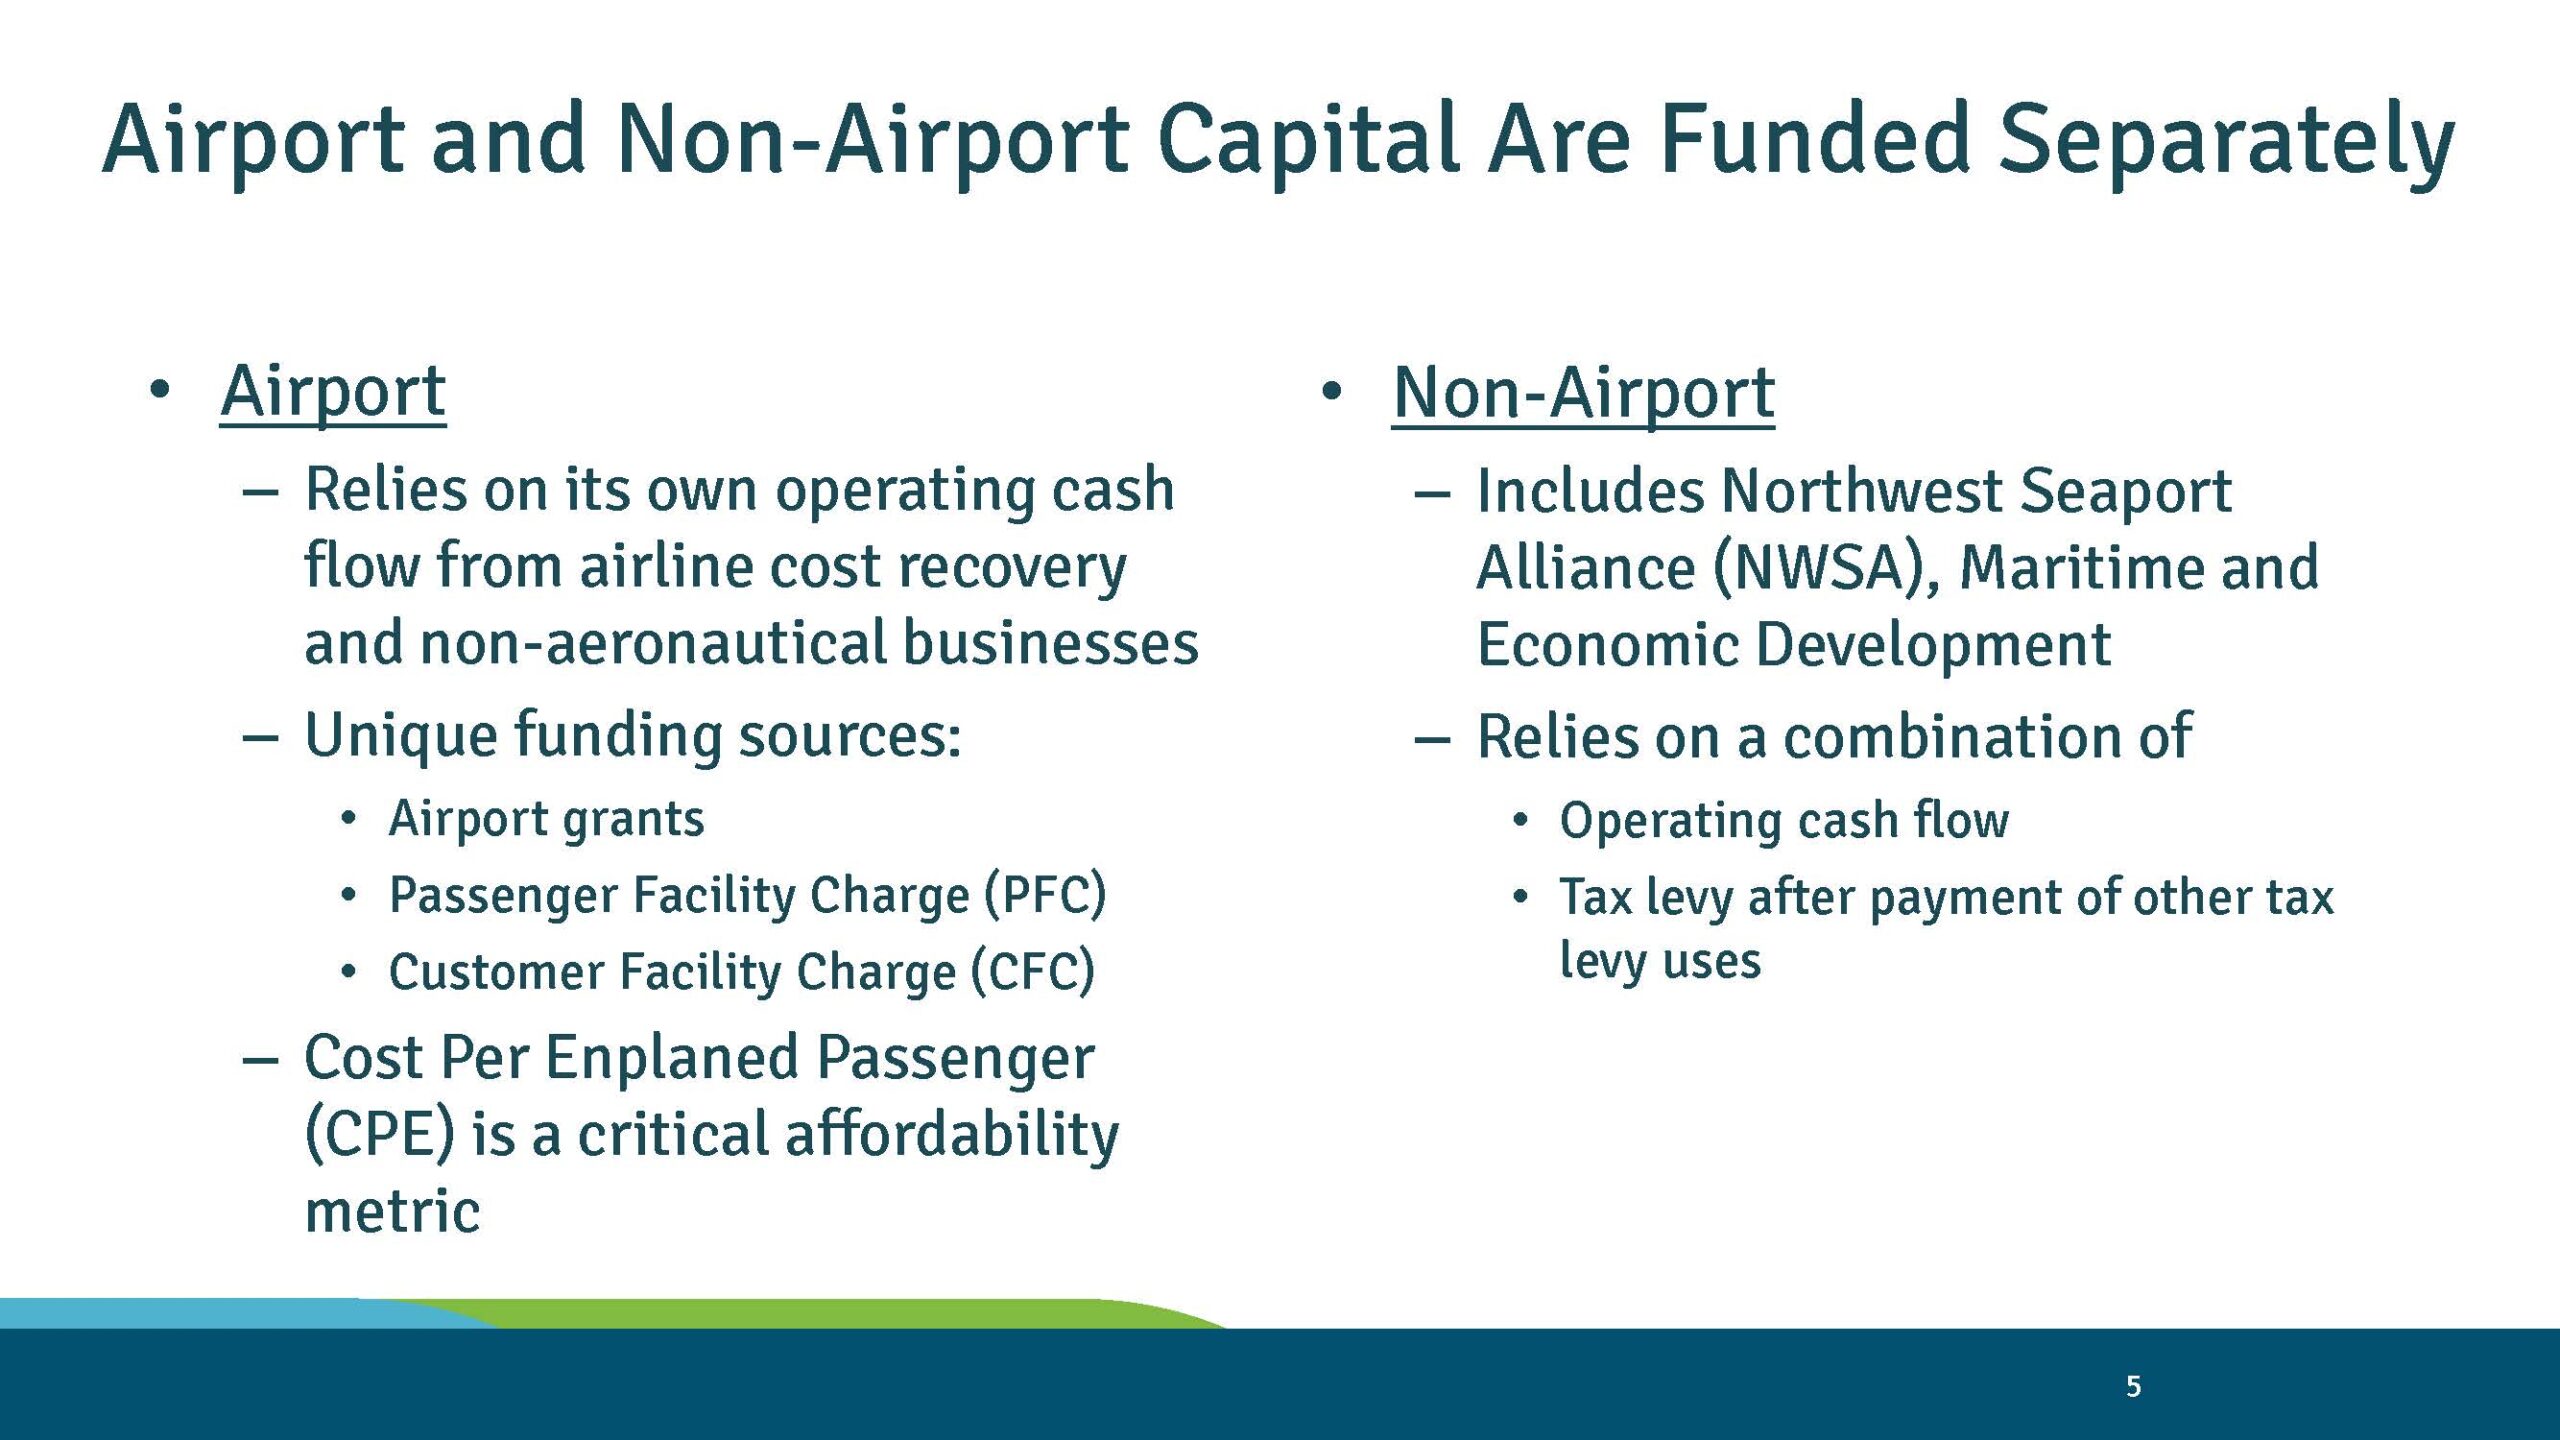
Slide 5 from a Port of Seattle capital finance presentation explains that Airport and Non-Airport capital are funded separately. Airport capital relies on airline cost recovery, non-aeronautical revenues, airport grants, Passenger Facility Charges (PFC), and Customer Facility Charges (CFC), with Cost Per Enplaned Passenger (CPE) as a key affordability metric; Non-Airport capital (covering Northwest Seaport Alliance, Maritime, and Economic Development) relies on operating cash flow and tax levy funds. -
Draft Finance Plan 201-2023-2018_11_13_SM_7c_supp_Page_13
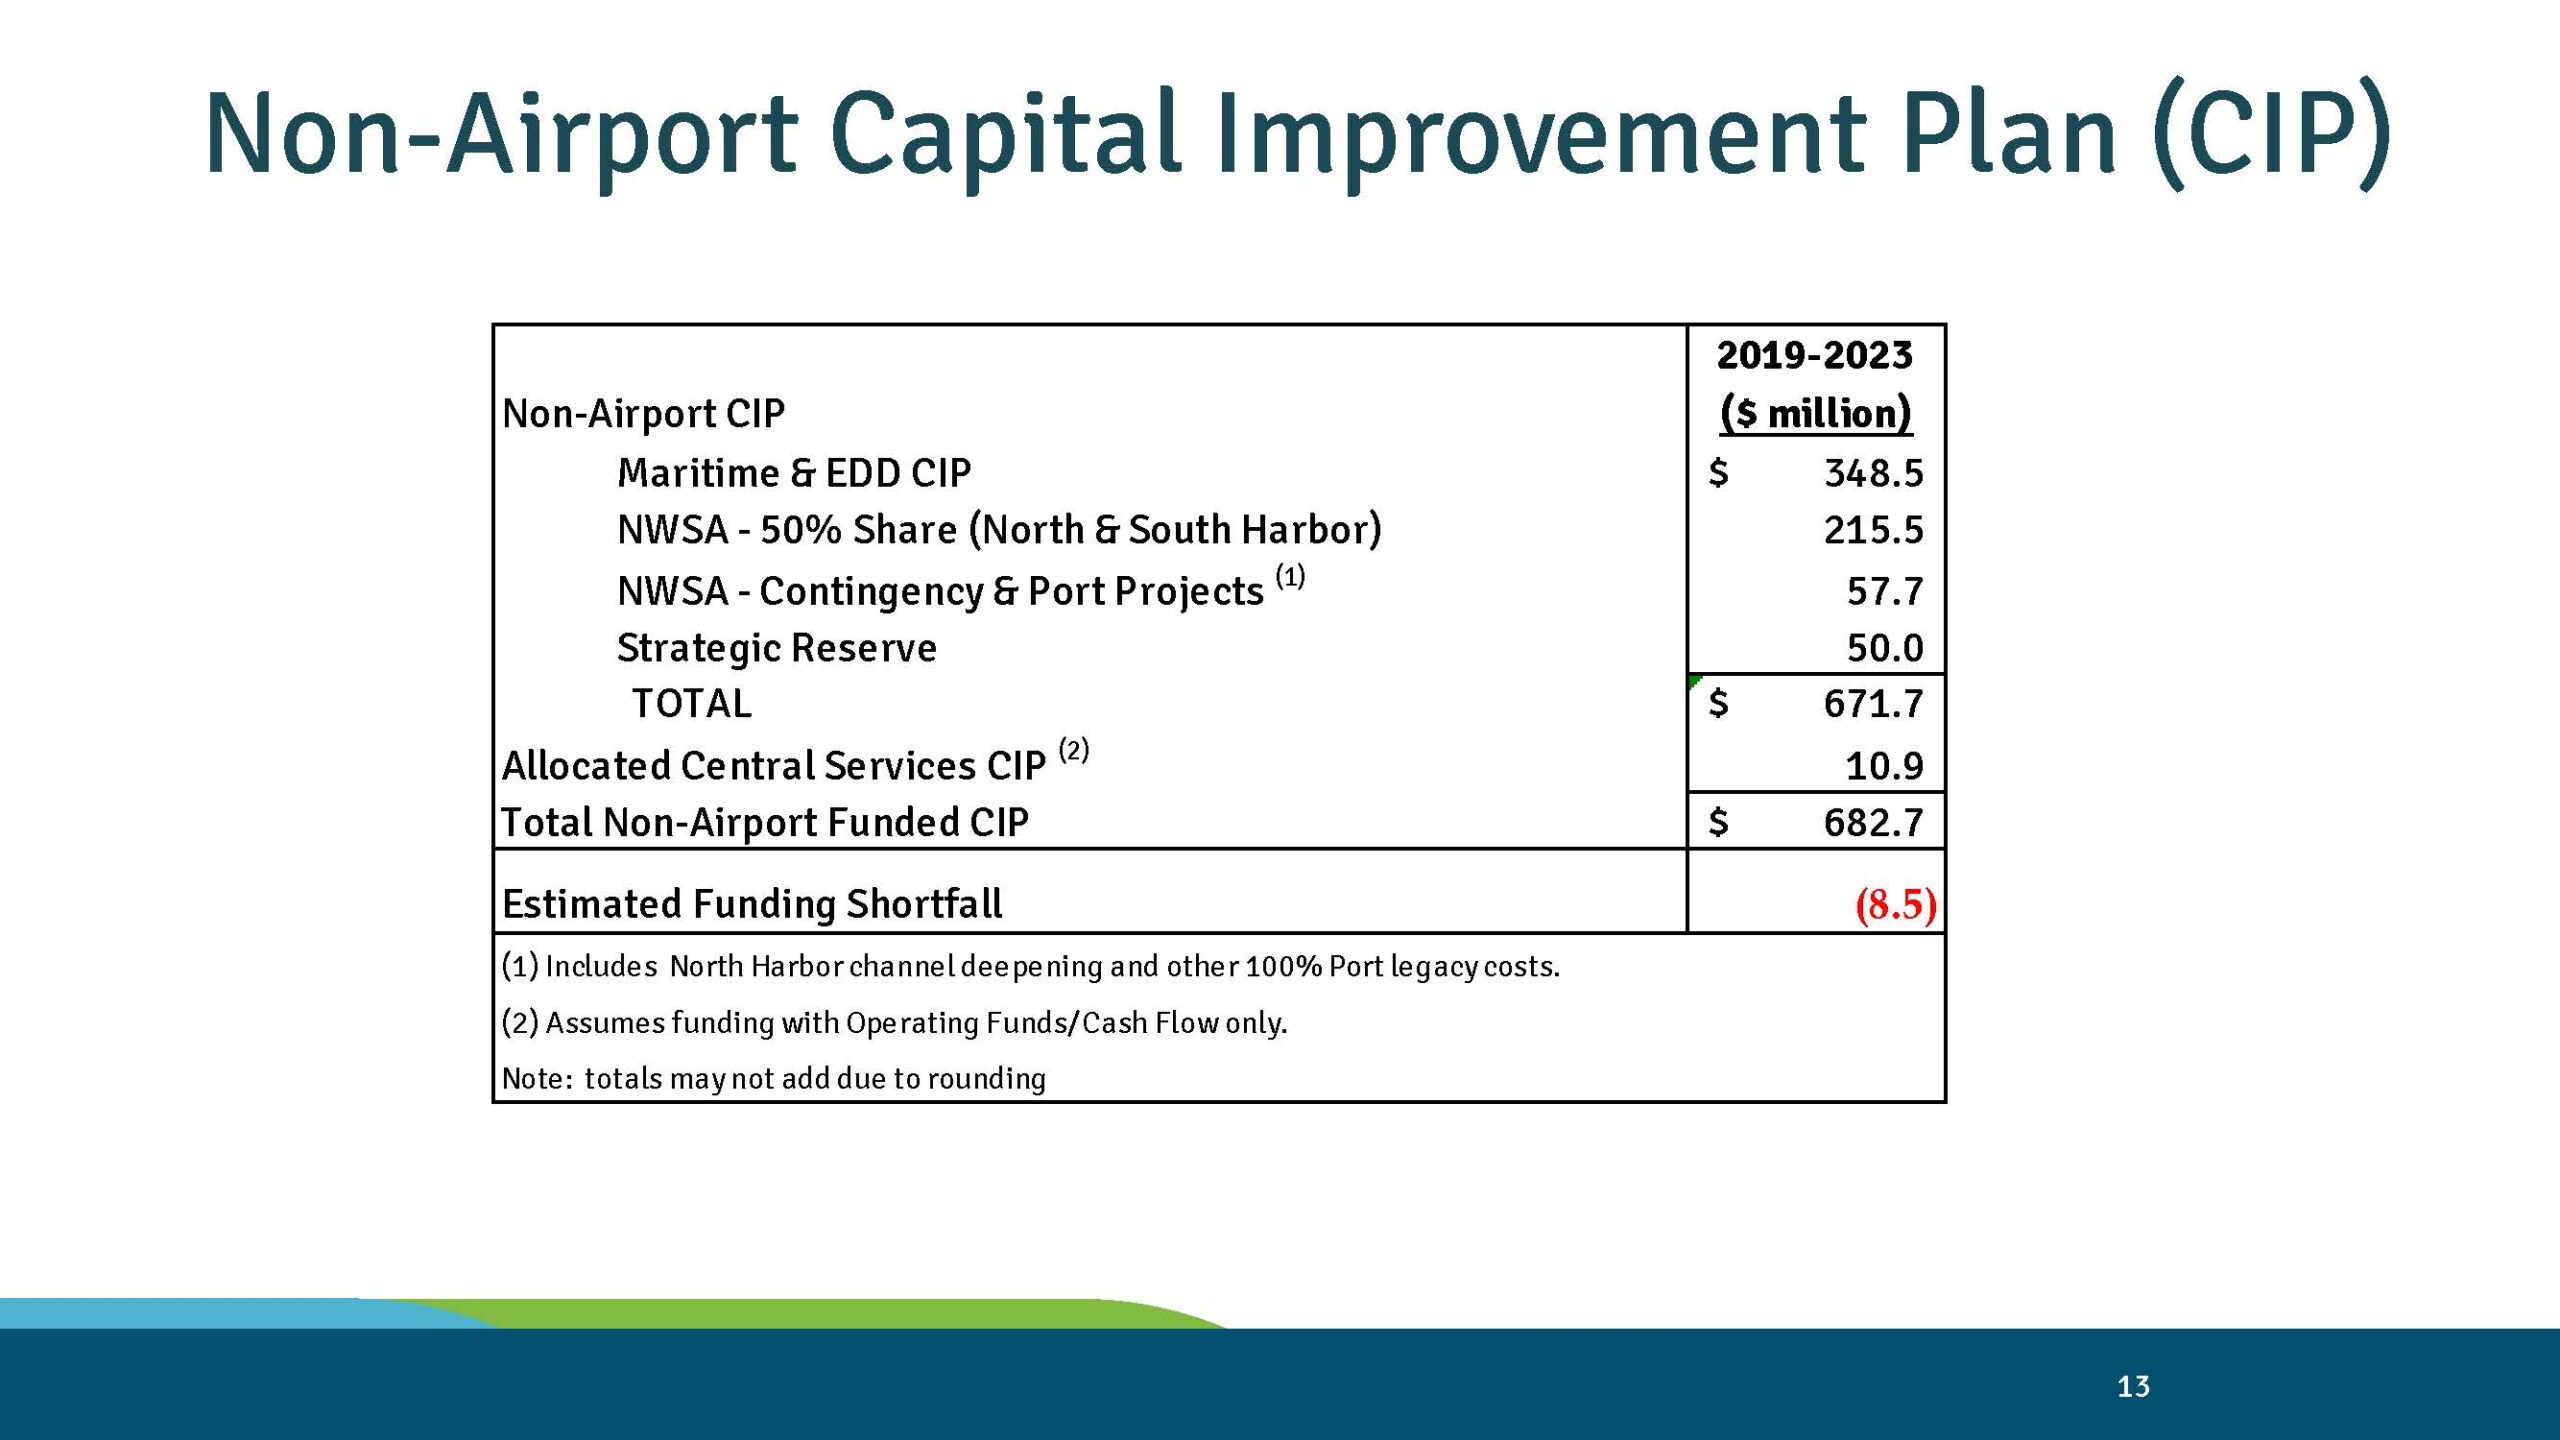
A financial summary slide showing the Port of Seattle's Non-Airport Capital Improvement Plan for 2019–2023, totaling $682.7 million in funded CIP including Maritime & EDD, NWSA harbor shares, contingency and port projects, and strategic reserve, with an estimated funding shortfall of $8.5 million. This appears to be slide 13 from a Port of Seattle budget or planning presentation. -
Draft Finance Plan 201-2023-2018_11_13_SM_7c_supp_Page_12
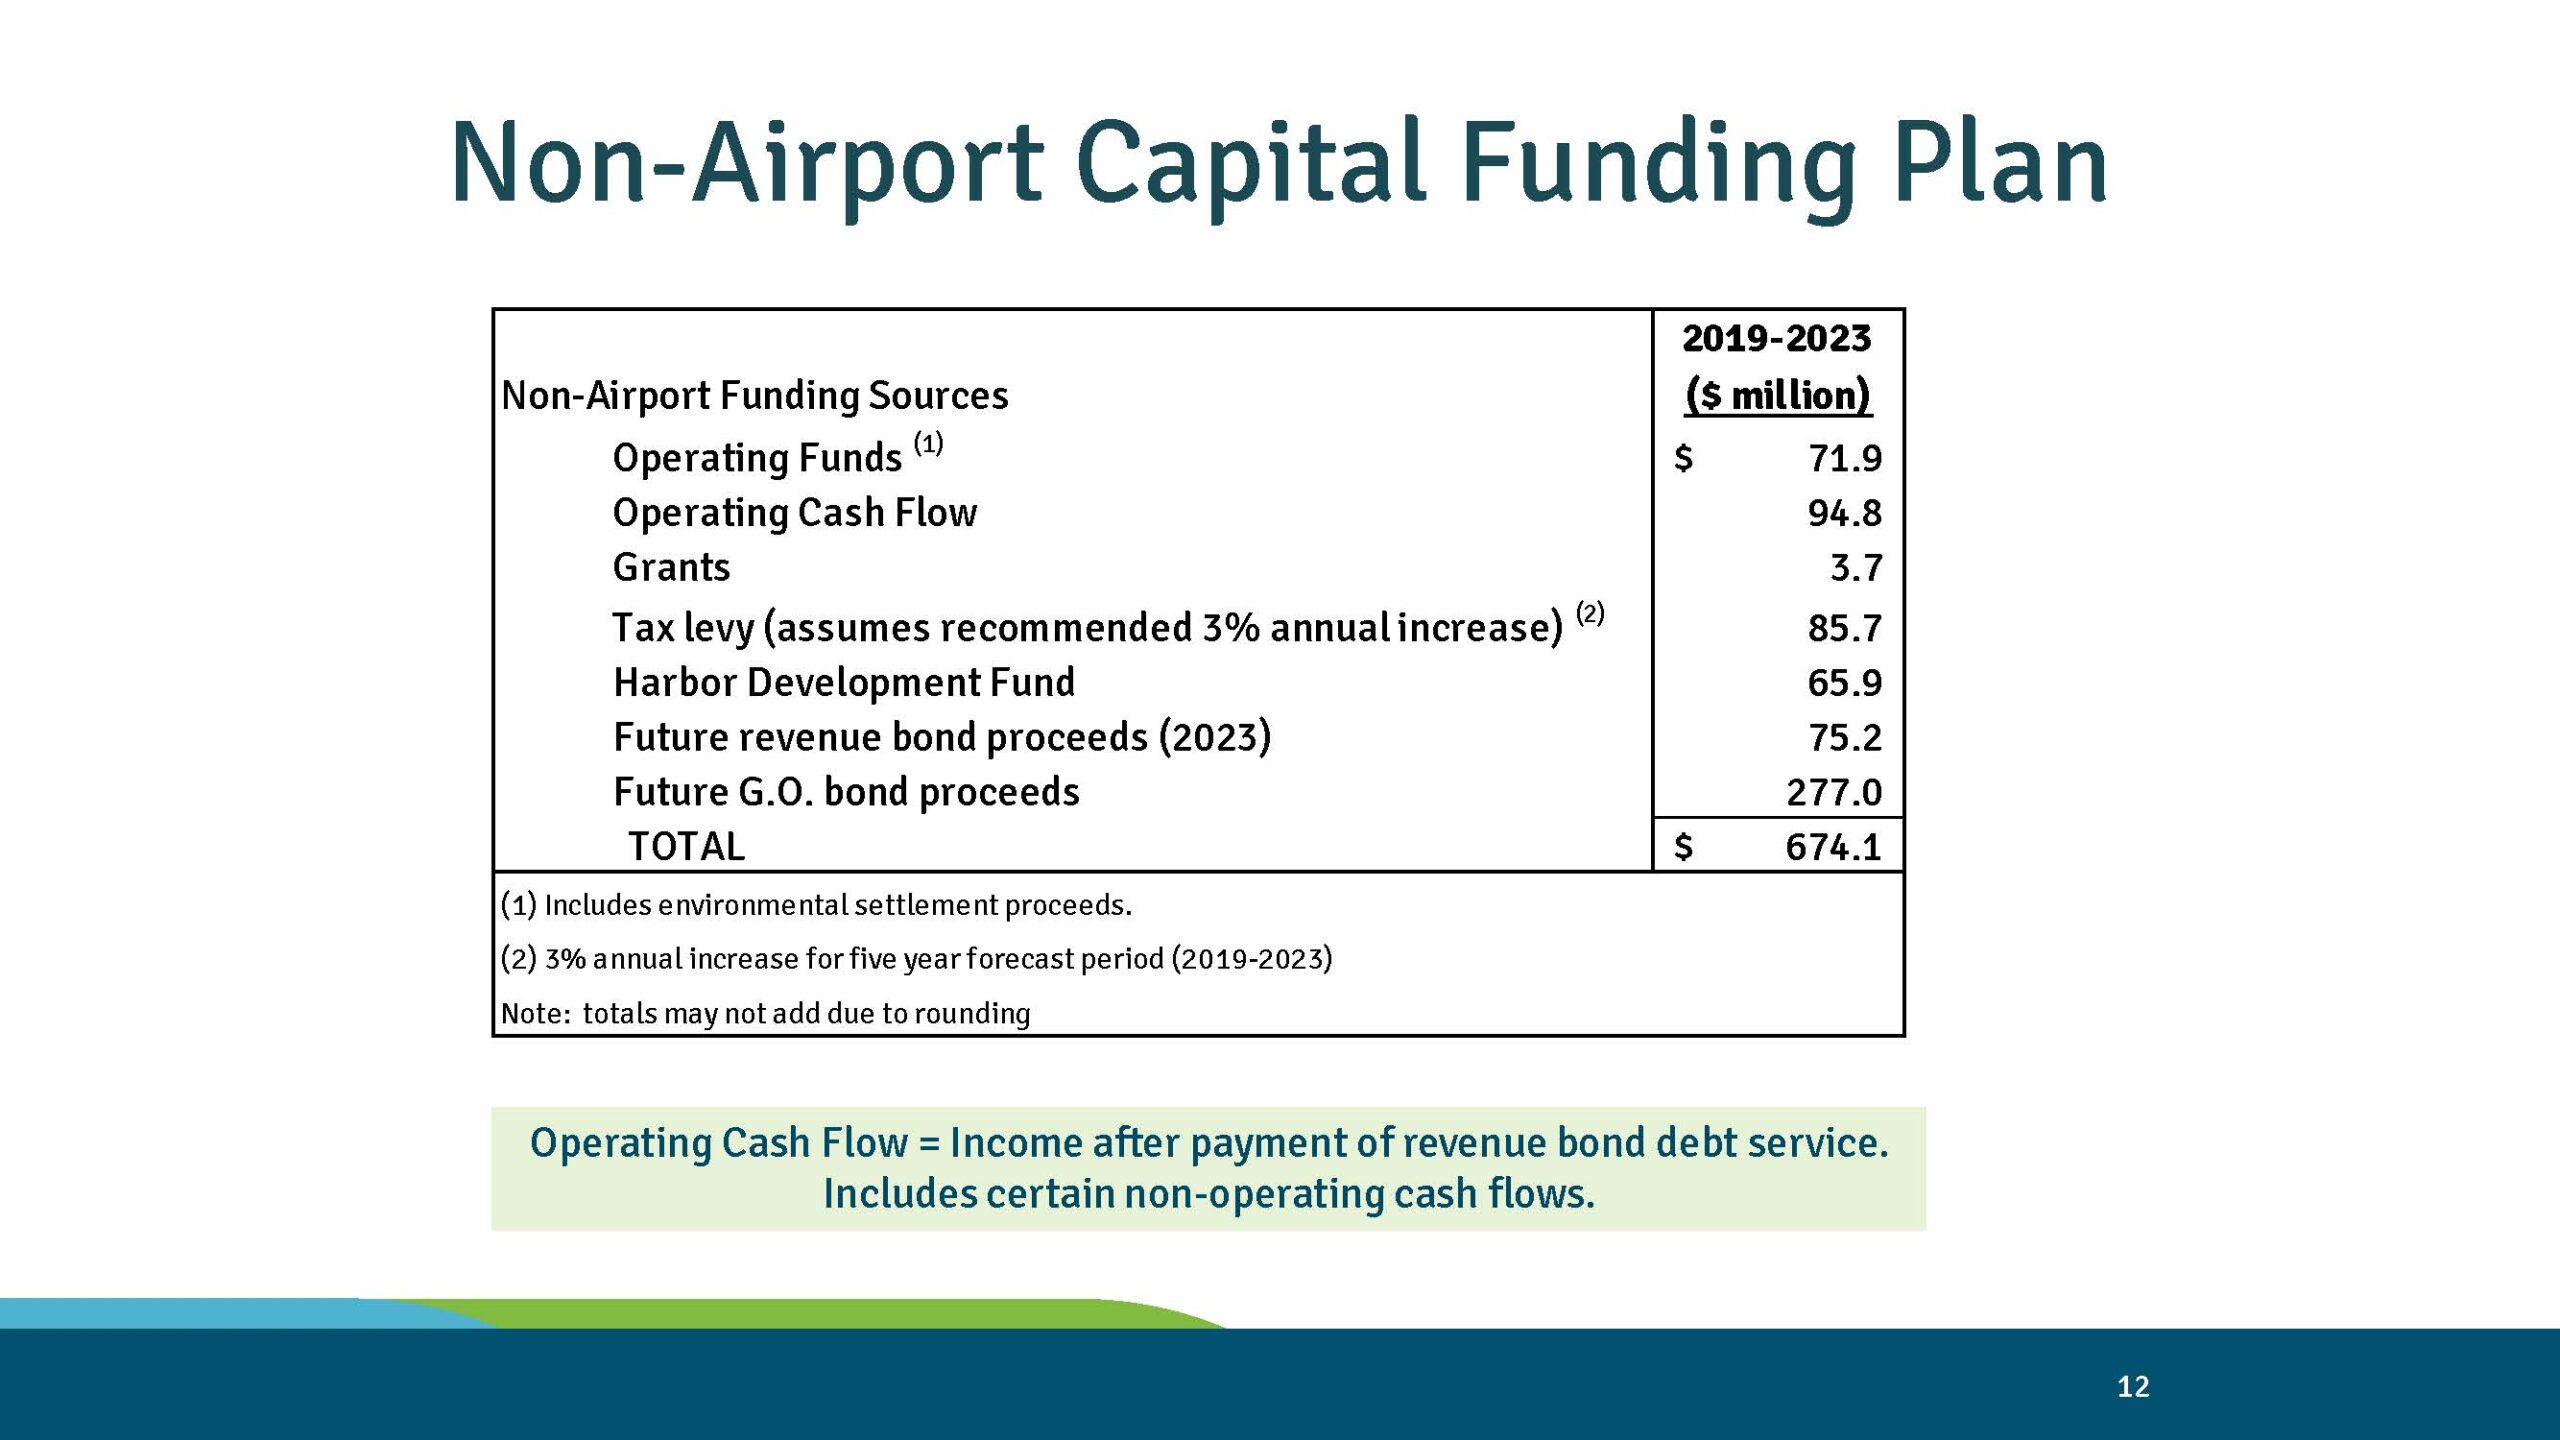
A financial table from a Port of Seattle presentation (slide 12) detailing non-airport capital funding sources for 2019–2023, totaling $674.1 million. Sources include Operating Funds ($71.9M), Operating Cash Flow ($94.8M), Grants ($3.7M), Tax Levy at 3% annual increase ($85.7M), Harbor Development Fund ($65.9M), Future Revenue Bond Proceeds ($75.2M), and Future G.O. Bond Proceeds ($277.0M).