TagNEPA(390)
-
2024_10_22_SM_Packet_Supplemental (11a SAMP EA Presentation)_38
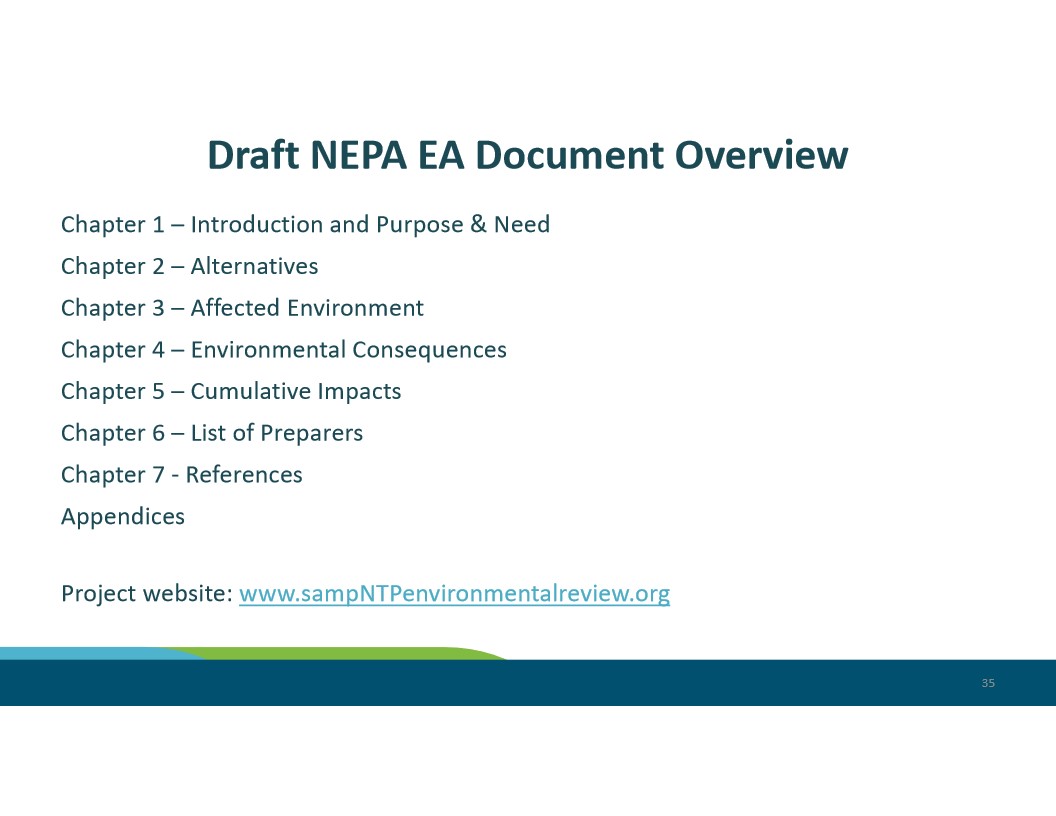
Slide 35 presents the chapter structure of the Draft NEPA Environmental Assessment (EA) document for the SAMP-NTP project, covering Introduction/Purpose & Need, Alternatives, Affected Environment, Environmental Consequences, Cumulative Impacts, List of Preparers, References, and Appendices. The project website is listed as www.sampNTPenvironmentalreview.org, indicating this is associated with Sea-Tac Airport's Sustainable Airport Master Plan – Near-Term Projects environmental review process. -
2024_10_22_SM_Packet_Supplemental (11a SAMP EA Presentation)_37
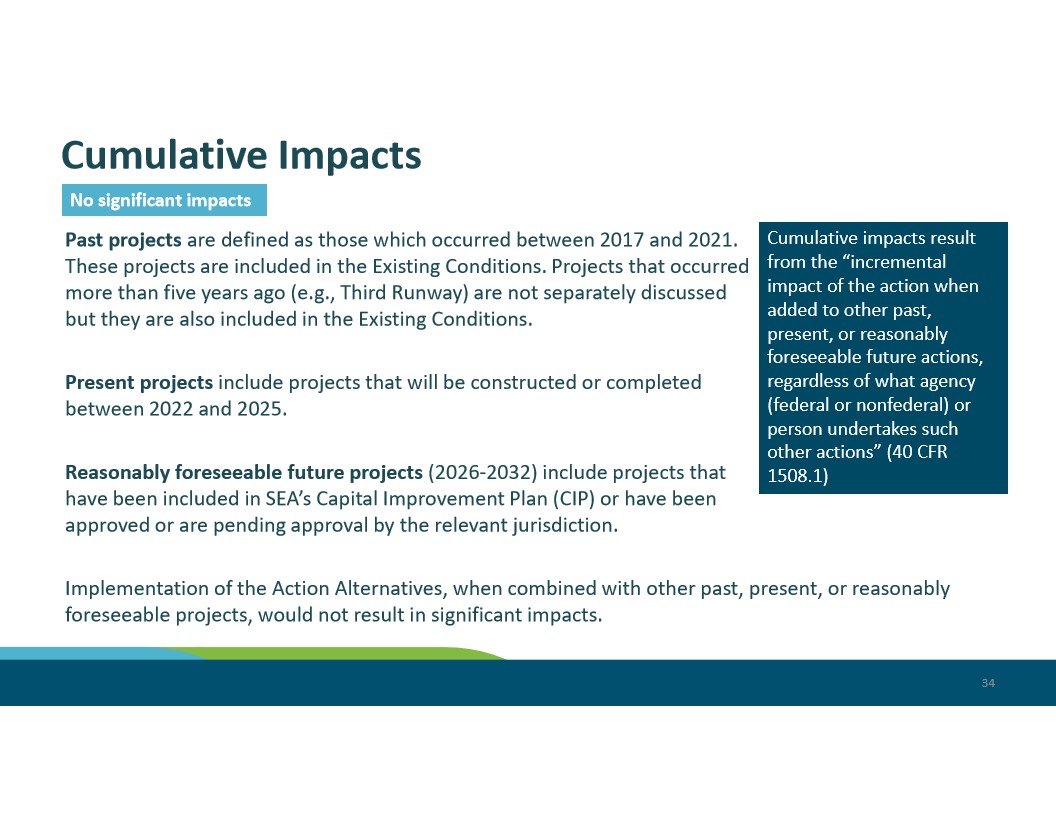
Slide 34 from a Seattle-Tacoma International Airport (SEA) environmental review presentation defines past (2017–2021), present (2022–2025), and reasonably foreseeable future (2026–2032) projects for cumulative impact analysis under 40 CFR 1508.1. It concludes that implementation of the Action Alternatives, combined with other past, present, or foreseeable projects, would not result in significant cumulative impacts. -
2024_10_22_SM_Packet_Supplemental (11a SAMP EA Presentation)_36
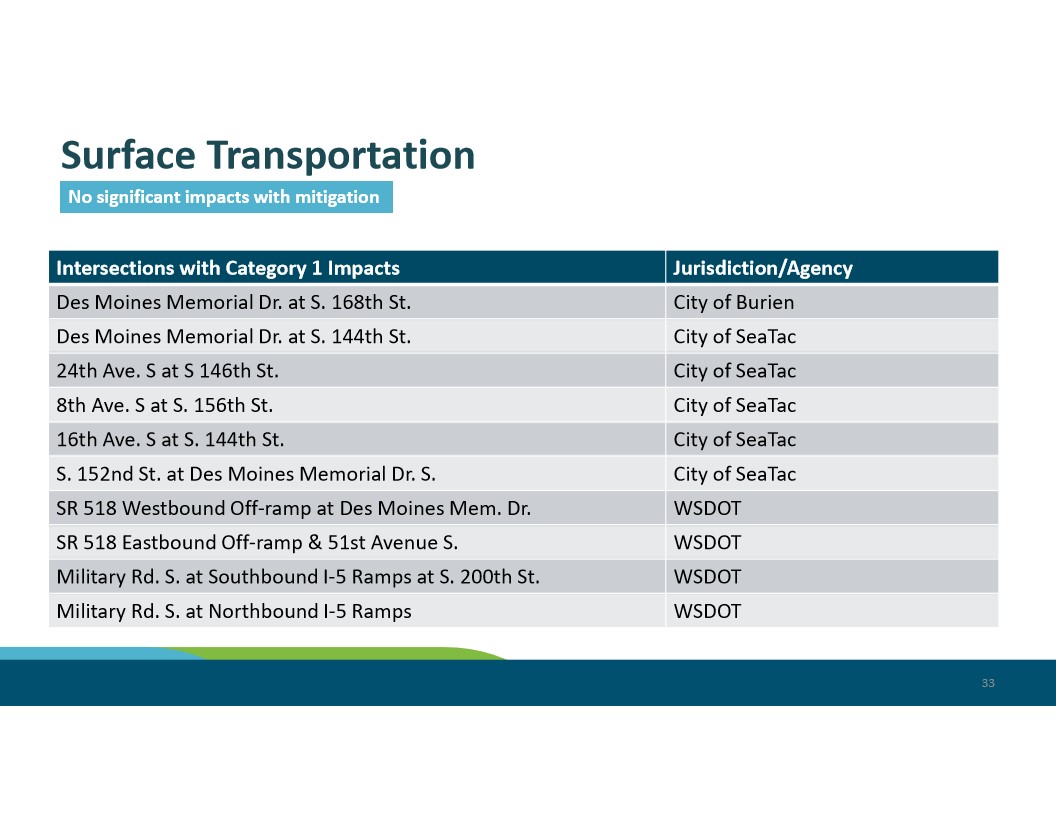
A presentation slide titled 'Surface Transportation' noting 'No significant impacts with mitigation,' listing ten intersections with Category 1 impacts and their jurisdictions, including the City of Burien, City of SeaTac, and WSDOT. Affected intersections include locations on Des Moines Memorial Drive, SR 518 ramps, and Military Road S. at I-5 ramps. -
2024_10_22_SM_Packet_Supplemental (11a SAMP EA Presentation)_35
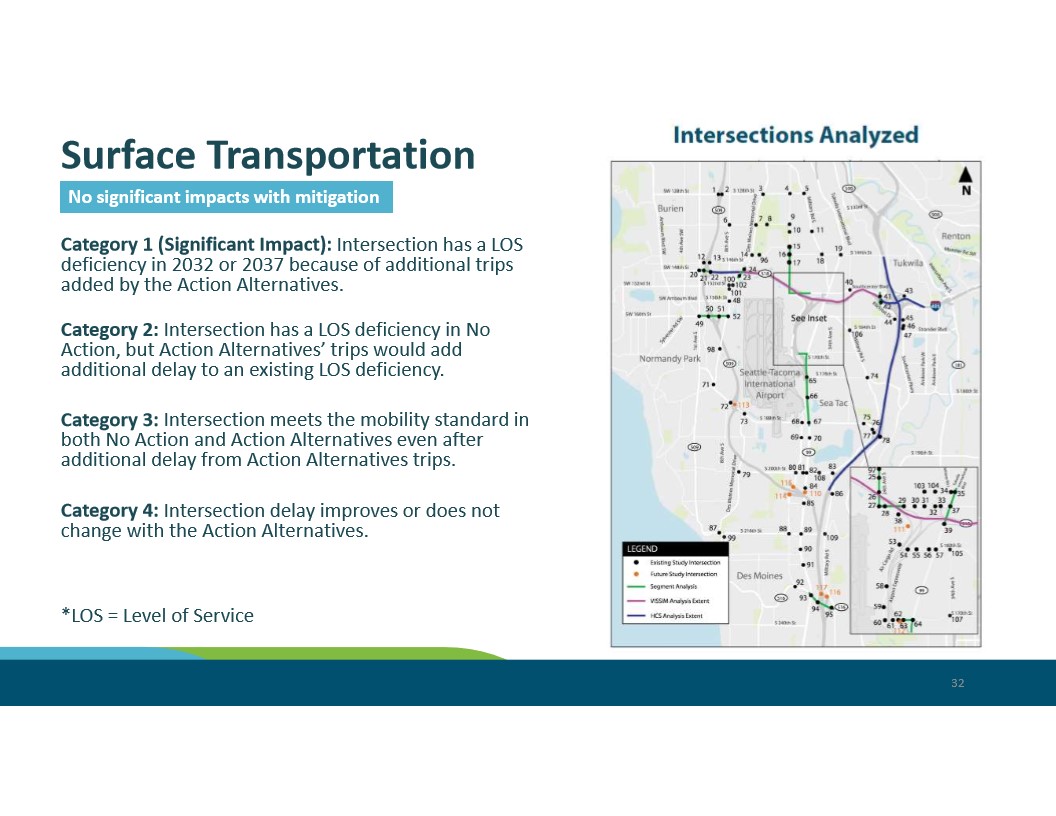
A presentation slide titled 'Surface Transportation' states 'No significant impacts with mitigation' and defines four categories of Level of Service (LOS) intersection impact for 2032 and 2037 Action Alternatives. The accompanying map shows numbered study intersections analyzed in the vicinity of Seattle-Tacoma International Airport, Des Moines, Burien, Tukwila, and Sea-Tac, with VISSIM and HCS analysis extents marked. -
2024_10_22_SM_Packet_Supplemental (11a SAMP EA Presentation)_33
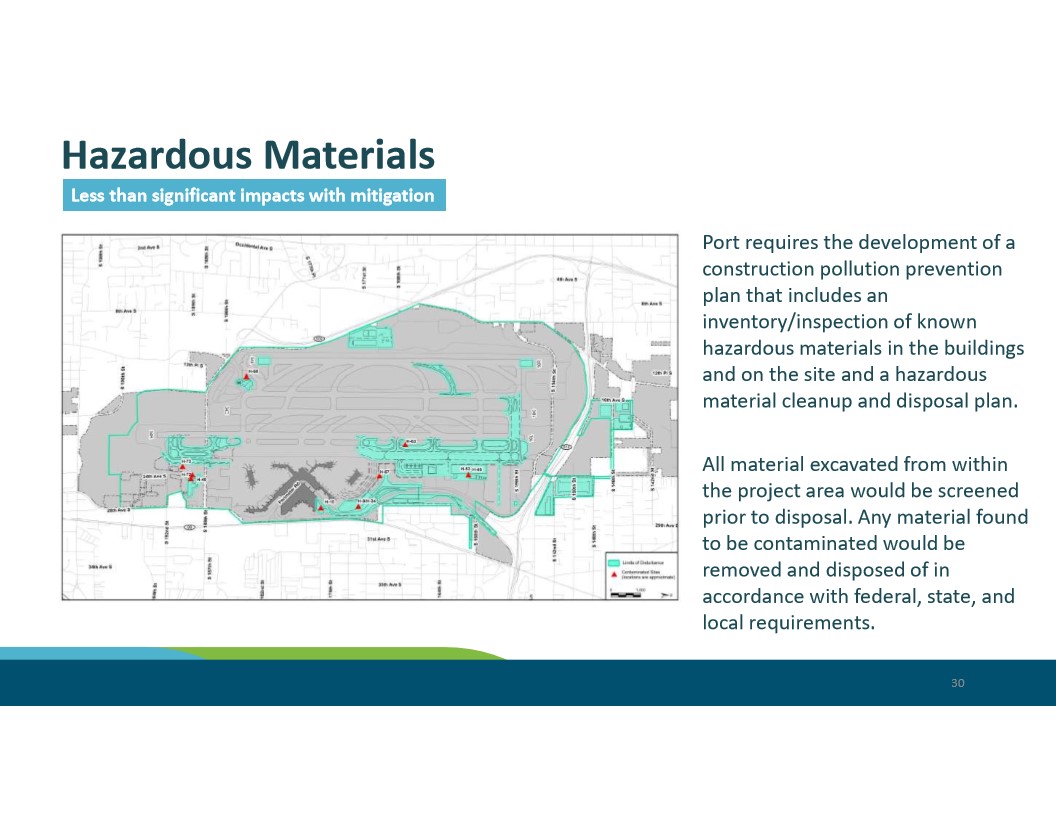
Presentation slide titled 'Hazardous Materials' classified as 'Less than significant impacts with mitigation,' describing Port requirements for a construction pollution prevention plan including inventory/inspection of known hazardous materials and a cleanup/disposal plan for the Sea-Tac Airport project area. A map shows the limits of disturbance and contaminated site locations (marked as approximate) within and around the airport footprint. -
2024_10_22_SM_Packet_Supplemental (11a SAMP EA Presentation)_34
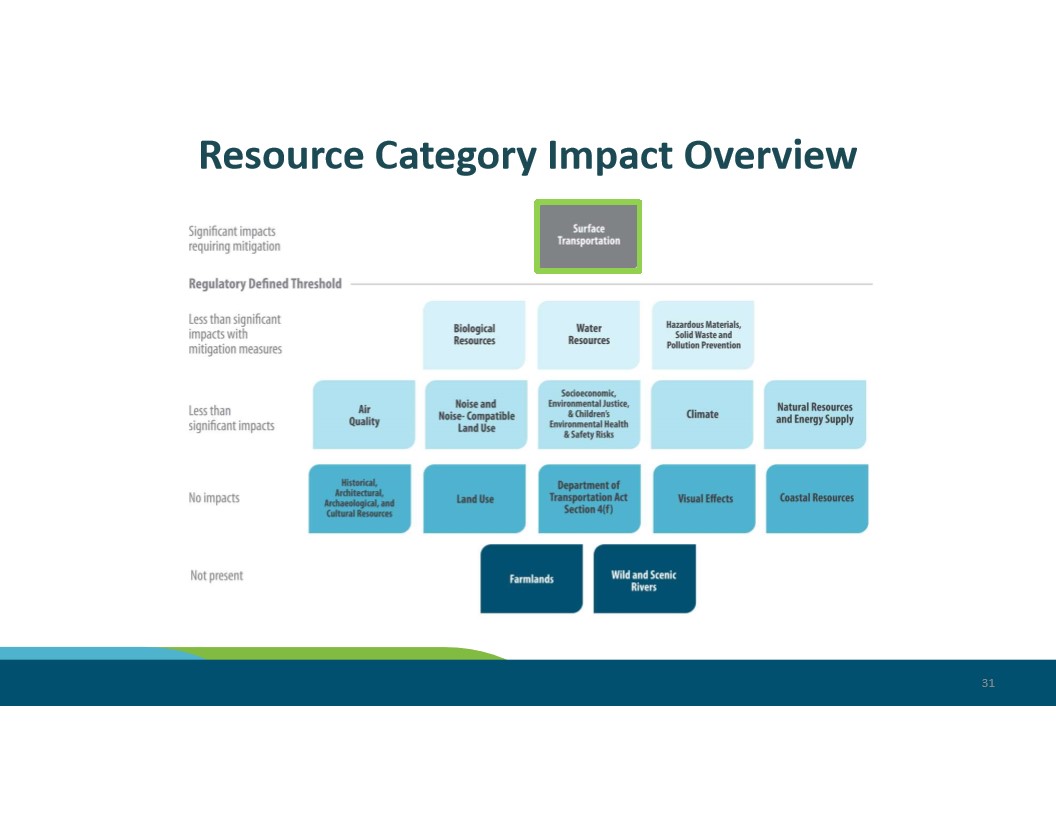
A presentation slide titled 'Resource Category Impact Overview' displaying a tiered matrix of environmental and transportation resource categories organized by impact level, ranging from 'Significant impacts requiring mitigation' (Surface Transportation) down through 'Less than significant,' 'No impacts,' and 'Not present' (Farmlands, Wild and Scenic Rivers). The slide appears to be from an environmental impact assessment or NEPA-related planning document, numbered page 31. -
2024_10_22_SM_Packet_Supplemental (11a SAMP EA Presentation)_32
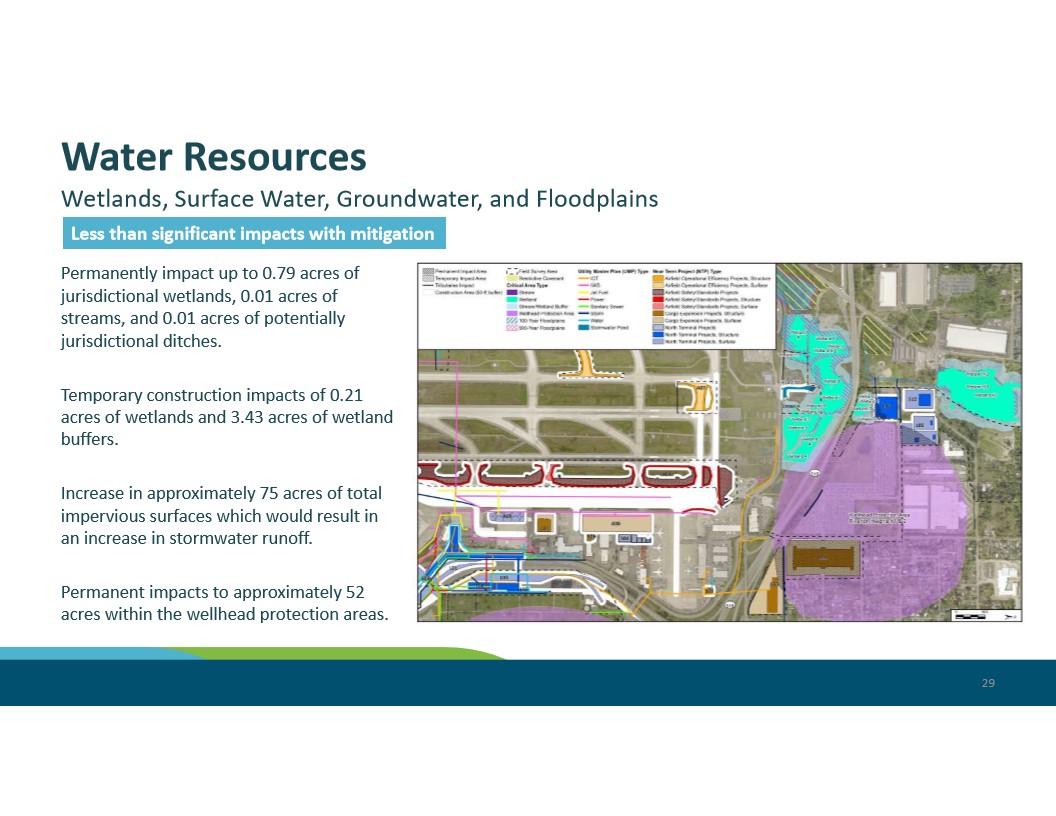
Slide 29 from what appears to be a Sea-Tac Airport Environmental Impact Statement presentation, summarizing water resource impacts including permanent impacts to 0.79 acres of jurisdictional wetlands, temporary construction impacts of 0.21 acres of wetlands and 3.43 acres of wetland buffers, an increase of approximately 75 acres of impervious surfaces, and permanent impacts to approximately 52 acres within wellhead protection areas. The overall finding is 'Less than significant impacts with mitigation.' -
2024_10_22_SM_Packet_Supplemental (11a SAMP EA Presentation)_31
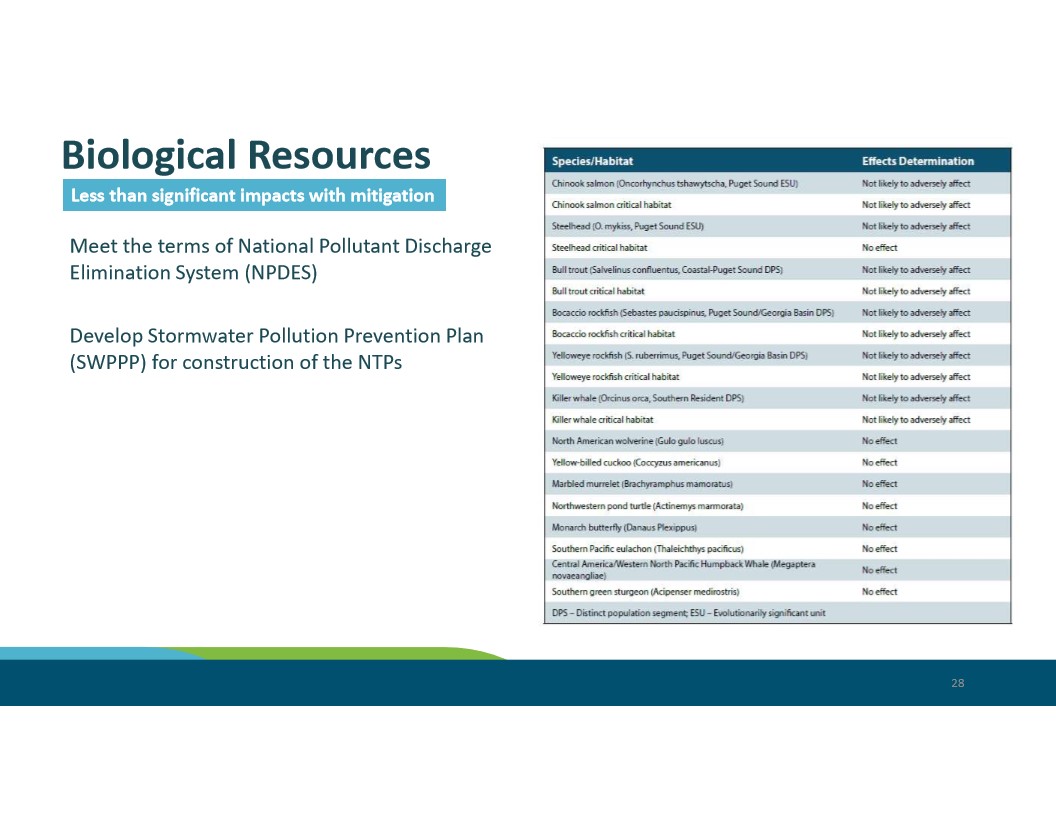
A presentation slide titled 'Biological Resources' states impacts are 'Less than significant with mitigation' and lists mitigation measures including NPDES compliance and a Stormwater Pollution Prevention Plan (SWPPP) for construction of NTPs. A table on the right lists species and habitats such as Chinook salmon, Steelhead, Bull trout, Killer whale, and Monarch butterfly with effects determinations of 'Not likely to adversely affect' or 'No effect.' -
2024_10_22_SM_Packet_Supplemental (11a SAMP EA Presentation)_30
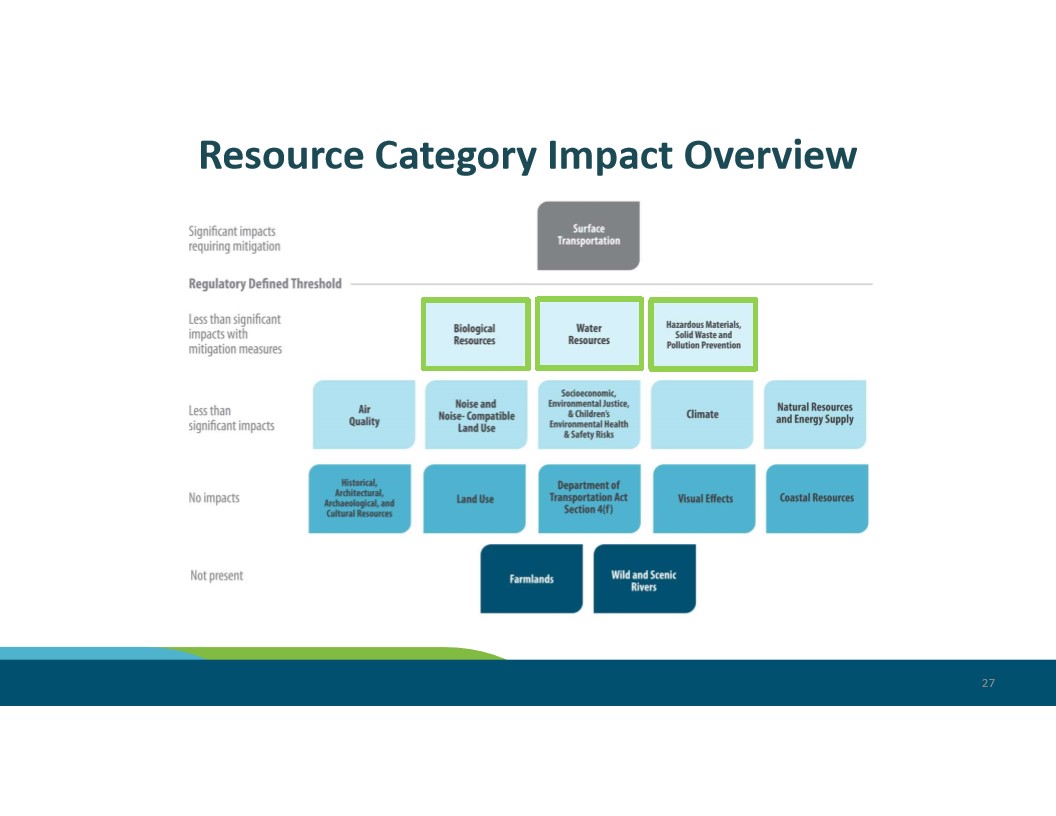
A presentation slide titled 'Resource Category Impact Overview' displaying a tiered impact classification chart. Categories range from 'Significant impacts requiring mitigation' (Surface Transportation) down through 'Less than significant impacts with mitigation measures' (Biological Resources, Water Resources, Hazardous Materials/Solid Waste/Pollution Prevention), 'Less than significant impacts,' 'No impacts,' and 'Not present' (Farmlands, Wild and Scenic Rivers). -
2024_10_22_SM_Packet_Supplemental (11a SAMP EA Presentation)_29
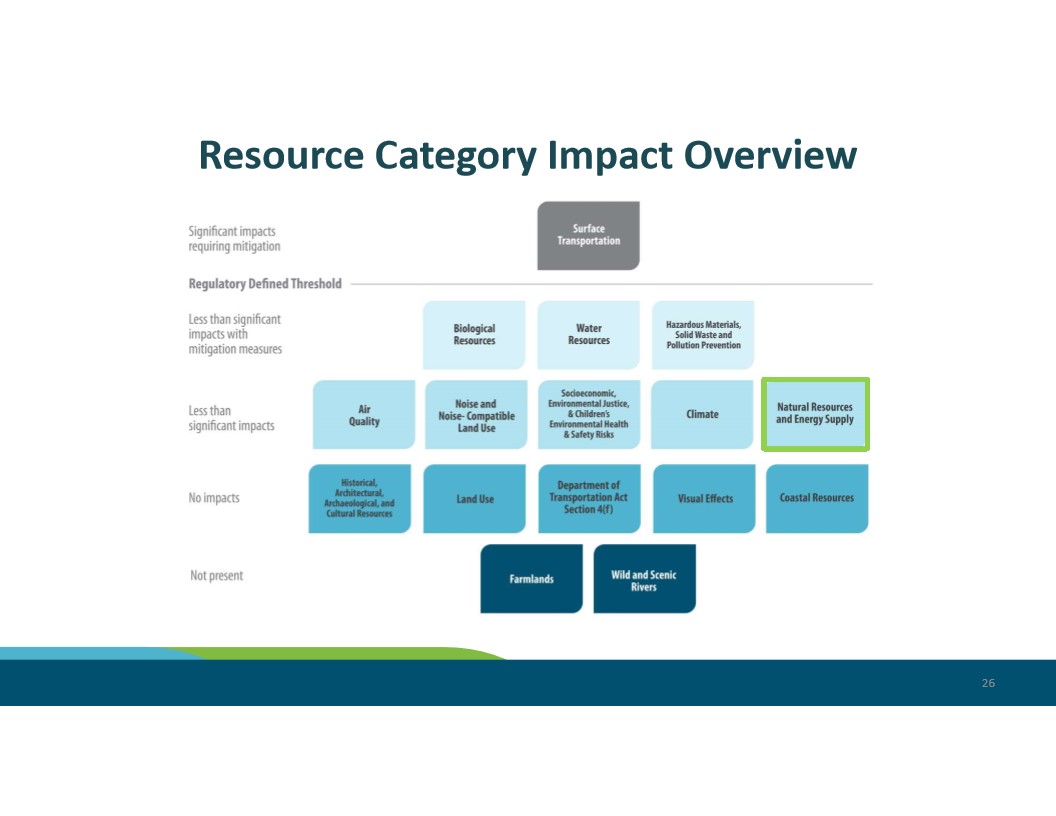
A presentation slide titled 'Resource Category Impact Overview' displaying a matrix of environmental resource categories organized by impact level, ranging from 'Significant impacts requiring mitigation' (Surface Transportation) down through 'Less than significant,' 'No impacts,' and 'Not present' categories including Biological Resources, Water Resources, Air Quality, Climate, Natural Resources and Energy Supply, and others. The slide is numbered 26 and uses a color-coded layout typical of an environmental impact assessment document.