Notes
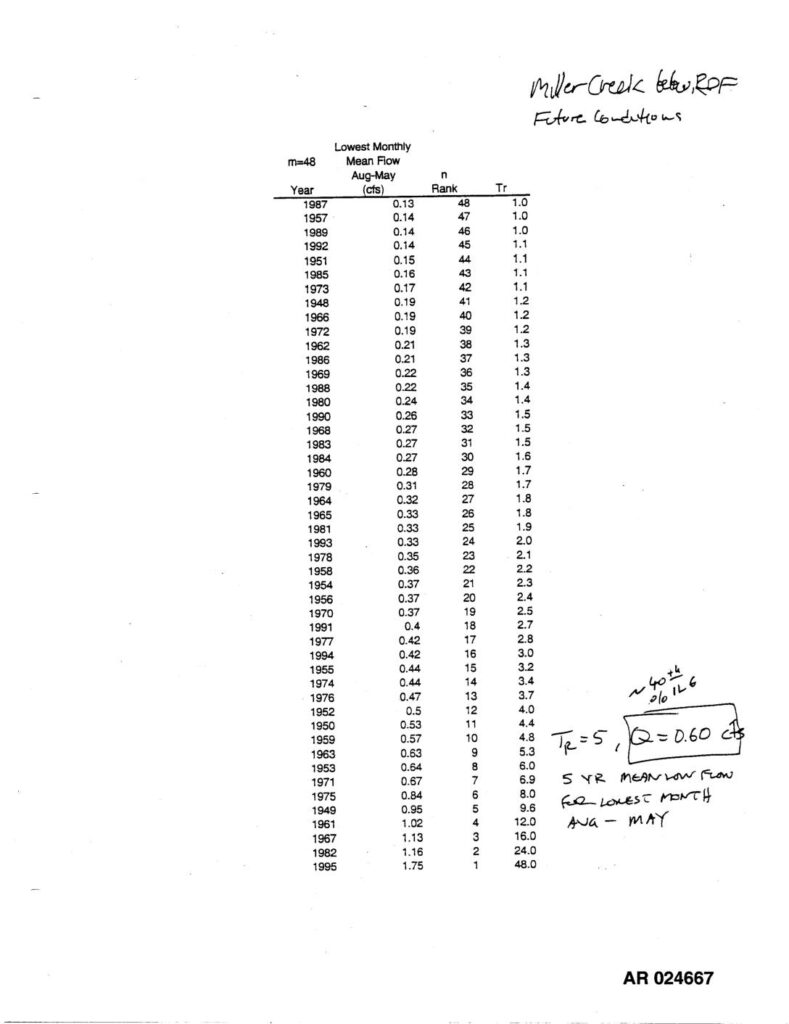
AR024667. Two-page exhibit from the Sea-Tac Airport third runway EIS administrative record concerning Miller Creek below the ROF (rate-of-flow control structure), future conditions. Page 1 presents a ranked frequency table of lowest monthly mean flow (Aug–May) for 48 years (1947–1995), with flows in cfs, rank, and return period (Tr). Handwritten annotations identify the 5-year return period mean low flow for the lowest month (Aug–May) as Q = 0.60 cfs, derived from approximately the 40th–46th percentile of record. Page 2 presents STORM-D.OUT output labeled ‘2yr/72hr Daily Flows’ for a mid-summer storm event (1996 AUG 1–5), showing total precipitation, effluent flow (dataset 30), and Miller Creek receiving flow (dataset 34), with peak receiving flow of 24.39 cfs on AUG 2. Handwritten notes calculate acute standard peak of 2yr/72hr: effluent = 3.1 cfs, receiving = 36.0 cfs; chronic standard Aug flow of 2yr/72hr: effluent = 1.1 cfs, receiving = 12.0 cfs (~96th percentile ILE, ~92nd percentile ILF). Page 3 is STORM3.OUT hourly flow data for 2yr/2hr storm, showing peak receiving flow of 31.25 cfs and effluent of 2.13 cfs at AUG 1 03:00, with 2hr precipitation = 0.5 inches.