TagFlow(21)
-
18-120 DailyFTMbyFlow_Page_04
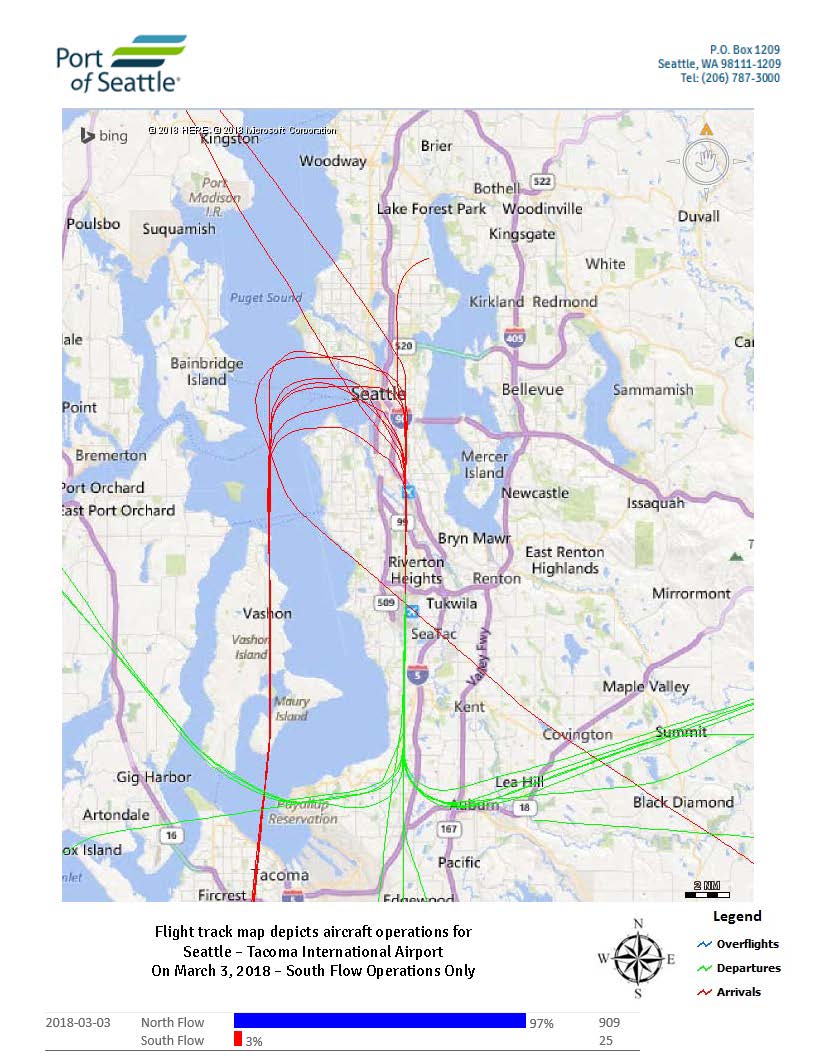
Port of Seattle flight track map depicting aircraft operations at Seattle-Tacoma International Airport on March 3, 2018, showing South Flow operations only (3%, 25 flights) alongside the dominant North Flow operations (97%, 909 flights). The map distinguishes overflights, departures (green), and arrivals (red) over the greater Seattle-Tacoma region. -
18-120 DailyFTMbyFlow_Page_01
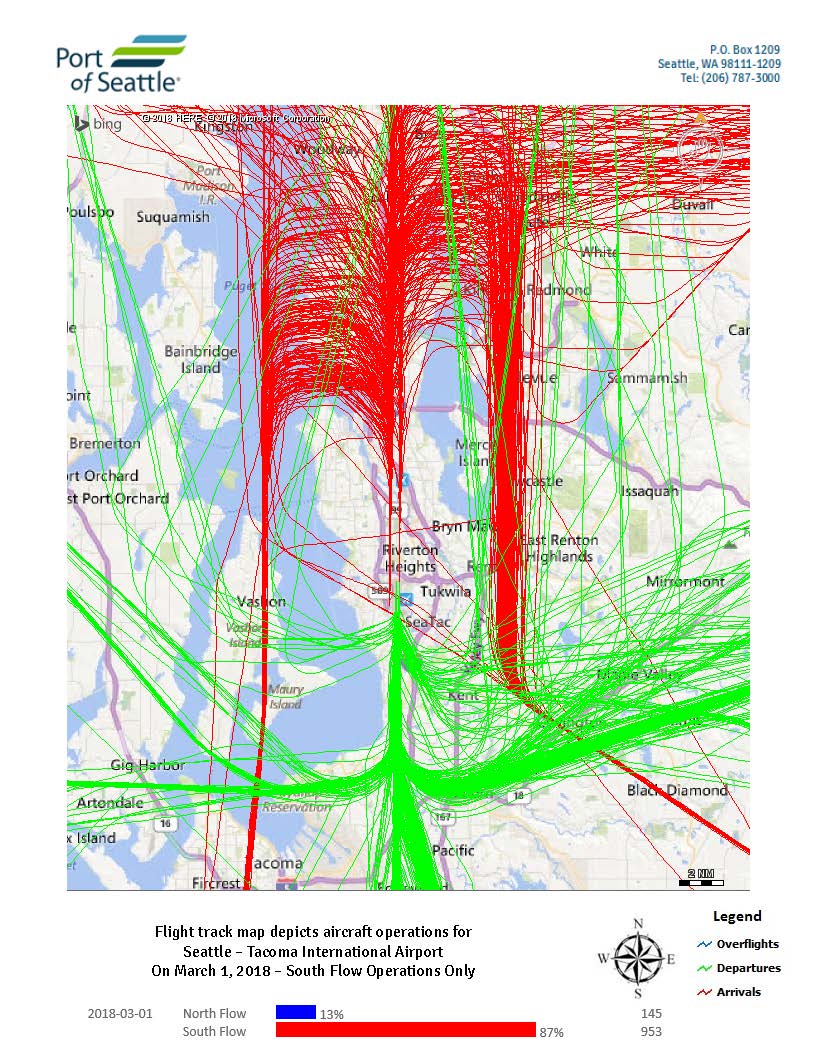
Port of Seattle flight track map showing aircraft operations at Seattle-Tacoma International Airport on March 1, 2018, during South Flow operations only. The map displays arrivals (red), departures (green), and overflights (blue) with South Flow accounting for 87% of operations (953 flights) and North Flow 13% (145 flights). -
18-120 DailyFTMbyFlow_Page_10
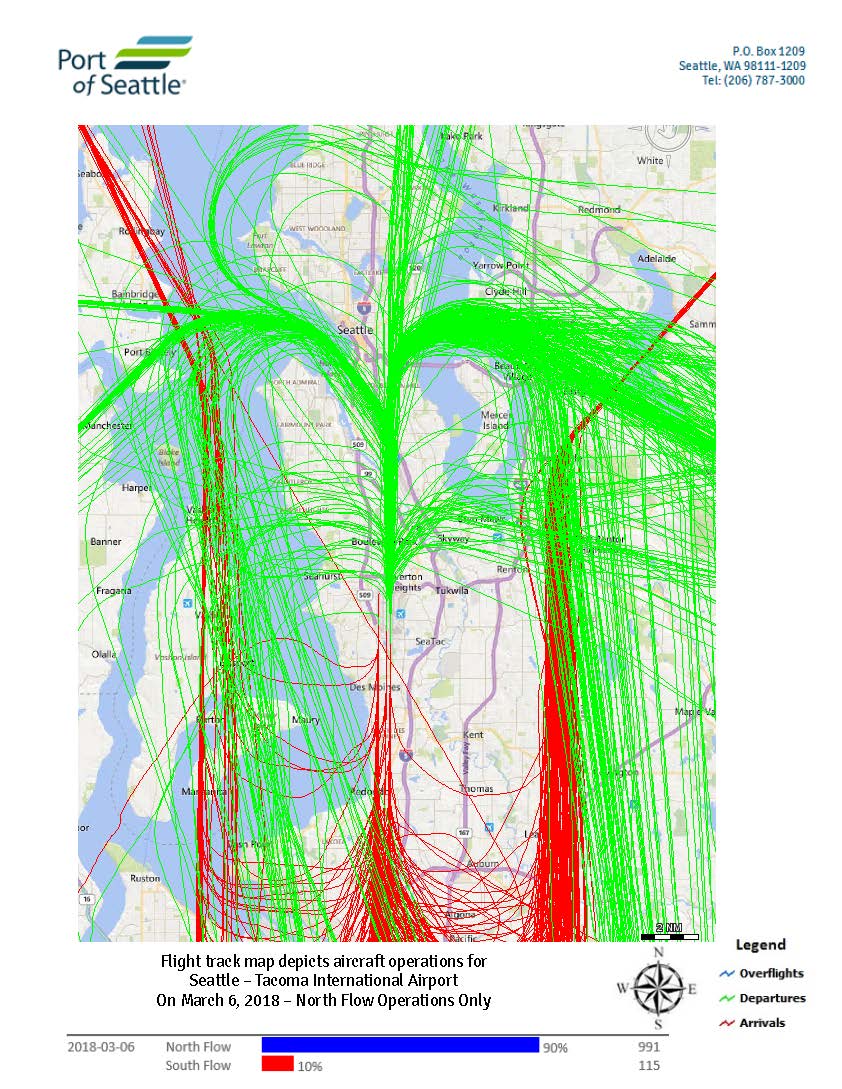
Port of Seattle flight track map depicting aircraft operations at Seattle–Tacoma International Airport on March 6, 2018, showing North Flow Operations Only. On that date, North Flow accounted for 90% of operations (991 flights) and South Flow 10% (115 flights), with departure tracks shown in green and arrival tracks in red. -
18-120 DailyFTMbyFlow_Page_09
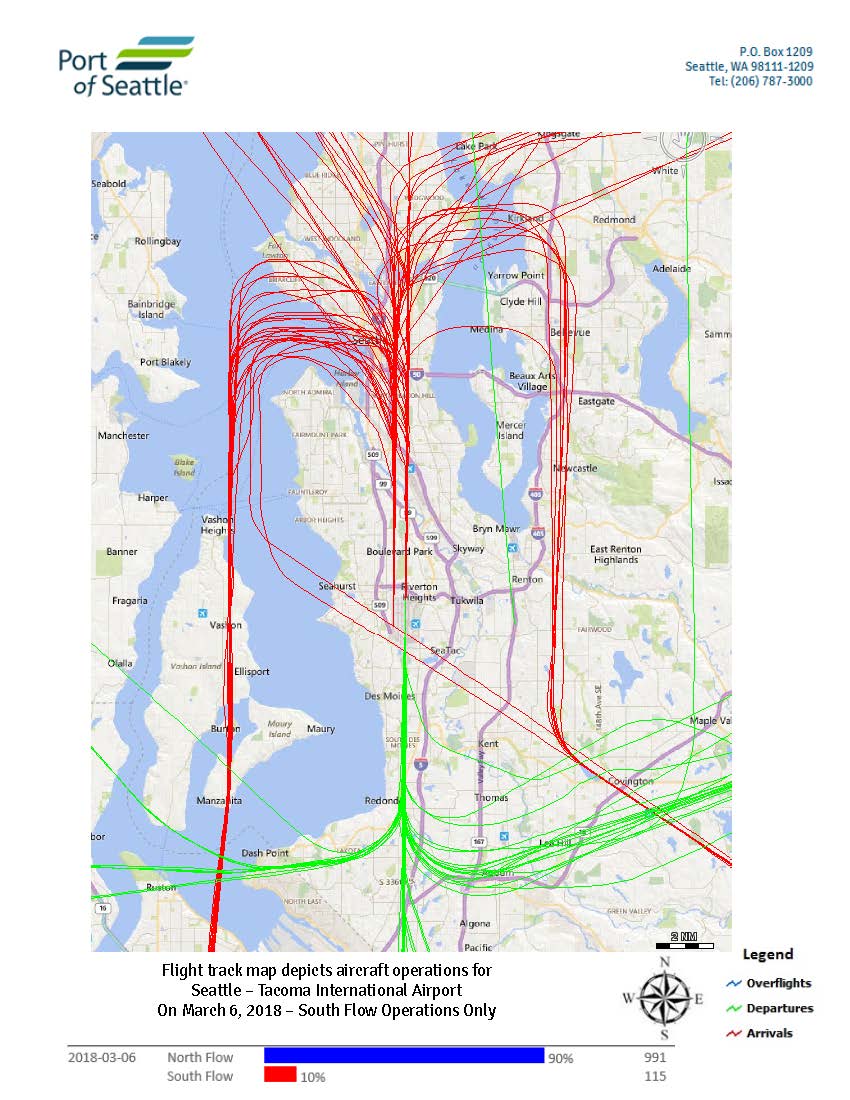
Port of Seattle flight track map depicting aircraft operations at Seattle-Tacoma International Airport on March 6, 2018, showing South Flow operations only. The map indicates arrivals (red), departures (green), and overflights (blue), with South Flow comprising 10% (115 operations) and North Flow comprising 90% (991 operations) of that day's traffic. -
18-120 DailyFTMbyFlow_Page_12
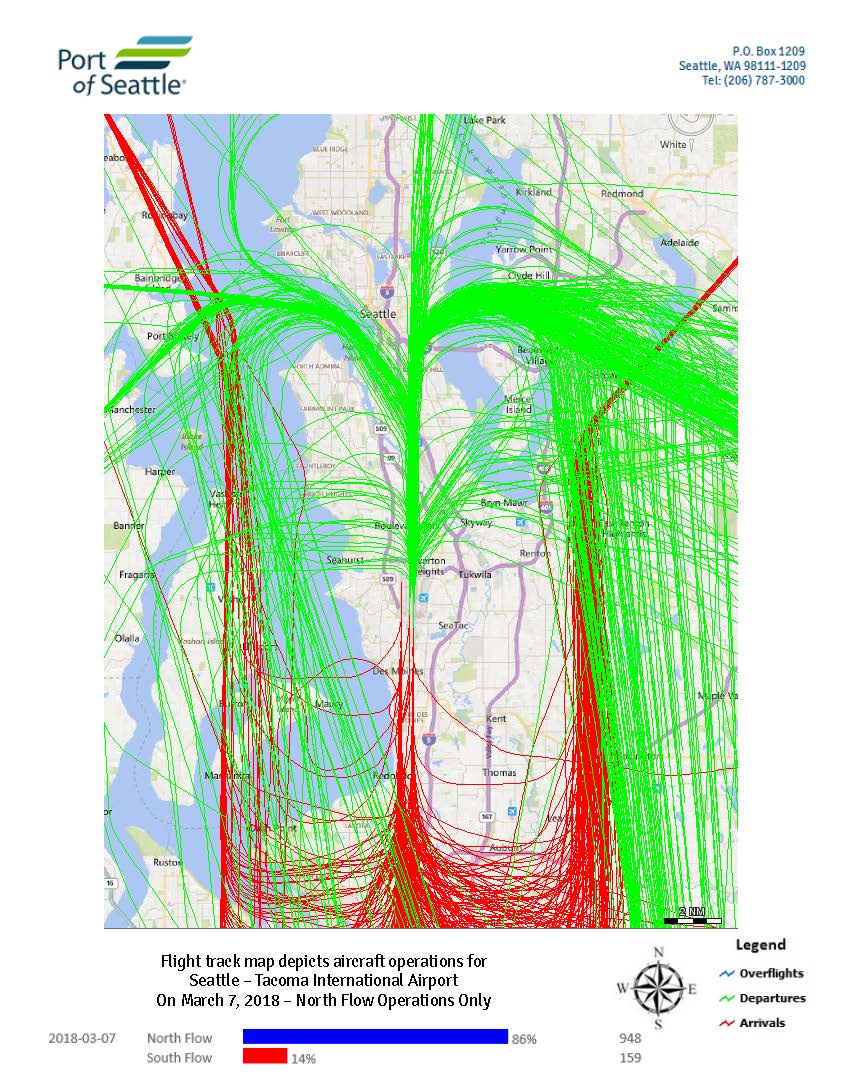
Port of Seattle flight track map depicting aircraft operations at Seattle-Tacoma International Airport on March 7, 2018, showing North Flow Operations only. Green lines indicate departures, red lines indicate arrivals, and blue lines indicate overflights; North Flow accounted for 86% of operations (948 flights) and South Flow 14% (159 flights). -
18-120 DailyFTMbyFlow_Page_11
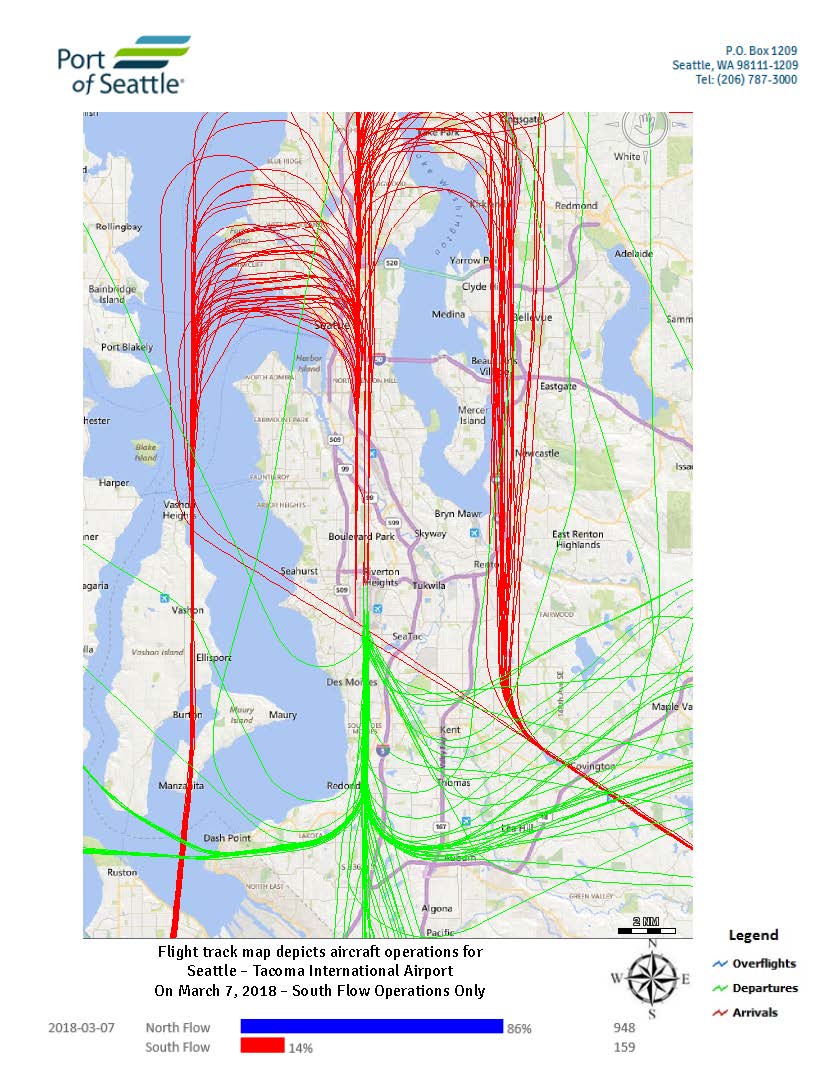
Port of Seattle flight track map depicting aircraft operations at Seattle-Tacoma International Airport on March 7, 2018, showing South Flow operations only. On that date, North Flow accounted for 86% of operations (948 flights) and South Flow 14% (159 flights), with arrival tracks shown in red, departures in green, and overflights in blue. -
Flow and Flight Tracks
A set of daily tracks from March 1 to March 18, 2018, giving a representation of North Flow and South Flow departure and arrivals. To make sense of these we suggest reading our article on runways and flow. People who complain about the flight concentration immediately notice the pattern to ‘the funnel’, ie. the points -
Runways
Intro Sea-Tac is a Category IIIb certified airfield, allowing operations in all but the worst conditions, 24/7/365. There are three runways in the modern configuration beginning in 1956: Position Year Built North End/South End Length (feet) 1 East 1961 16L 34R 11,901 2 Center 1970 16C 34C 9,426 3 West 2008 16R 34L 8,500 Runways -
 2018-03-01
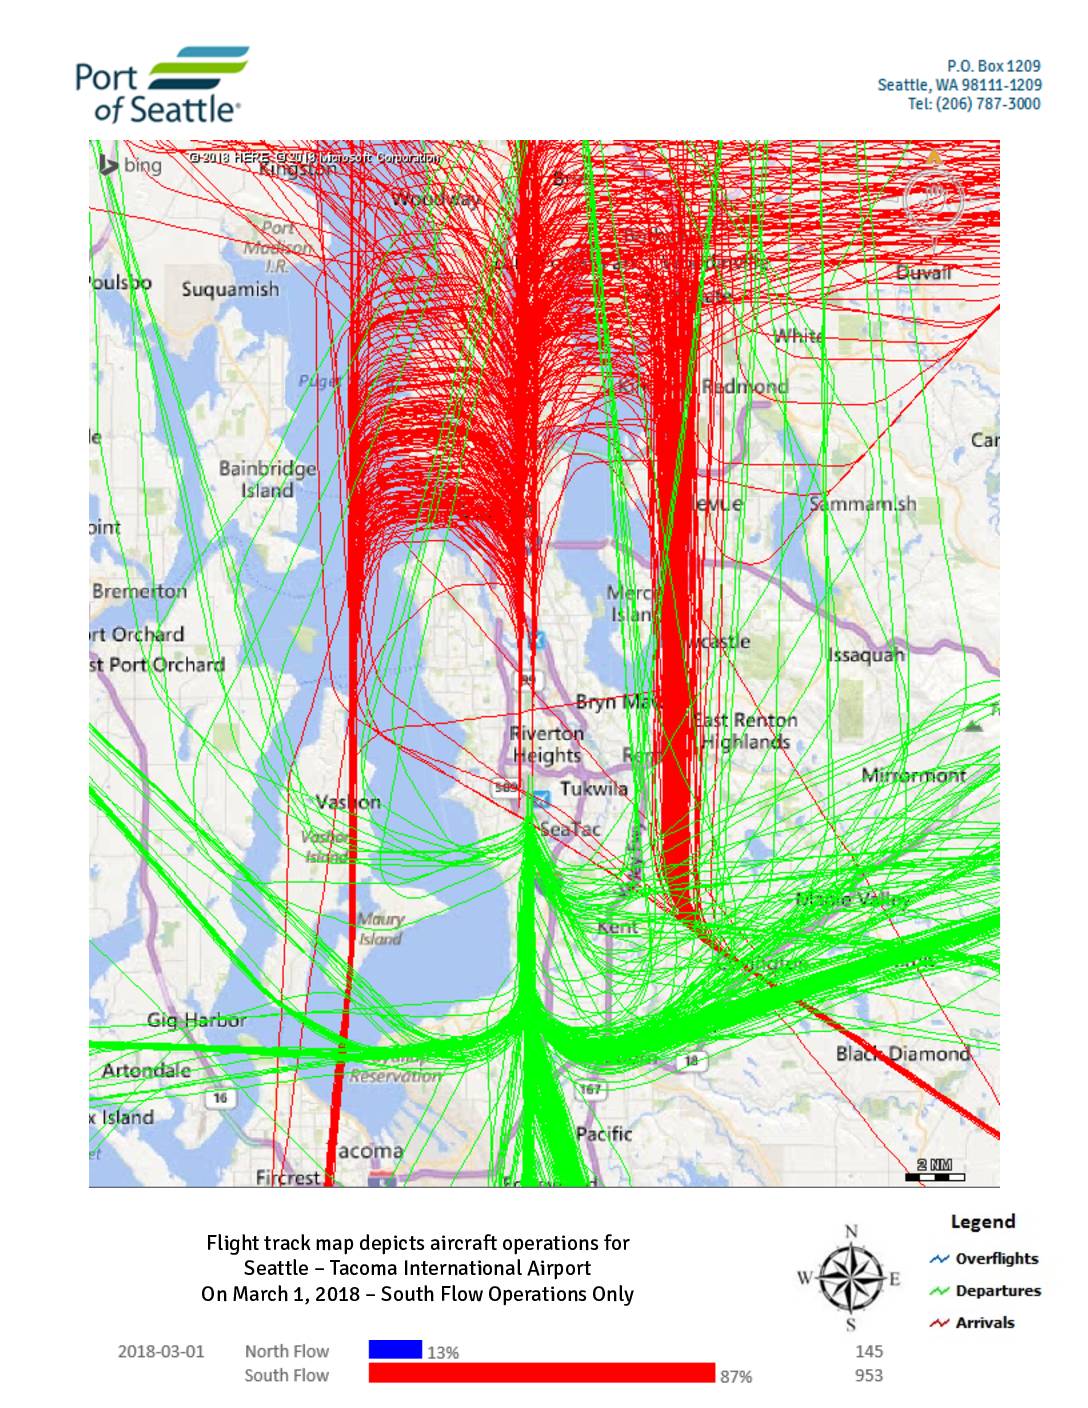
Flight track map depicts aircraft operations for Seattle – Tacoma International Airport on March 1-2, 2018
These flight track maps from the Port of Seattle show aircraft arrival, departure, and overflight paths at Seattle-Tacoma International Airport on March 1–2, 2018. On March 1, the airport operated predominantly in South Flow (87% of operations, 953 flights), with a brief period of North Flow (13%, 145 flights); on March 2, all 1,118 operations were conducted entirely in South Flow. The maps illustrate how flight corridors shift direction depending on the flow configuration, affecting which surrounding communities—such as those north of the airport near Shoreline and Mountlake Terrace versus those to the south near Auburn and Pacific—experience the greatest noise exposure. -
 2018-03-01
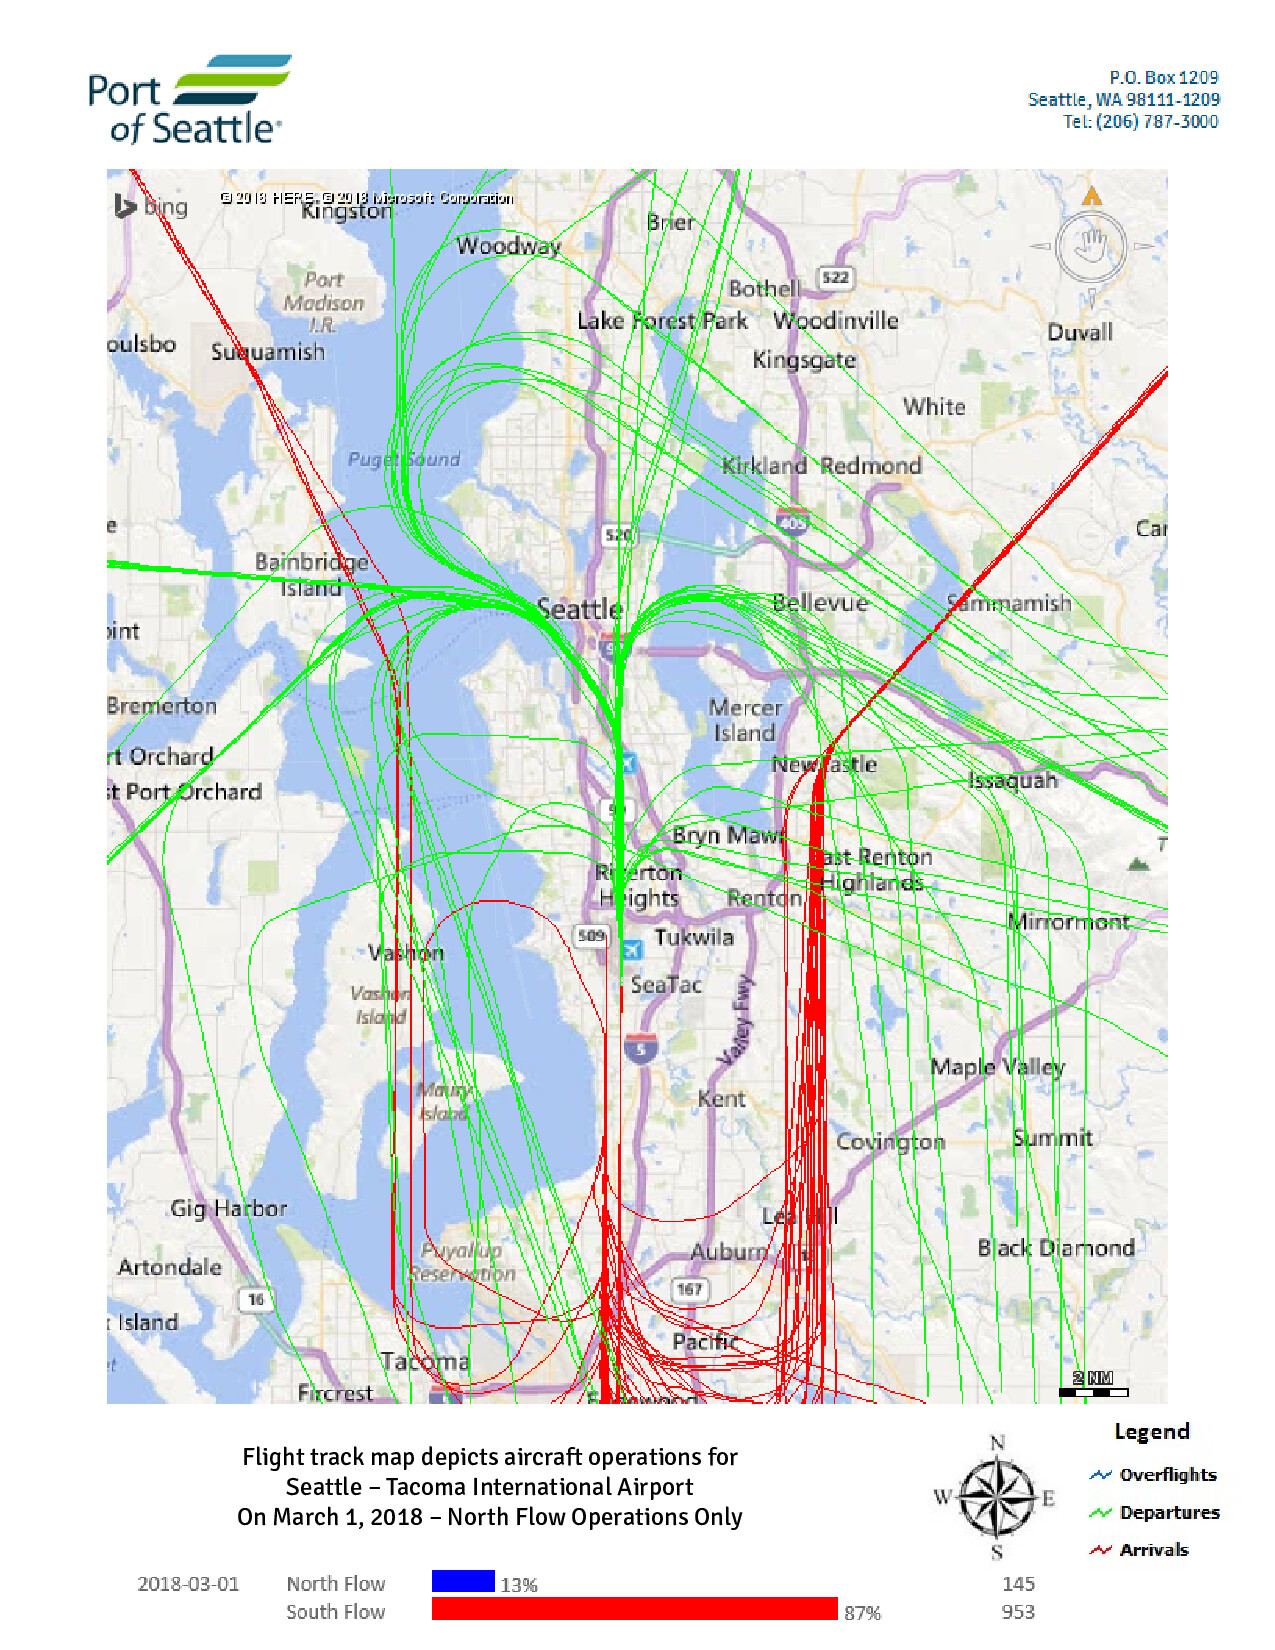
Sea-Tac Airport Daily Flight Track Map by Flow — North Flow Operations, March 1, 2018
Port of Seattle flight track map showing aircraft operations at Seattle-Tacoma International Airport on March 1, 2018, depicting North Flow operations only. The map displays overflights (blue), departures (green), and arrivals (red), with data indicating North Flow accounted for 13% of operations (145 flights) and South Flow 87% (953 flights) on that date.