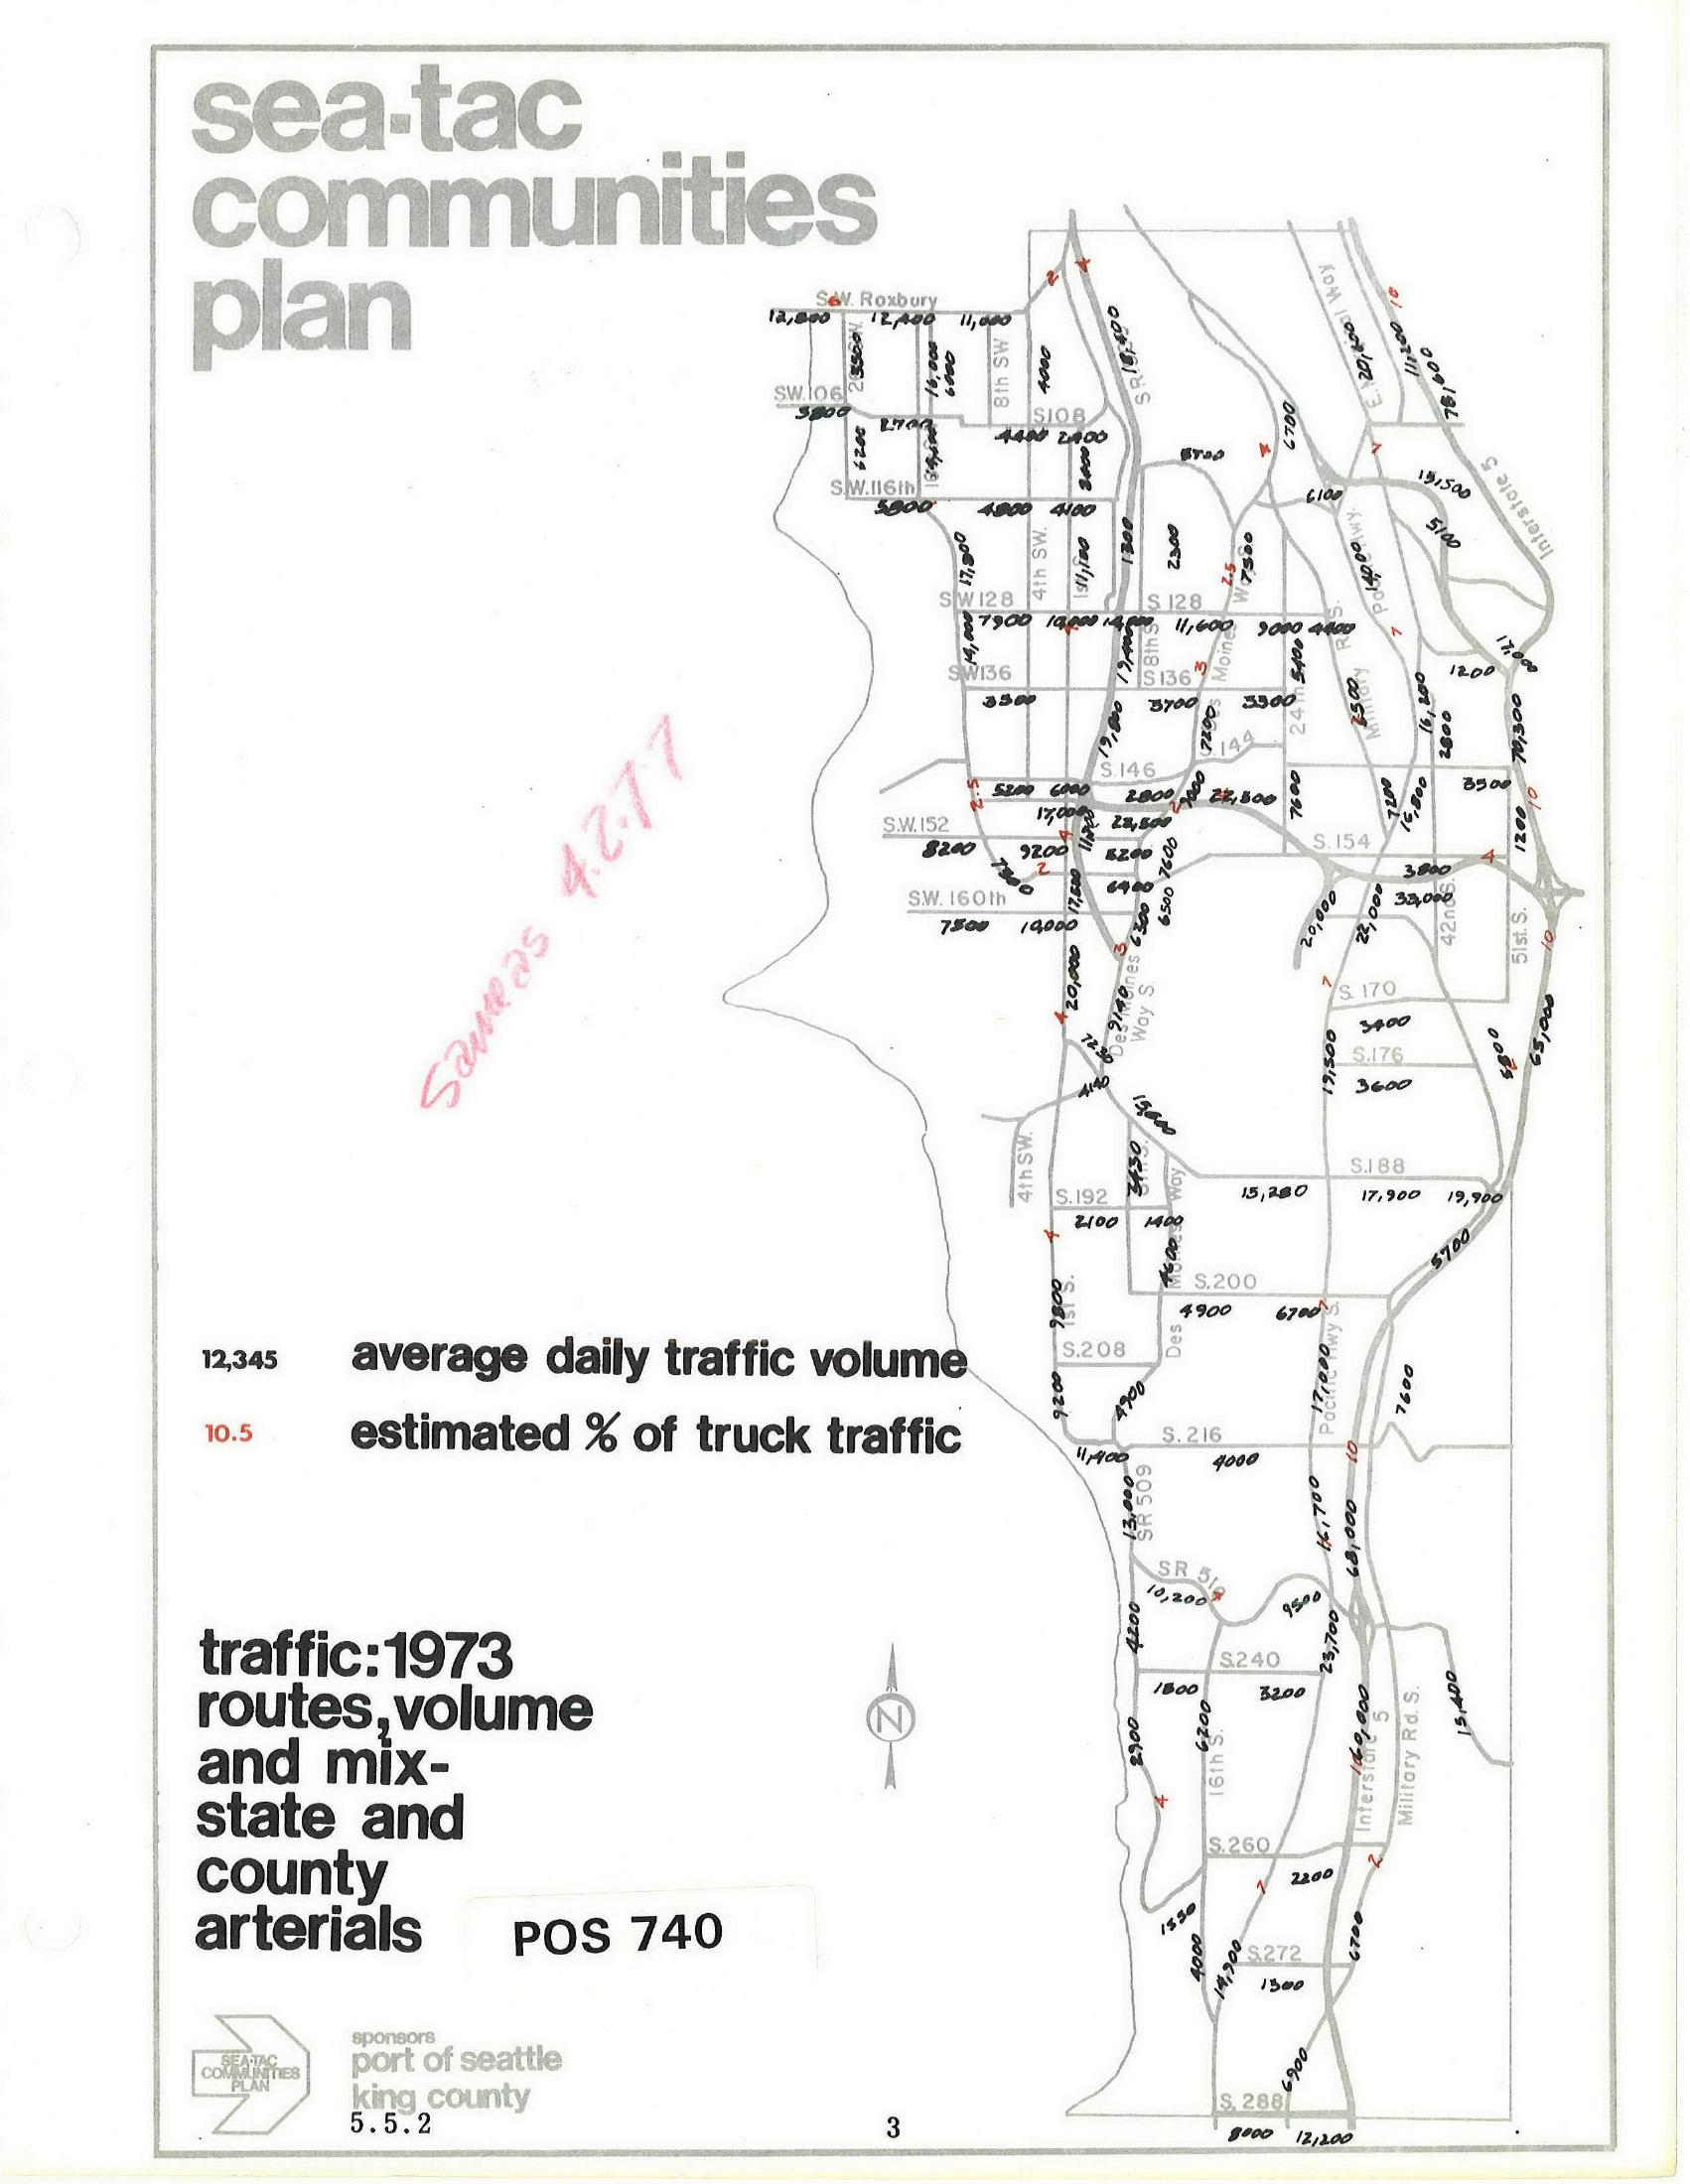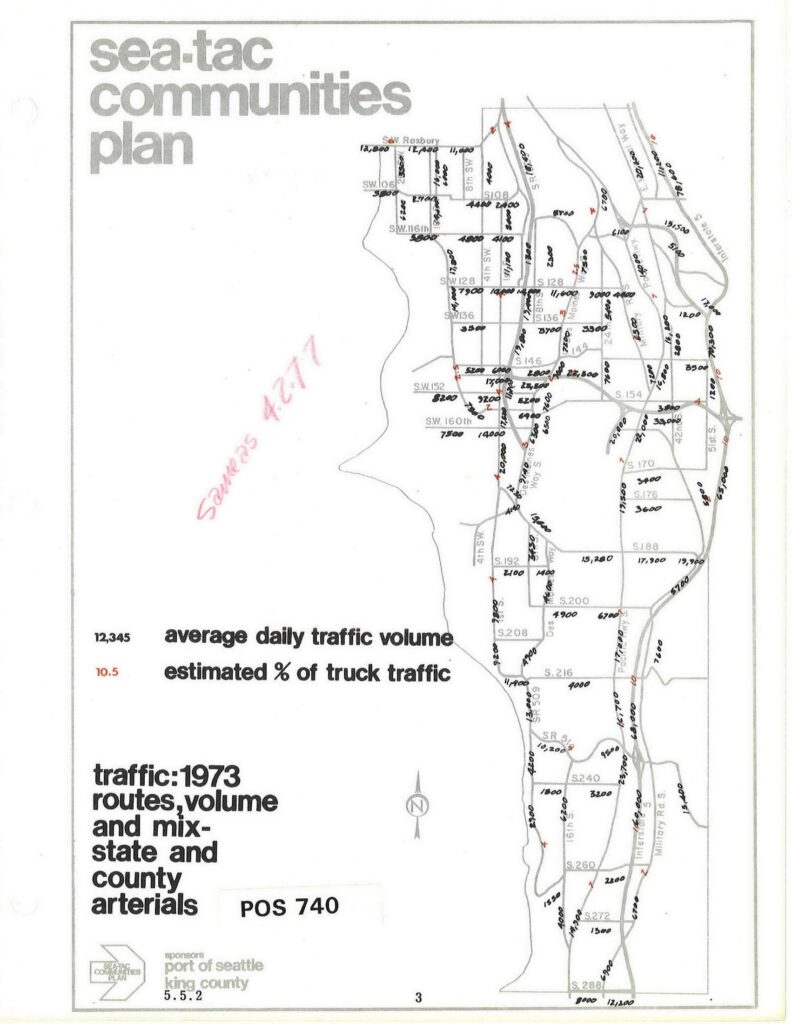
Map document from the Sea-Tac Communities Plan (document number POS 740, section 5.5.2) showing 1973 average daily traffic volumes and estimated truck traffic percentages on state and county arterials in the Sea-Tac area. Sponsored by the Port of Seattle and King County, the map displays street-level traffic counts across roads including SW 106th through S 288th, with a handwritten notation 'Savings 4,277' in red.Open full document
Notes
Map document from the Sea-Tac Communities Plan (document number POS 740, section 5.5.2) showing 1973 average daily traffic volumes and estimated truck traffic percentages on state and county arterials in the Sea-Tac area. Sponsored by the Port of Seattle and King County, the map displays street-level traffic counts across roads including SW 106th through S 288th, with a handwritten notation ‘Savings 4,277’ in red.