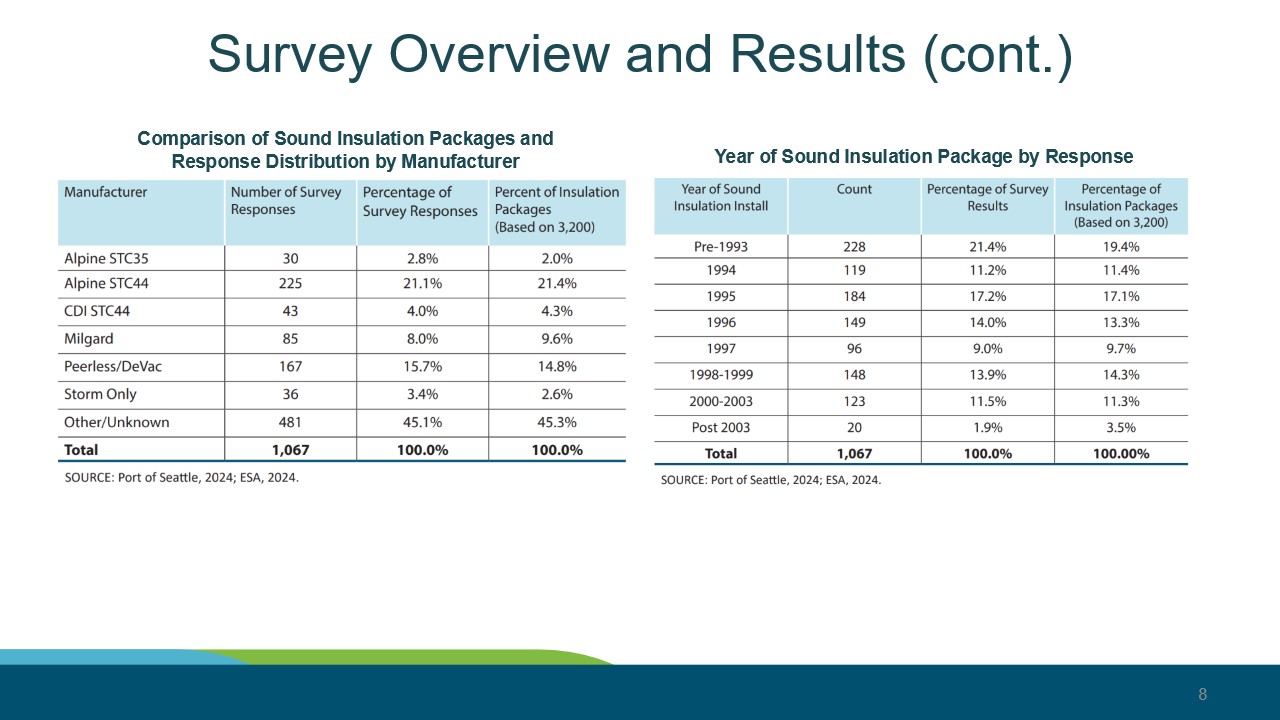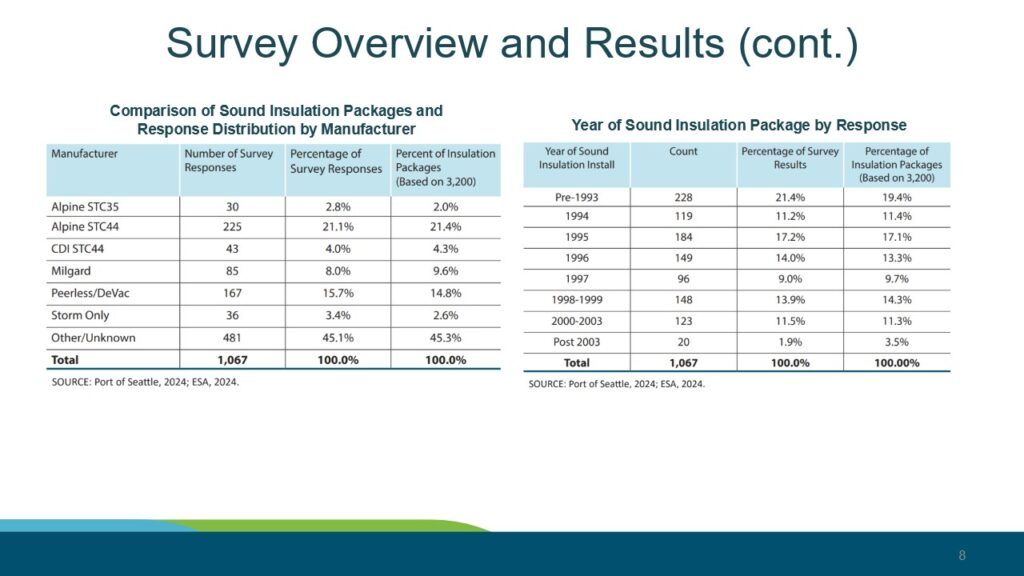
Slide 8 from a Port of Seattle / ESA 2024 report presents two tables summarizing 1,067 survey responses about sound insulation packages installed at Sea-Tac Airport. The left table compares response distribution by manufacturer (e.g., Alpine STC44 leading at 21.1%), while the right table breaks down installations by year, with Pre-1993 representing the largest share at 21.4% of survey responses, out of a total program baseline of 3,200 packages.Open full document
Notes
Slide 8 from a Port of Seattle / ESA 2024 report presents two tables summarizing 1,067 survey responses about sound insulation packages installed at Sea-Tac Airport. The left table compares response distribution by manufacturer (e.g., Alpine STC44 leading at 21.1%), while the right table breaks down installations by year, with Pre-1993 representing the largest share at 21.4% of survey responses, out of a total program baseline of 3,200 packages.