Notes
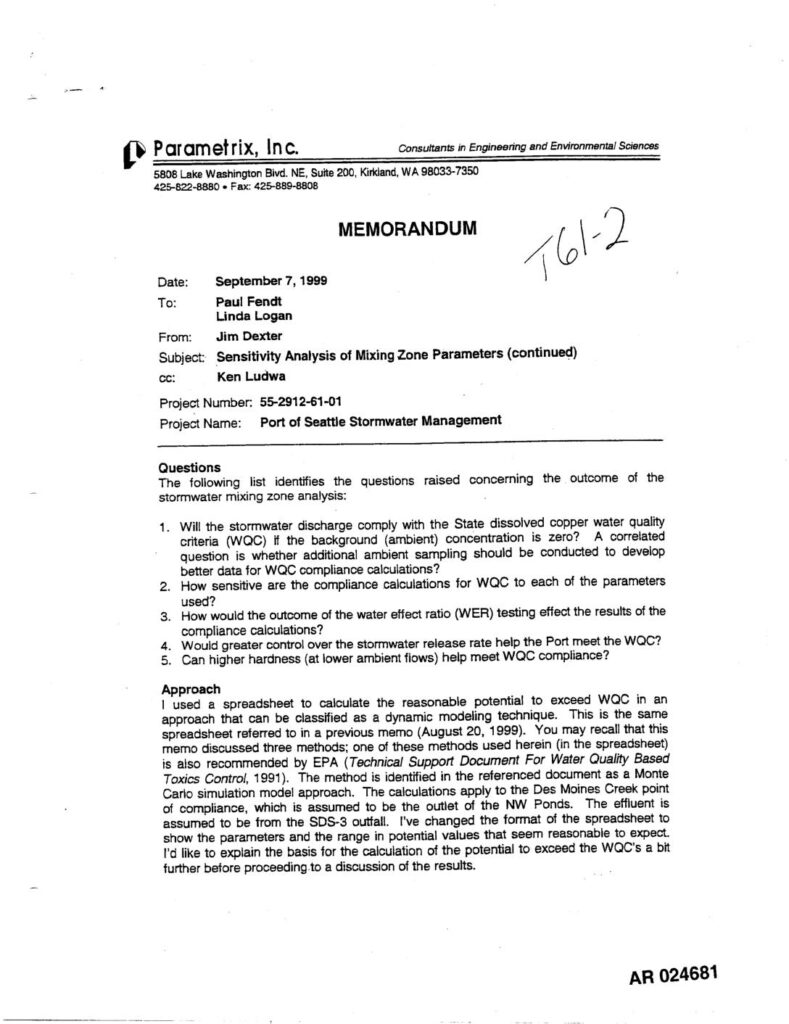
Memorandum dated September 7, 1999 from Jim Dexter of Parametrix, Inc. to Paul Fendt and Linda Logan (cc: Ken Ludwa), Project No. 55-2912-61-01, Port of Seattle Stormwater Management. Analyzes sensitivity of mixing zone parameters for dissolved copper water quality criteria (WQC) compliance at Des Moines Creek point of compliance (NW Ponds outlet), using SDS-3 outfall effluent. Uses Monte Carlo simulation (@RISK spreadsheet) and TOPRANK sensitivity analysis per EPA Technical Support Document For Water Quality Based Toxics Control (1991). Addresses five questions: ambient copper concentration effect on WQC compliance, sensitivity of WQC calculations to parameters, water effect ratio (WER) testing outcomes, stormwater release rate control, and hardness effects. Key parameters analyzed include ambient receiving water flow, effluent stormwater flow, ambient and effluent pollutant concentrations, dissolved copper WQC, allowable mixing volume (vol_factor), WER (range 1–6), and onsite detention/flow control (0–10 cfs). TOPRANK results rank WER (#1), vol_factor (#2), and onsite detention (#3) by sensitivity. Expected WQC exceedence values range from approximately -2.691 to 18.354 µg/L depending on inputs; copper WQC baseline calculated at 4.21 µg/L. HSPF model output used for flow probability distributions.