I understand that you will never share my information with anyone, you will only use it to keep me updated on relevant events and that I may unsubscribe at any time.
Since 2016, working to obtain justice for everyone living under the flight path.
Less Noise. Cleaner Air. Better Public Health. Compensation.
Everything you think you know about the airport is wrong.
The Cost/Benefit Analysis
Beyond the usual suspects in the SAMP Draft EA Comment Period
During the Sustainable Airport Master Plan Draft EA Comment Period (SAMP) we know most people will focus on the noise and pollution. However, we also hope that readers, and especially cities, will focus on other areas which may prove just as useful in obtaining long term solutions.
Socioeconomics, Environmental Justice and Childrens Health
After a few pages acknowledging the challenges of our communities, the majority consists of a 2018 Economic Impacts Study the Port did for all airport cities.
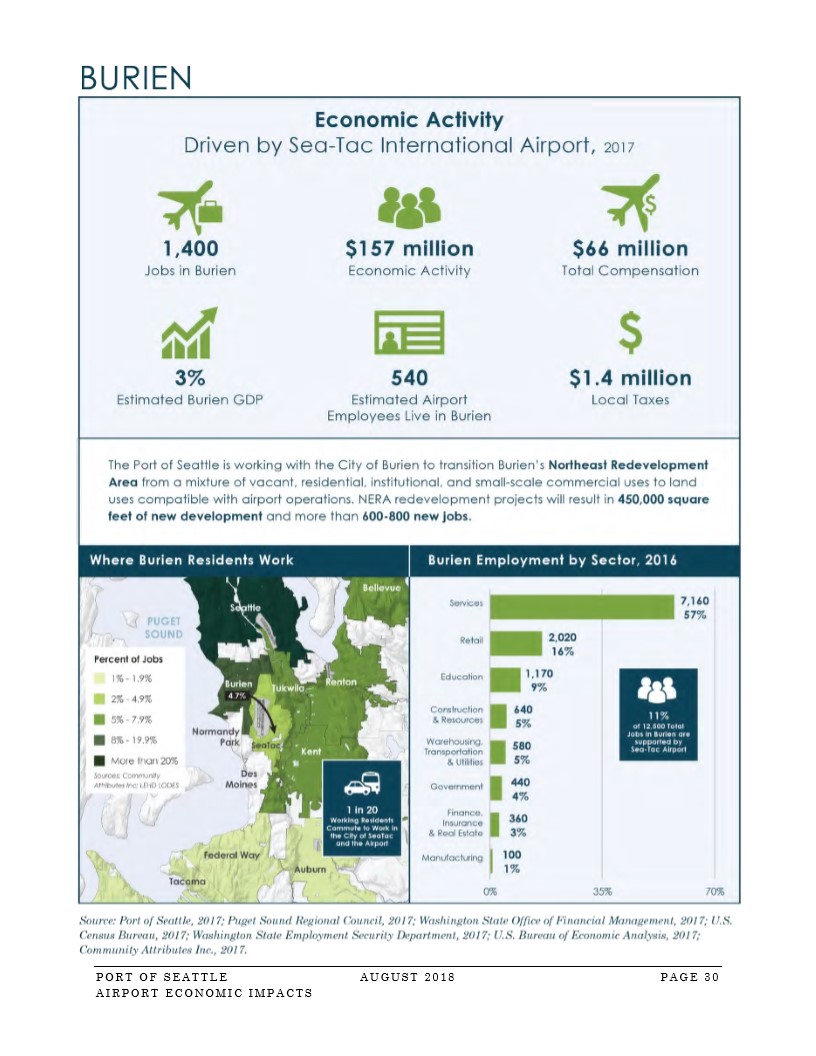
This infographic from the Port of Seattle’s August 2018 Airport Economic Impacts report (Page 30) details Burien’s airport-driven economic activity for 2017, including 1,400 jobs, $157 million in economic activity, $66 million in total compensation, and $1.4 million in local taxes. It also includes a map of where Burien residents work and a bar chart of Burien employment by sector for 2016, noting that 11% of 12,800 total jobs in Burien are supported by Sea-Tac Airport.
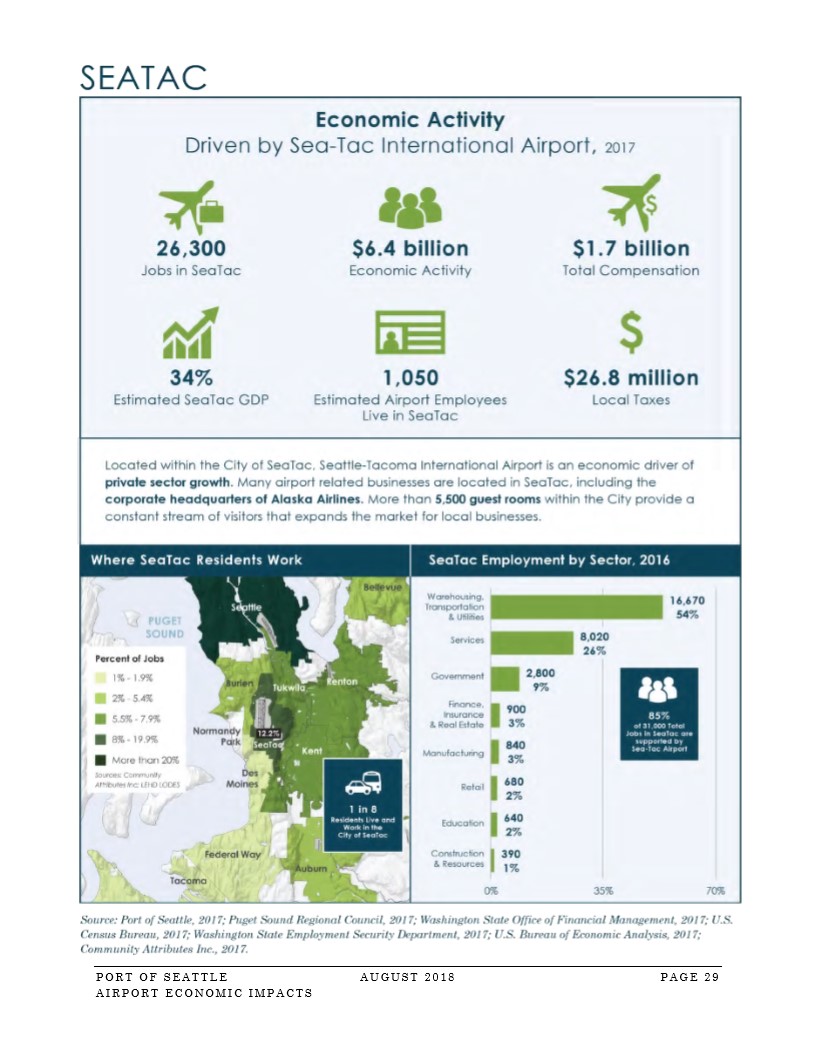
This infographic from the Port of Seattle’s August 2018 Airport Economic Impacts report details the economic activity driven by Seattle-Tacoma International Airport in 2017, including 26,300 jobs, $6.4 billion in economic activity, $1.7 billion in total compensation, and $26.8 million in local taxes. It also includes a map of where SeaTac residents work and a bar chart showing SeaTac employment by sector for 2016, noting that 85% of the 31,000 total jobs in SeaTac are supported by Sea-Tac Airport.
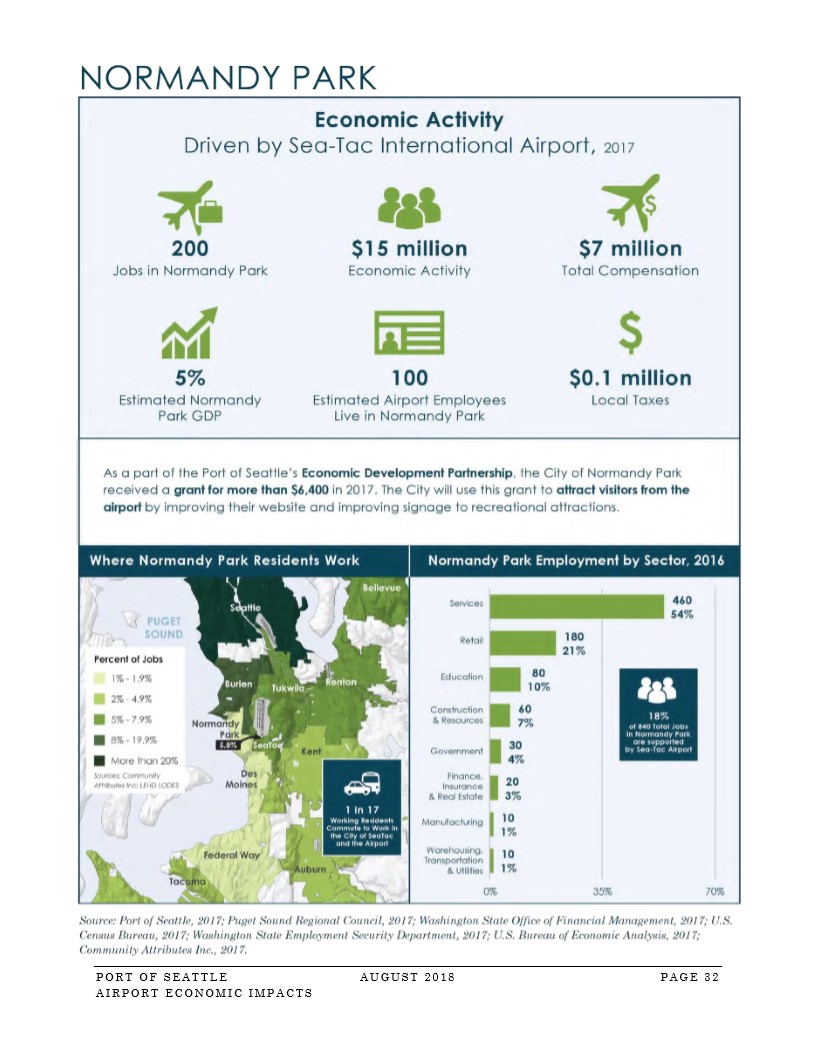
Port of Seattle infographic (August 2018, Page 32) showing Normandy Park’s airport-driven economic activity for 2017, including 200 jobs, $15 million in economic activity, $7 million total compensation, 5% estimated GDP contribution, 100 airport employees living in Normandy Park, and $0.1 million in local taxes. Includes maps and charts showing where Normandy Park residents work and employment by sector, noting 18% of 840 total local jobs are supported by Sea-Tac Airport.
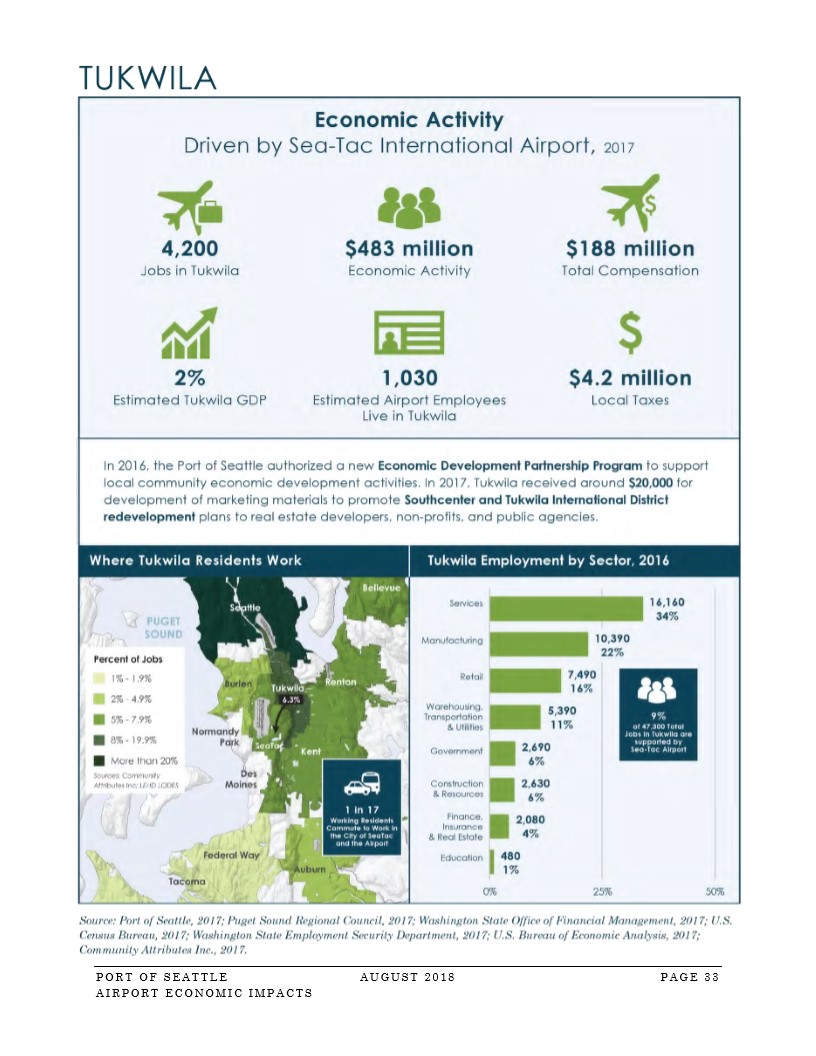
This infographic from the Port of Seattle’s August 2018 Airport Economic Impacts report (Page 33) details Sea-Tac Airport’s economic contributions to Tukwila in 2017, including 4,200 jobs, $483 million in economic activity, $188 million in total compensation, and $4.2 million in local taxes. It also includes a map of where Tukwila residents work and a bar chart of Tukwila employment by sector for 2016, noting that 9% of 47,300 total jobs in Tukwila are supported by Sea-Tac Airport.
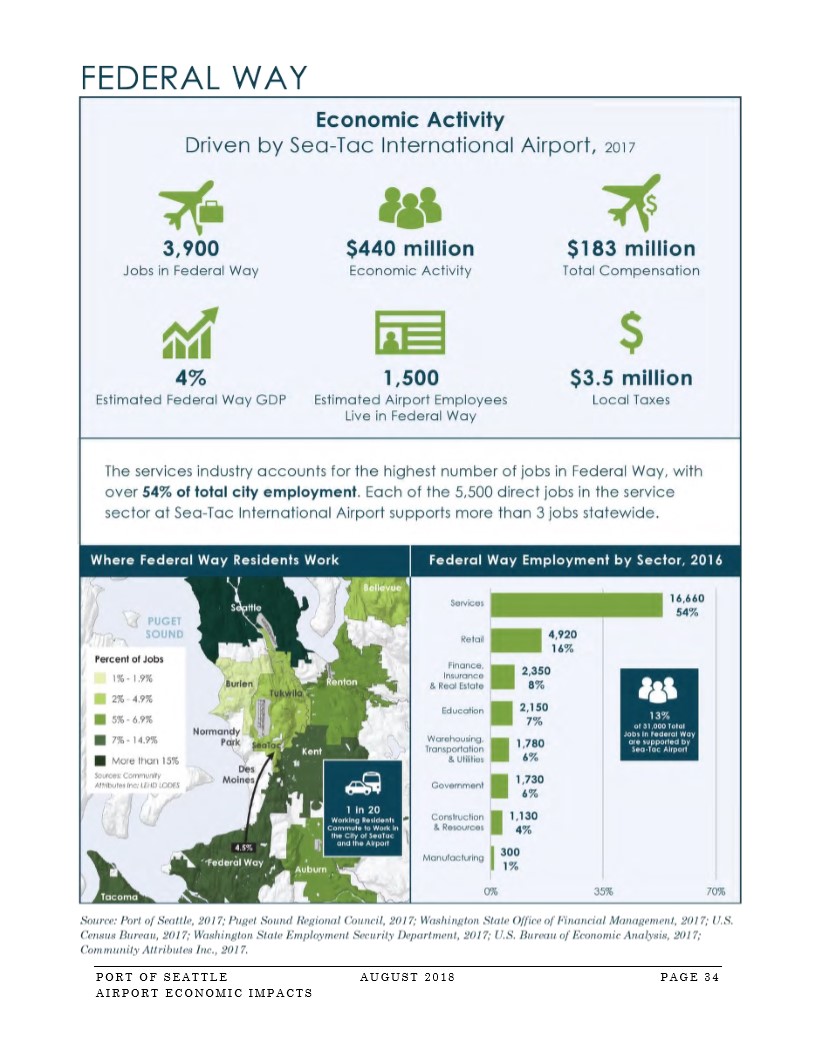
Port of Seattle infographic (August 2018, page 34) summarizing Sea-Tac Airport’s economic impact on Federal Way, Washington, including 3,900 jobs, $440 million in economic activity, $183 million in total compensation, and a breakdown of Federal Way employment by sector showing services at 54% (16,660 jobs). The document notes that 13% of Federal Way’s total jobs are supported by Sea-Tac Airport.
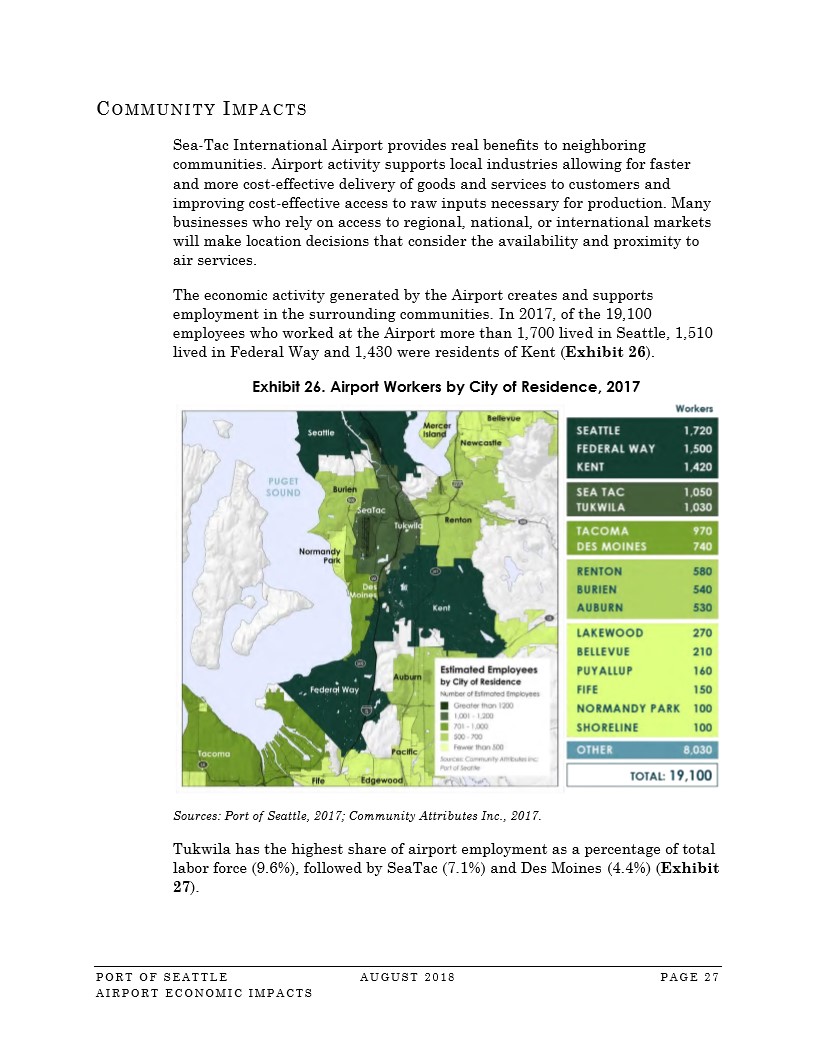
Page 27 of the Port of Seattle Airport Economic Impacts report (August 2018) details community impacts of Sea-Tac International Airport, including Exhibit 26, a map and table showing airport workers by city of residence in 2017, with Seattle (1,720), Federal Way (1,500), and Kent (1,420) as the top three cities among the 19,100 total employees. The section notes Tukwila had the highest share of airport employment as a percentage of total labor force at 9.6%.
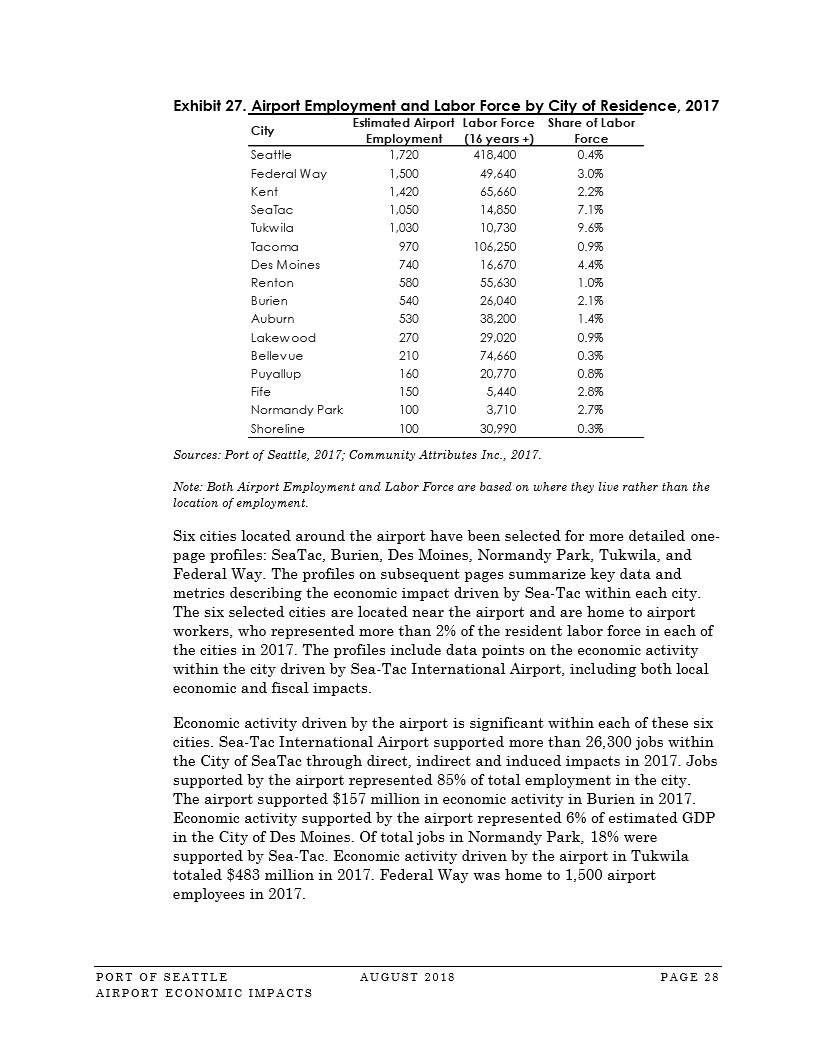
Page 28 of the Port of Seattle Airport Economic Impacts report (August 2018), presenting Exhibit 27, a table showing estimated airport employment, labor force size, and share of labor force for 17 cities in the Seattle metro area in 2017. The accompanying text highlights six cities selected for detailed profiles—SeaTac, Burien, Des Moines, Normandy Park, Tukwila, and Federal Way—where airport workers represented more than 2% of the resident labor force.
Appendix K is especially important, because unlike various environmental impacts, which can be very difficult to refute without expensive specialist analysis, cities know their economies and finances better than anyone else. A core argument of the Port of Seattle has always been that the economic benefits of the airport, not merely for King County, but down to individual neighborhoods under the flight path, swamps any of the negative externalities.
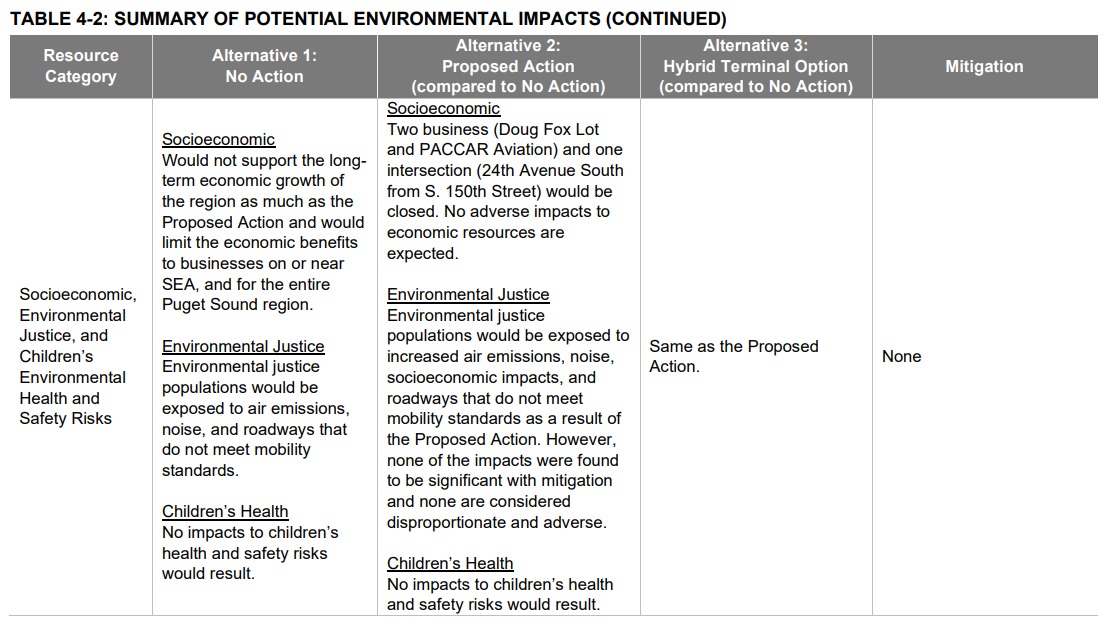
Chapter 4, Environmental Consequences, Table 4:2.
We question all of their numbers, especially for Des Moines and Burien. We also note that this data is taken from 2018. Given the reality of post-COVID South King County, this likely does not reflect the current state of our local economies. In fact, only the Port of Seattle is in a healthy place economically.
The 900 lb. APE
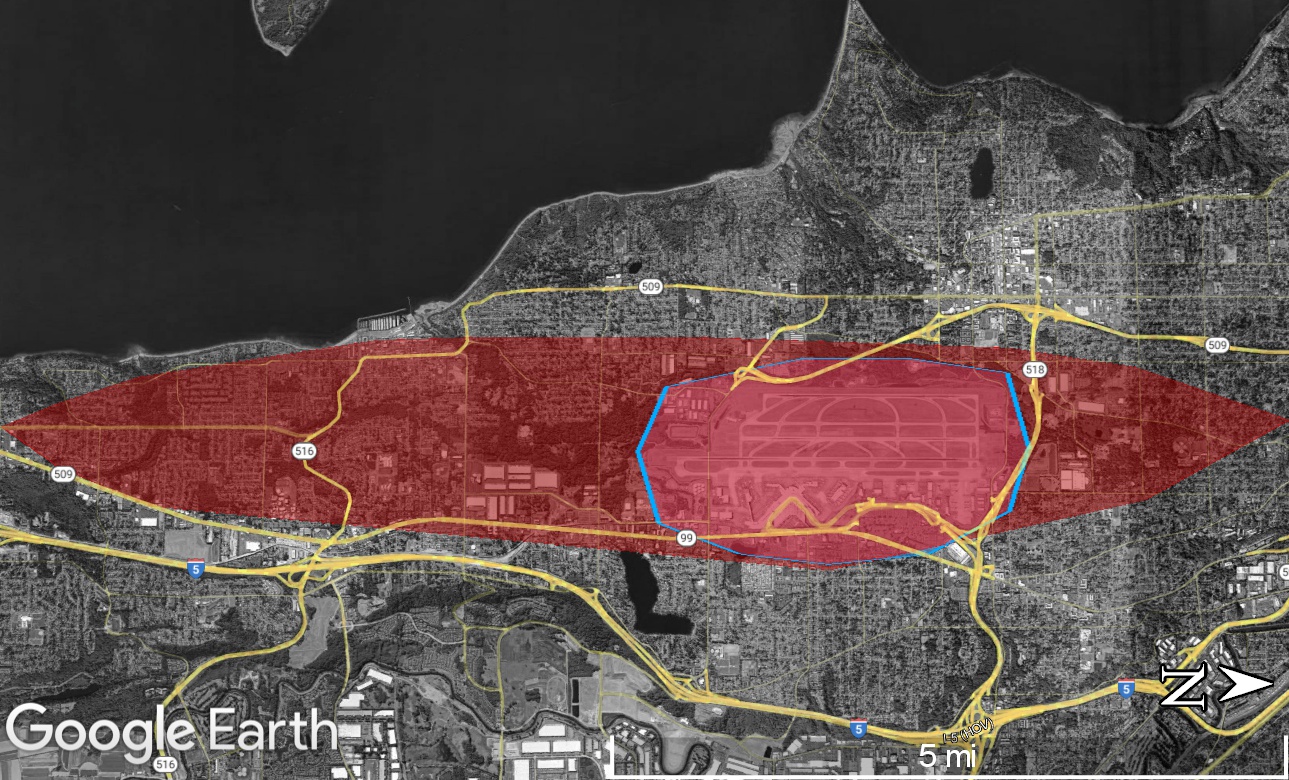
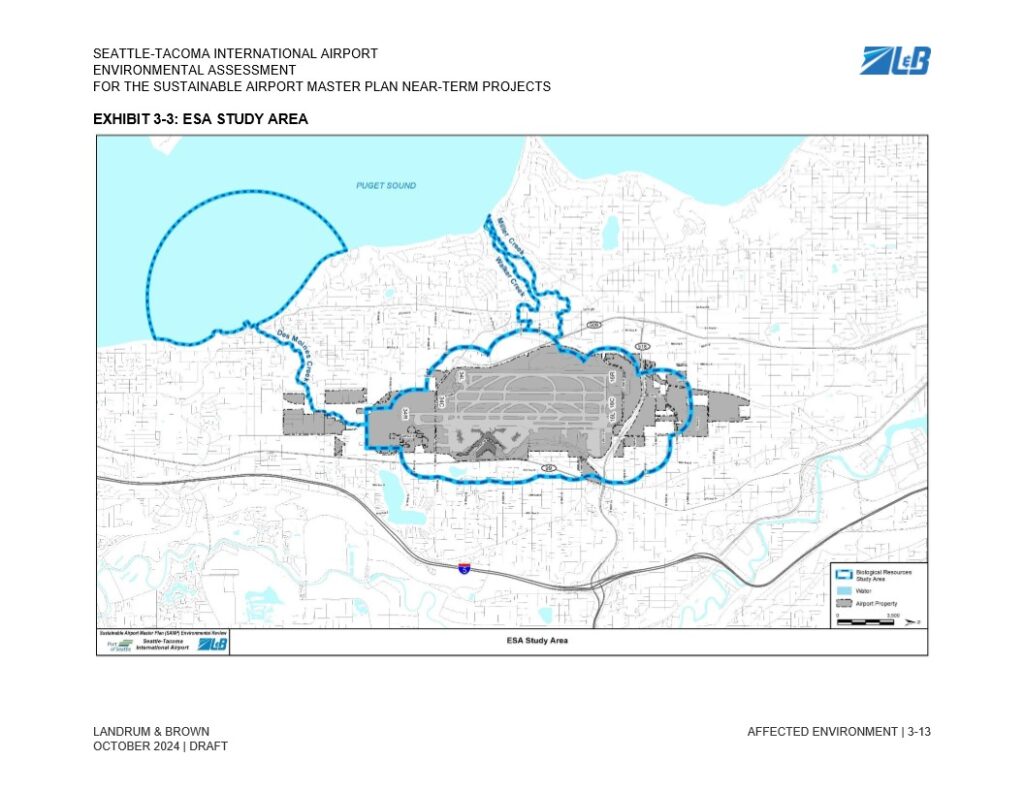
We also strenuously object to the given study area, which the Draft EA refers to as the Area of Potential Effect (APE). Any reasonable person understands that the lived impacts of the airport extend far beyond this boundary; and by that we do not just mean noise. The Port’s own support facilities, bought with FAA ‘noise land’ dollars, extend that boundary far beyond ‘airport property’.
At a minimum, the study area should look a lot more like the DNL65 as it applied to the Third Runway.
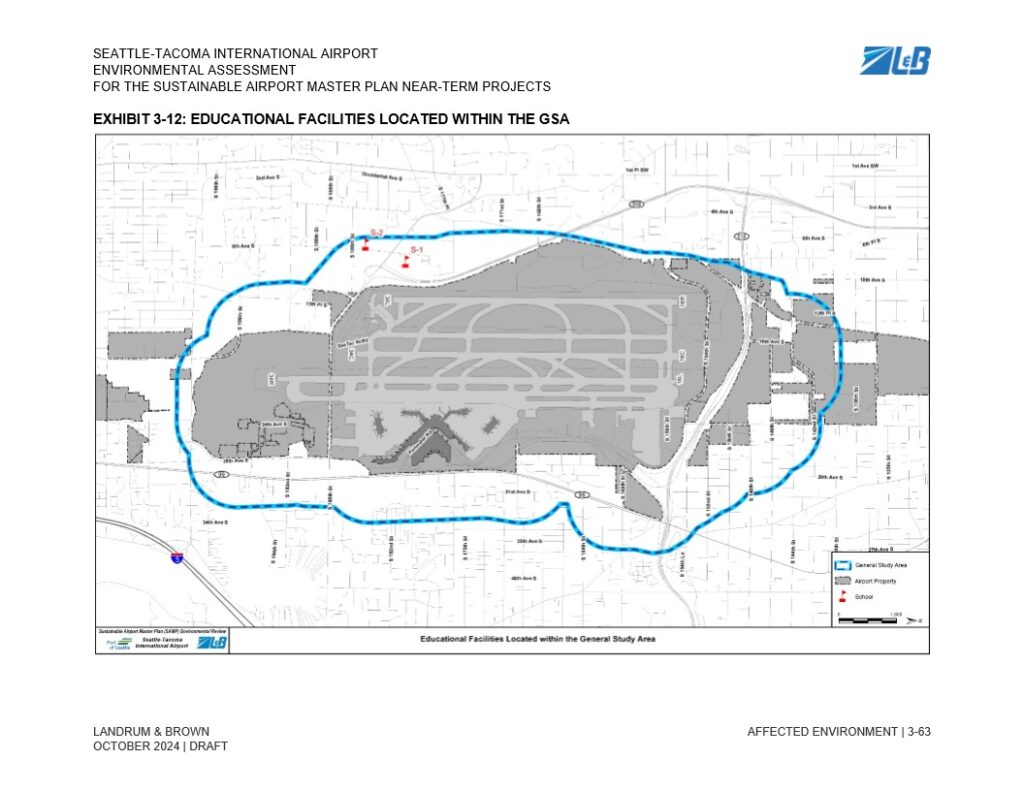
As just one example, the APE completely ignores the educational impacts to neighborhoods directly under the flight path in Federal Way Schools and Seattle Public Schools in the Beacon Hill area.
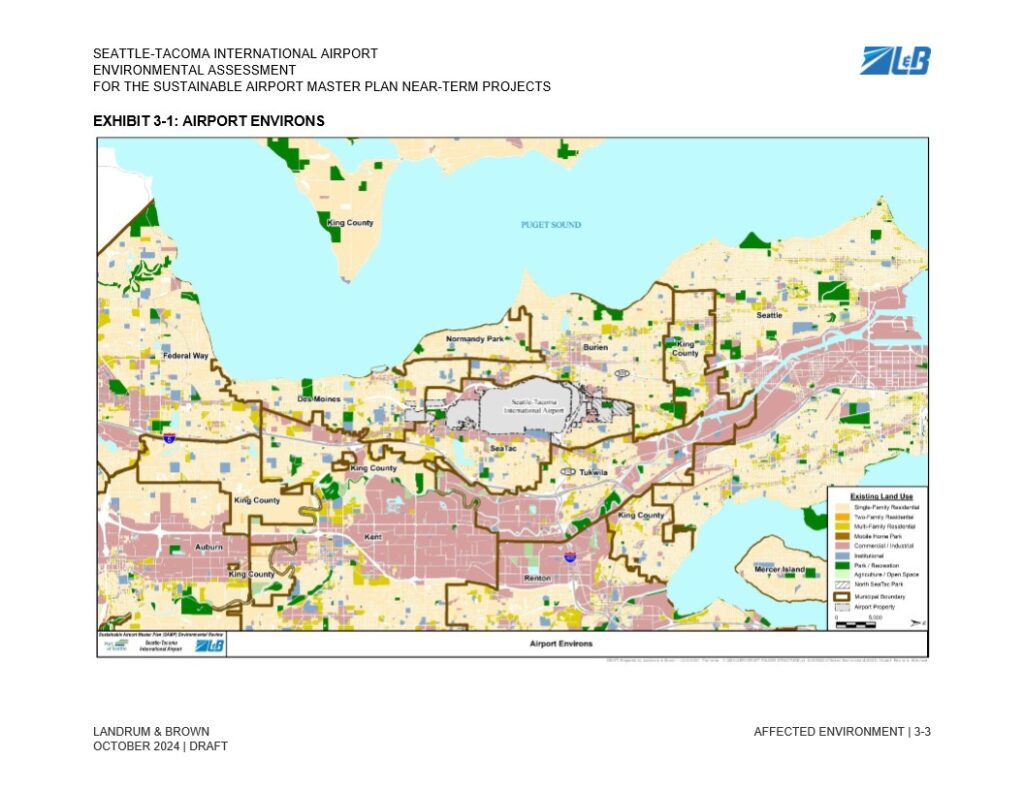
Exhibit 3-1 from the Seattle-Tacoma International Airport Environmental Assessment for the Sustainable Airport Master Plan Near-Term Projects, prepared by Landrum & Brown, dated October 2024 (Draft). The map depicts existing land use classifications across the airport environs, including surrounding municipalities such as SeaTac, Burien, Des Moines, Tukwila, Renton, Kent, Auburn, and Federal Way, with the airport property boundary delineated.
Exhibit 3-3 from the Seattle-Tacoma International Airport Environmental Assessment for the Sustainable Airport Master Plan (SAMP) Near-Term Projects, prepared by Landrum & Brown, dated October 2024 (Draft). The map depicts the Biological Resources ESA Study Area boundary (shown in blue dashed line) surrounding the airport property, extending to Puget Sound to the west and encompassing nearby waterways including Miller Creek and Walker Creek.
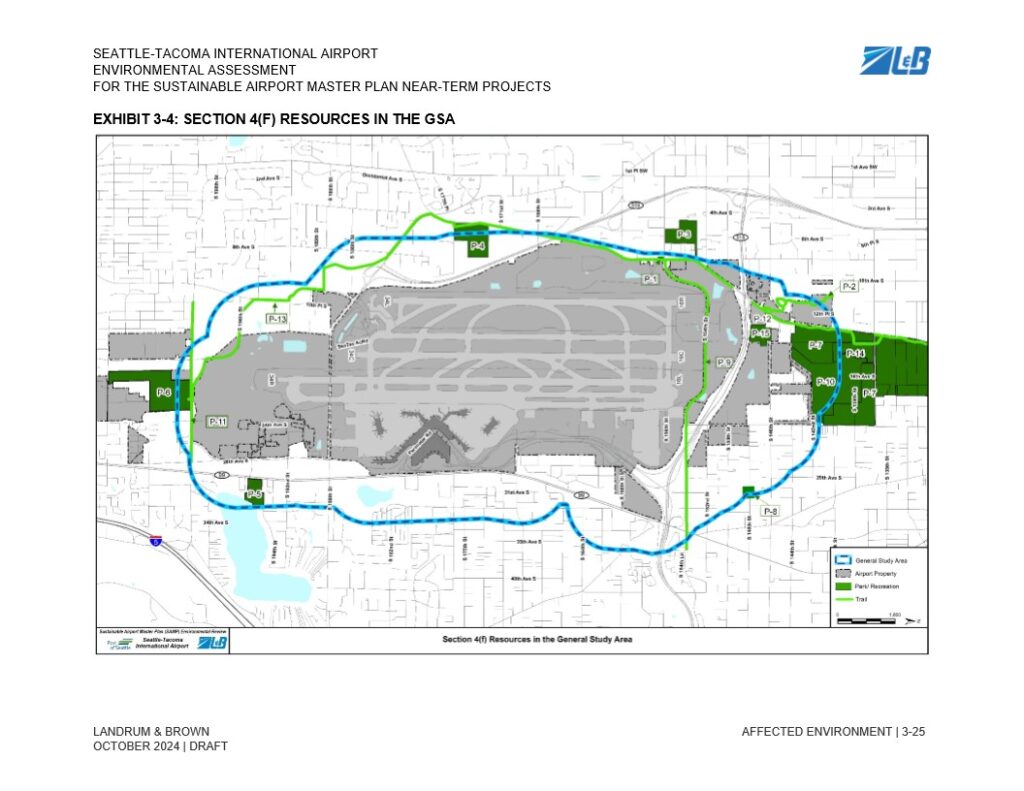
Draft Environmental Assessment exhibit (October 2024, Landrum & Brown) for the Seattle-Tacoma International Airport Sustainable Airport Master Plan Near-Term Projects, mapping Section 4(f) protected resources—parks/recreation areas (labeled P-1 through P-15) and trails—within the General Study Area surrounding Sea-Tac Airport property.
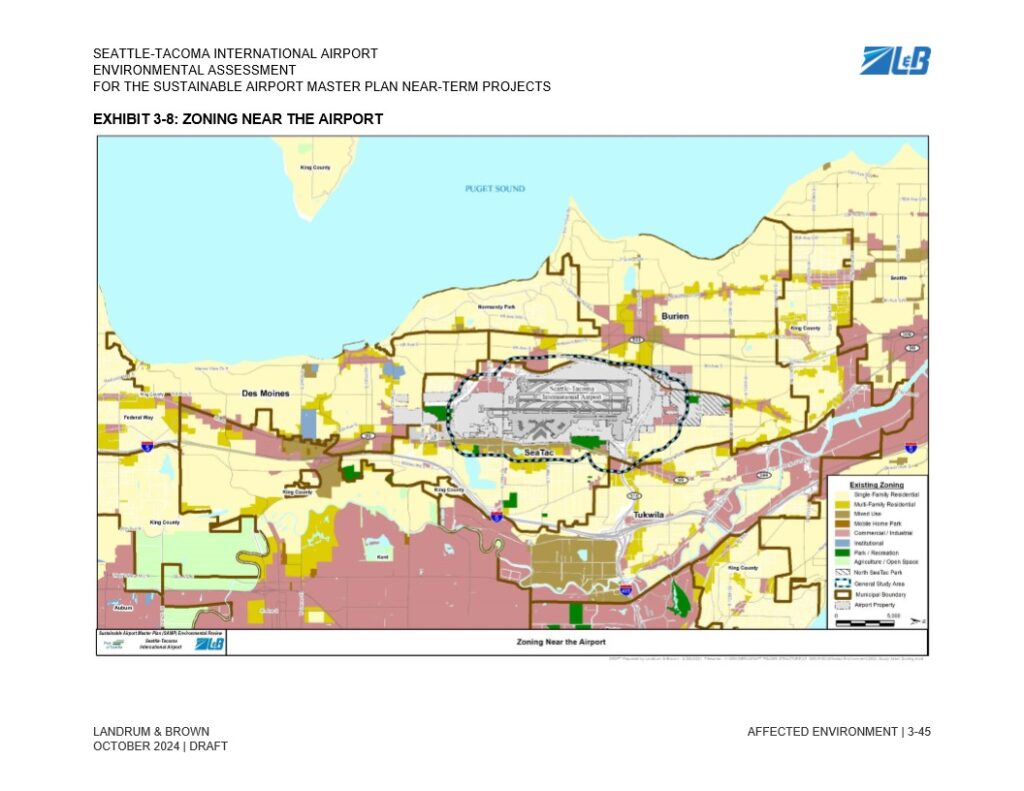
Exhibit 3-8 from the Seattle-Tacoma International Airport Environmental Assessment for the Sustainable Airport Master Plan Near-Term Projects, prepared by Landrum & Brown (October 2024 Draft). The map displays existing zoning categories near Sea-Tac Airport, including surrounding municipalities such as Burien, SeaTac, Des Moines, Tukwila, and King County, with a legend distinguishing residential, commercial/industrial, institutional, park/recreation, and agriculture/open space zones, as well as the North SeaTac Park boundary, General Study Area, and Airport Property.
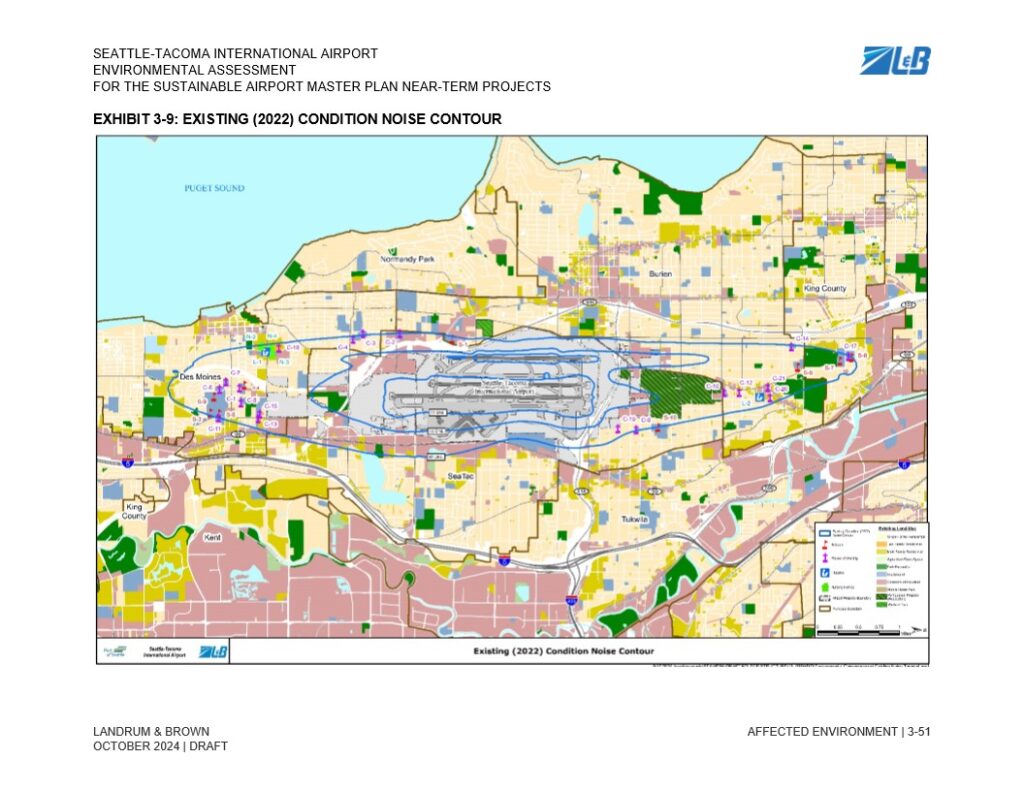
Exhibit 3-9 from the Seattle-Tacoma International Airport Environmental Assessment for the Sustainable Airport Master Plan Near-Term Projects, prepared by Landrum & Brown, dated October 2024 (Draft). The map displays the 2022 existing noise contour lines around Sea-Tac Airport overlaid on surrounding communities including Burien, Des Moines, SeaTac, Tukwila, Normandy Park, and portions of King County, with land use classifications shown in the legend.
This map, from the Seattle-Tacoma International Airport Sustainable Airport Master Plan (SAMP) Environmental Assessment (Draft, October 2024, prepared by Landrum & Brown), shows educational facilities located within the General Study Area (GSA). Two schools, labeled S-1 and S-2, are marked with red icons northwest of the airport property boundary, which is outlined in blue.
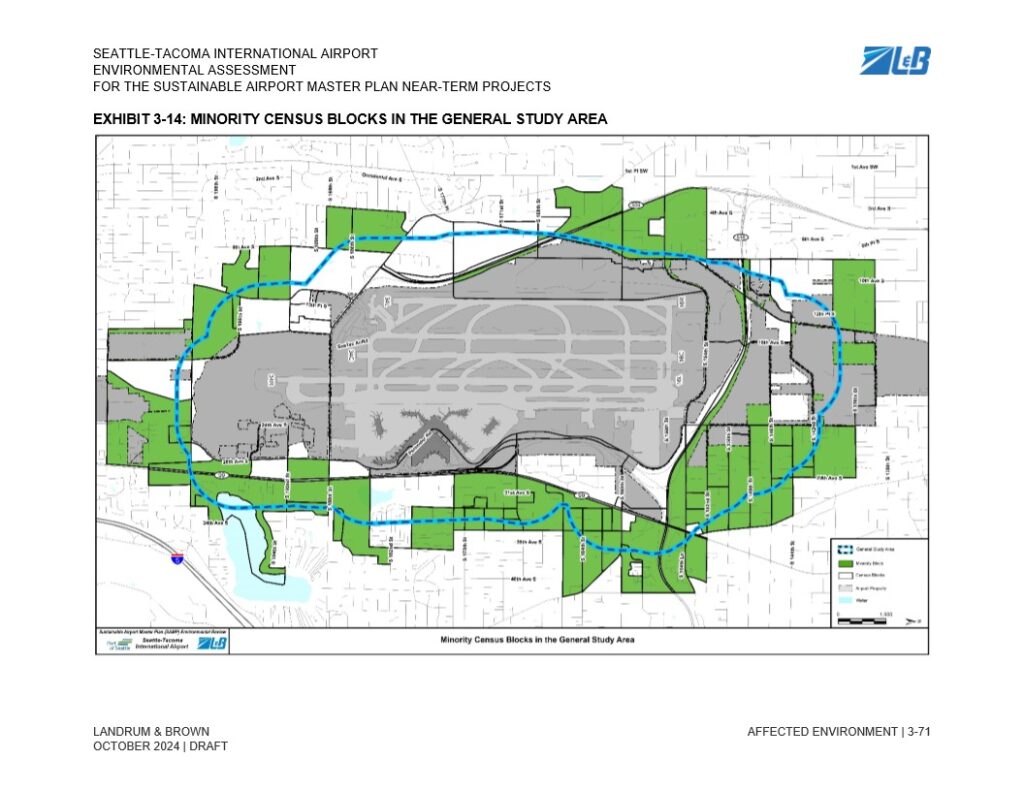
This map, labeled Exhibit 3-14, is from the Seattle-Tacoma International Airport Environmental Assessment for the Sustainable Airport Master Plan Near-Term Projects, drafted by Landrum & Brown in October 2024. It depicts minority census blocks (shown in green) within the General Study Area (outlined in blue) surrounding Sea-Tac Airport, as part of an environmental justice analysis.
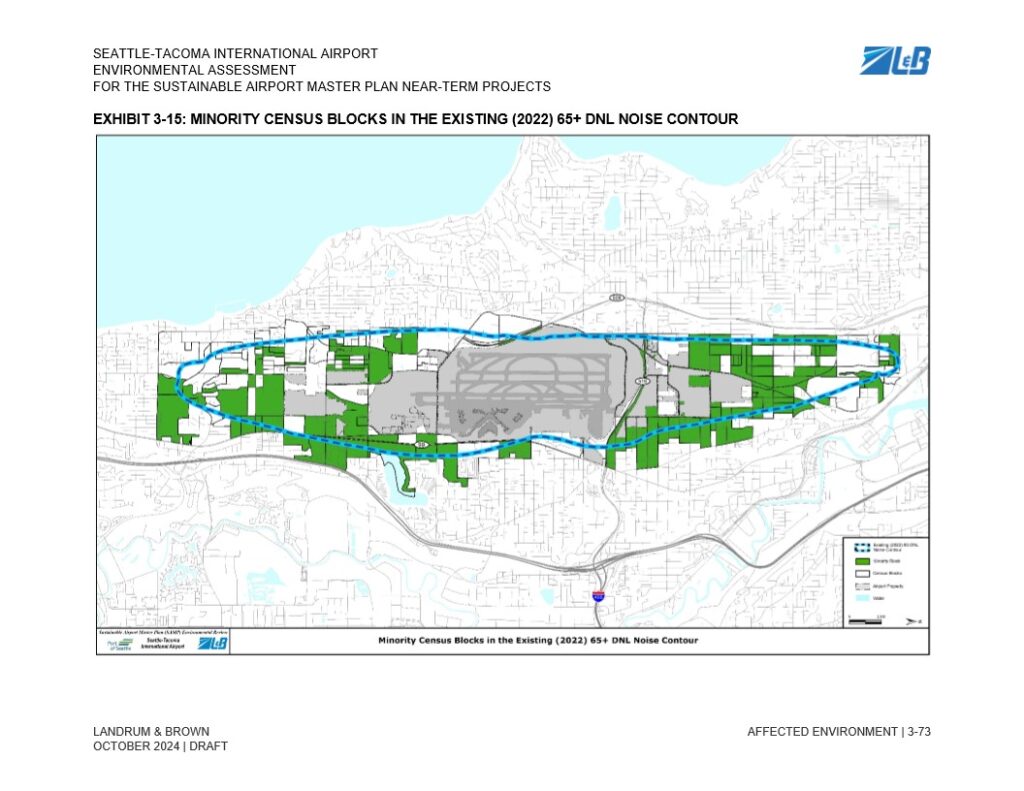
Exhibit 3-15 from the Seattle-Tacoma International Airport Environmental Assessment for the Sustainable Airport Master Plan Near-Term Projects, prepared by Landrum & Brown, October 2024 Draft. The map displays minority census blocks (shown in green) falling within the existing 2022 65+ DNL noise contour (blue dashed line) surrounding Sea-Tac Airport property (gray).
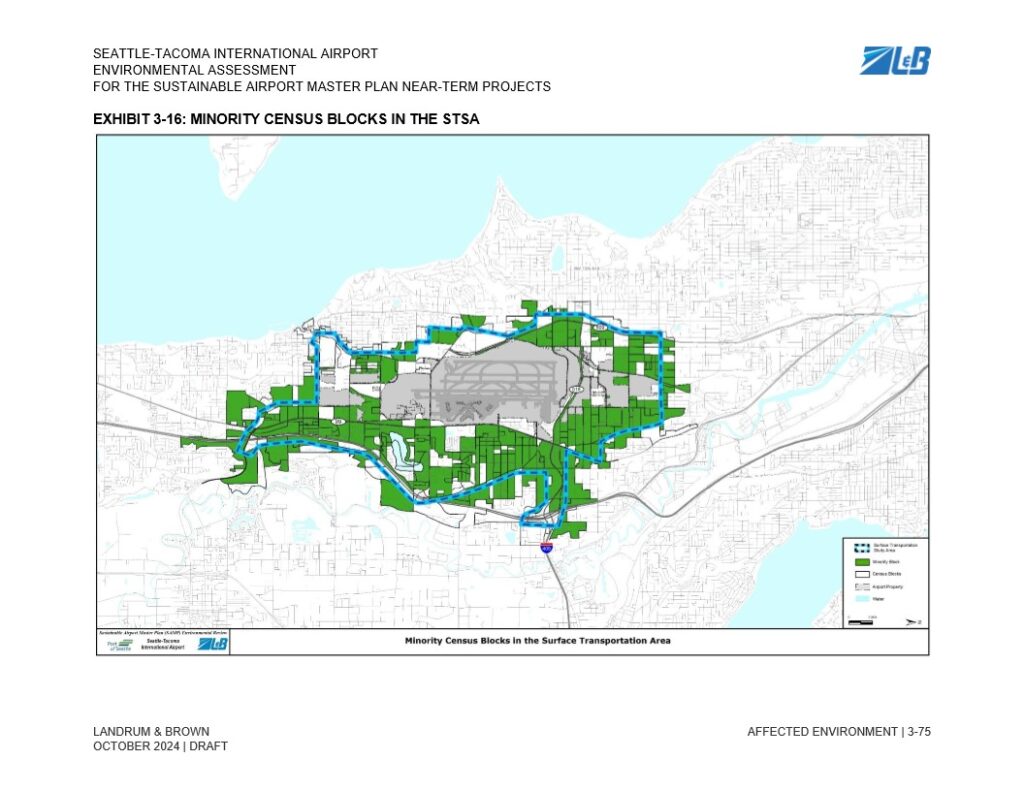
This map, from the Seattle-Tacoma International Airport Sustainable Airport Master Plan Near-Term Projects Environmental Assessment (Draft, October 2024, prepared by Landrum & Brown), depicts minority census blocks within the Surface Transportation Study Area (STSA) surrounding Sea-Tac Airport. Green shading identifies minority census blocks, the blue dashed boundary delineates the Surface Transportation Study Area, and gray shading marks airport property.
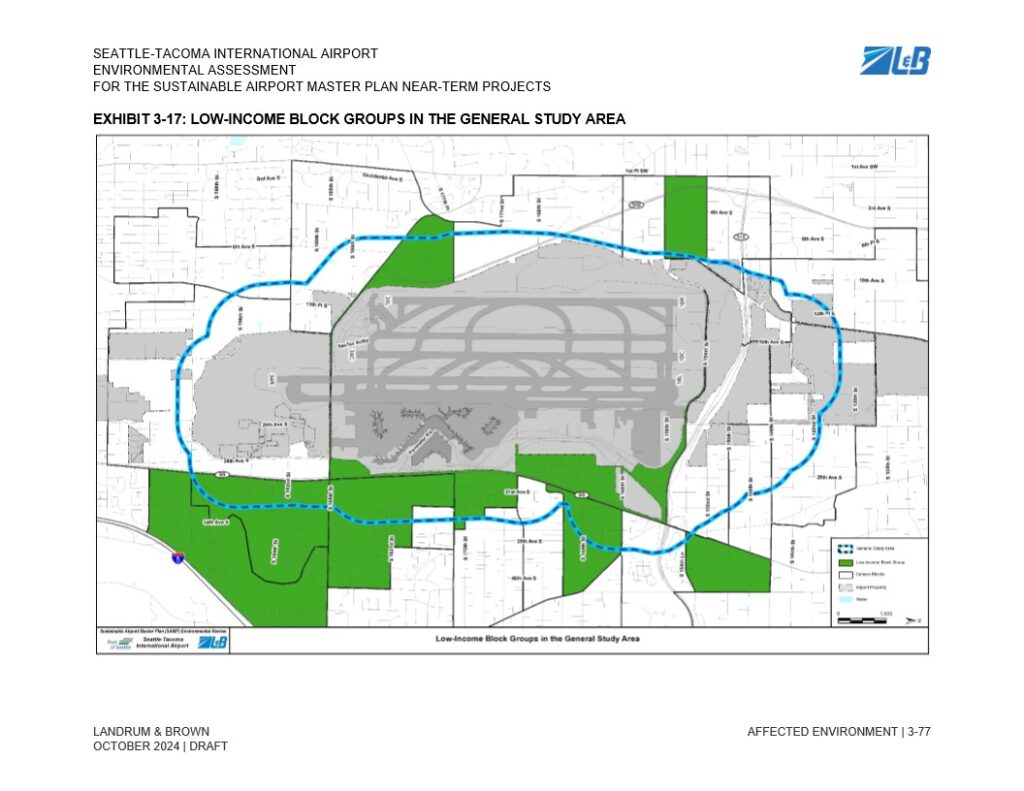
Draft Environmental Assessment exhibit from the Seattle-Tacoma International Airport Sustainable Airport Master Plan (SAMP) Near-Term Projects, prepared by Landrum & Brown, dated October 2024. The map identifies low-income census block groups (shown in green) within the General Study Area (outlined in blue dashes) surrounding Sea-Tac Airport, as part of the environmental justice analysis.
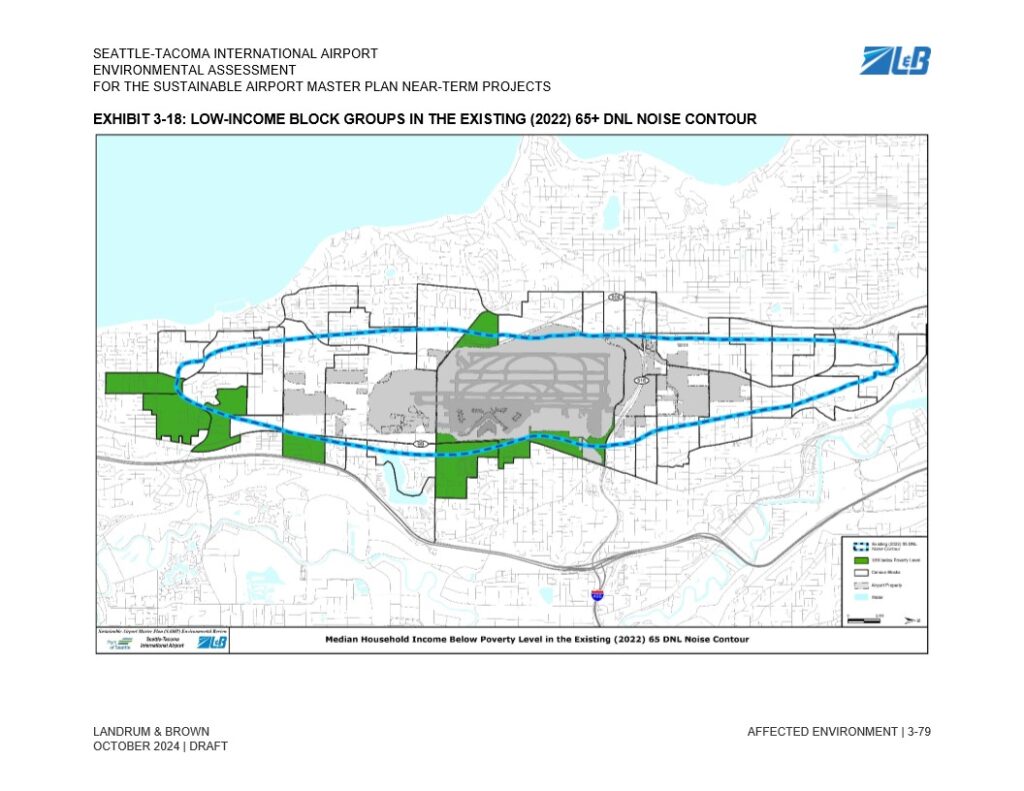
Exhibit 3-18 from the Seattle-Tacoma International Airport Environmental Assessment for the Sustainable Airport Master Plan Near-Term Projects (Draft, October 2024), prepared by Landrum & Brown. The map shows census block groups with median household income below poverty level (highlighted in green) that fall within the existing 2022 65+ DNL noise contour (shown as a blue dashed ellipse) surrounding Sea-Tac Airport.
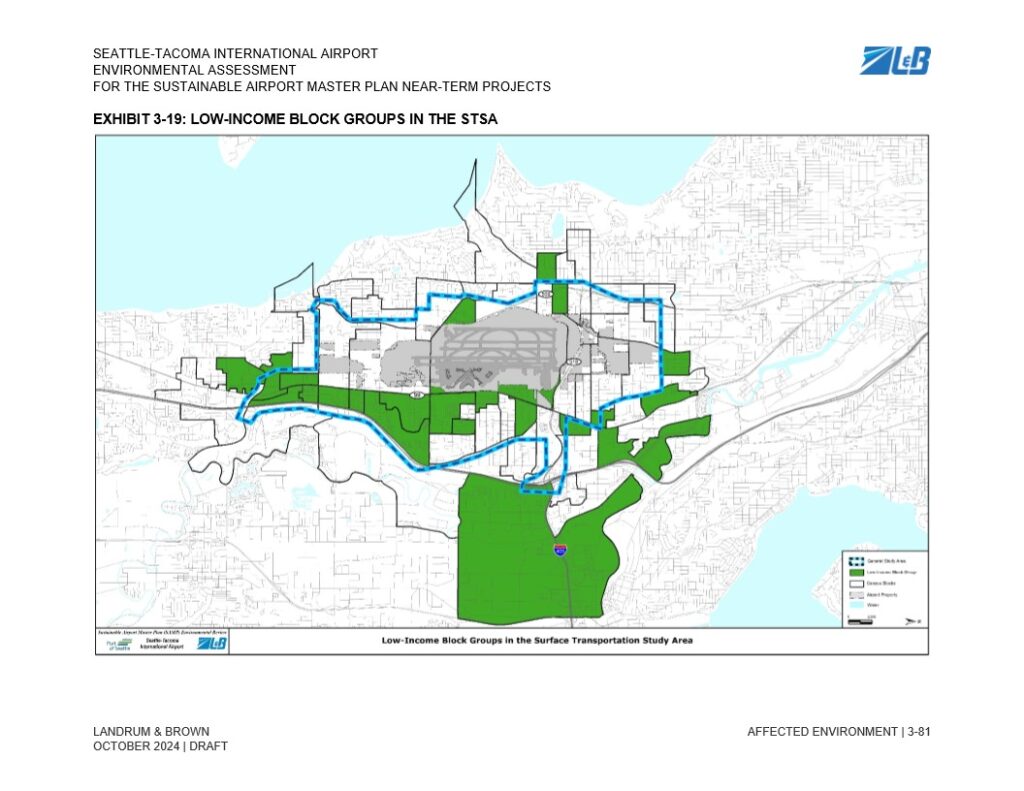
Draft exhibit from the Seattle-Tacoma International Airport Environmental Assessment for the Sustainable Airport Master Plan Near-Term Projects, prepared by Landrum & Brown, dated October 2024. The map (Exhibit 3-19) identifies low-income block groups within the Surface Transportation Study Area (STSA) surrounding Sea-Tac Airport, with green shading indicating low-income block groups and a blue dashed line denoting the general study area boundary.
The Draft EA acknowledges that all our communities are under-served and are considered Environmental Justice Communities. But the SAMP also argues that none of those impacts are caused by the airport. The Draft EA contends that every challenge to community welfare can be explained away by other causes (roadway pollution, ongoing social trends.)
From the perspective of the SAMP, all the challenges our communities face would occur despite the presence of the airport. According to the Draft EA, the airport is not only an essential benefit to the region, it has actually improved all our communities, and thus the expansion of airport operations will only further those net positive impacts!
Summary
We cannot allow these assertions to go unchallenged. To protect our communities, we must counter these false narratives, as much as we do the noise and pollution, which usually get all the attention in these discussions.
A primary goal of this environmental assessment is to obtain a full Environmental Impact Statement. Not only has the Port misstated its value to the community, it has attempted to argue that these false benefits are acceptable substitutes for the real harms to our communities. This is outrageous We must insist that the FAA/Port go back to the drawing board. We are confident that when the facts are known, they will show that the airport has not been a net positive for people living under the flight path. And that will open the door to genuine, long-term community mitigations.
We use cookies to provide basic functionality. We also provide access to search engines in order to provide site analytics. We do not sell or share your data.