Skip to content
  • STNI
  • Statistics
    • Ops and Passengers
      • King County International Airport (Boeing Field) Annual Operations
    • Financials
    • Aviation fuel uplift in the State of Washington 2018 – 2025
      • Aviation Fuel Tax Revenue in the State of Washington 1983-2025
      • Aviation Fuel Uplift at Sea-Tac Airport
    • Air Quality Monitoring
    • Flight Tracking
      • Flow and Flight Tracks
      • Five Year Comparison
      • Busiest Hours and Days
    • SEL Noise Reports & Graphs
      • About The Permanent Noise Monitors
      • Minutes of Quiet by Noise Monitor
      • Noise Events mapped
      • Noise Events (SEL)
    • Runways
    • Employees
    • Real Estate
      • Port Properties and Trees mapped
    • Parking
  • Events
  • Protest
    • Regular Events
    • Legislation 2026
    • Complain about a particular flight
    • Advocacy Organizations
    • Media Outlets
    • People
    • The Port of Seattle
      • Commission Meetings
      • Public Records Requests
      • StART
      • Highline Forum
    • Contact Your Electeds
  • Resources
    • FAQs
      • FAA Occurrences/Accidents/Indents
    • The SAMP
      • SAMP Public Comment Template
        • Two versions of Appendix K: NEPA/SEPA 2018 vs 2023
      • SAMP NTP: 31 projects by the numbers
      • SEPA Draft EIS (2026)
      • SAMP Record of Decision/FONSI (2025)
      • SAMP Draft EA (October 2024)
      • 2018 Scoping
    • Port Packages
      • Port Package Property Costs
      • Port Packages mapped
      • The Port Package Explainer
      • So you want a (first-time) Port Package? Start here
      • Port Package Looker Upper
      • How do I determine if I have a Port Package or Avigation Easement?
      • Progress on Port Package Update legislation
      • Having a Port Package Problem?
      • Port Package Site Visit Follow-Up
    • Document Library
    • Explainers
      • The Airport Law Cheat Sheet
      • The Grant Explainer
    • External Articles
    • History
      • Timeline
      • The Sea-Tac Communities Plan
        • Sea-Tac Communities Plan – Planning Maps
      • PSRC Third Runway Decision Process
    • Studies
    • Videos
  • Stories
  • Mission
  • Subscribe
  • Contact
Scroll down to content

Get InformedStay Informedx

I understand that you will never share my information with anyone, you will only use it to keep me updated on relevant events and that I may unsubscribe at any time.

STNI

STNISea-Tac Noise.Info

  • Solve for Sea-Tac. Solve for every airport.
  • Since 2016, working to obtain justice for everyone living under the flight path.
  • Less Noise. Cleaner Air. Better Public Health. Compensation.
  • Everything you think you know about the airport is wrong.

TagNEPA(390)

Advanced Search Options

  • Dates
  • Media
    • External Articles
    • Images
    • PDFs
    • Video
    • Audio
  • Order By
  • Chapter 3 Affected Environment_101

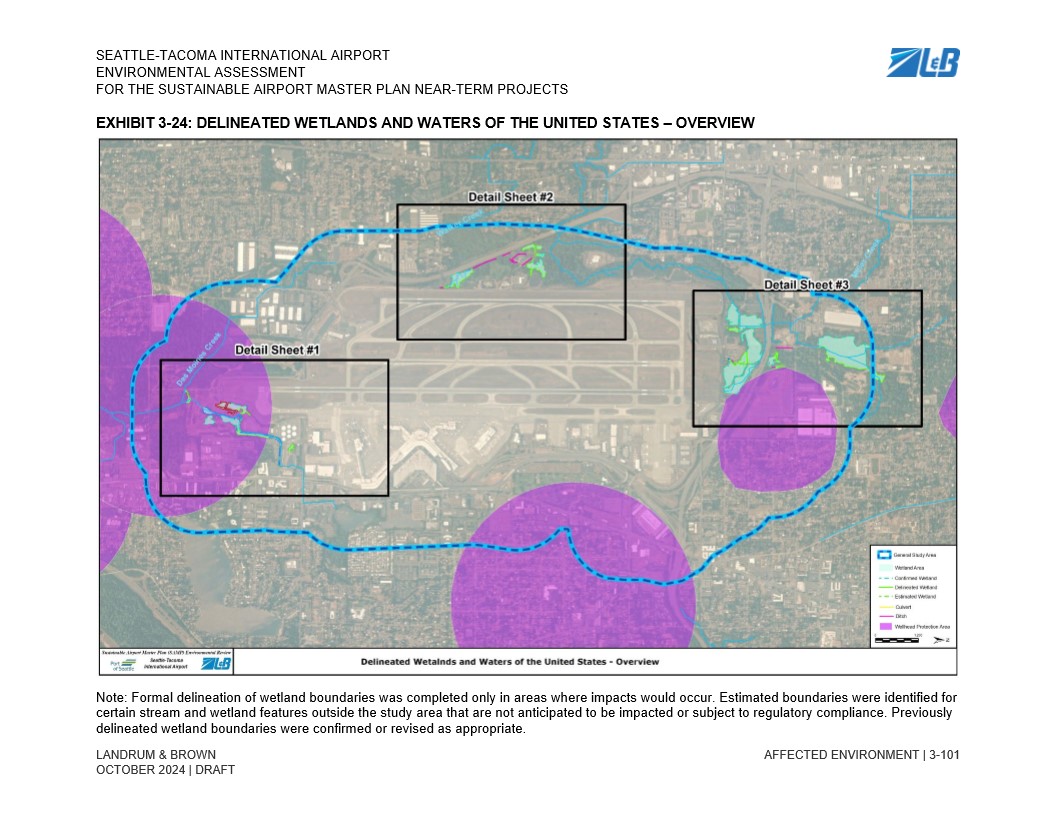
    Exhibit 3-24 from the Seattle-Tacoma International Airport Environmental Assessment for the Sustainable Airport Master Plan Near-Term Projects, prepared by Landrum & Brown, dated October 2024 (Draft). The aerial overview map shows delineated wetlands, confirmed and estimated wetland boundaries, culverts, ditches, and wetland protection areas within and around the airport study area, with three detail sheet insets highlighted.
    TagsNEPAFolderChapter-3 (Affected Environment)
  • Chapter 3 Affected Environment_85

    This map, from the Seattle-Tacoma International Airport Environmental Assessment for the Sustainable Airport Master Plan Near-Term Projects (Draft, October 2024), shows the percentage of population under age 18 by census block group within the General Study Area. Prepared by Landrum & Brown for the Port of Seattle, the map uses a purple color gradient to indicate concentrations ranging from under 10% to 30.1–40% children, with the airport property and study area boundary overlaid.
    TagsNEPAFolderChapter-3 (Affected Environment)
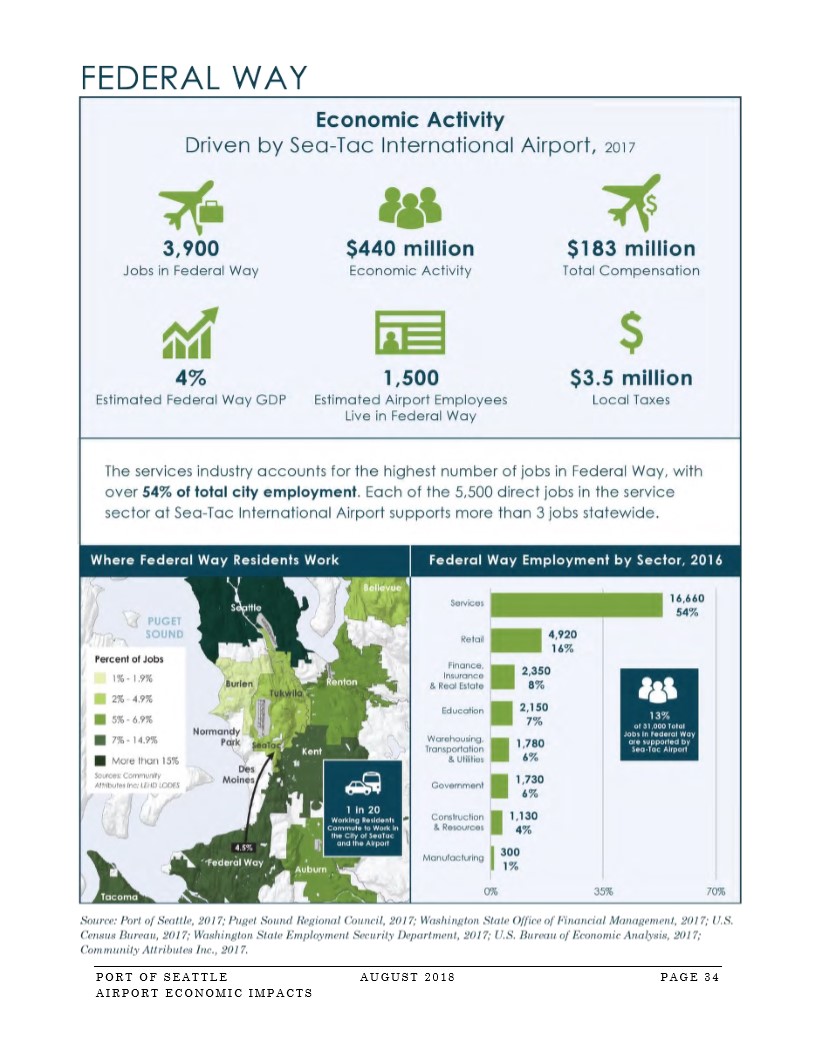
  • Port of Seattle Airport Economic Impacts (Aug 2018) — Federal Way Profile, p.34

    Port of Seattle infographic (August 2018, page 34) summarizing Sea-Tac Airport's economic impact on Federal Way, Washington, including 3,900 jobs, $440 million in economic activity, $183 million in total compensation, and a breakdown of Federal Way employment by sector showing services at 54% (16,660 jobs). The document notes that 13% of Federal Way's total jobs are supported by Sea-Tac Airport.
    TagsNEPAFolderAppendix K (Socioeconomic Impacts - graphics)
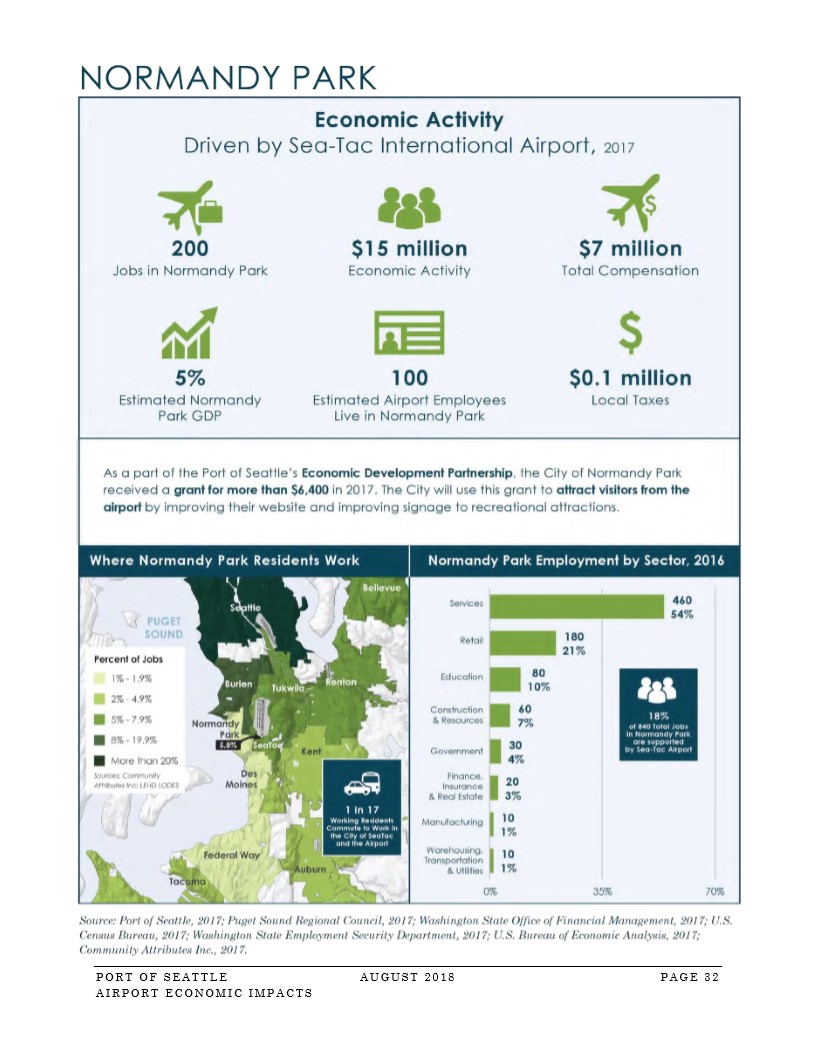
  • Port of Seattle Airport Economic Impacts (Aug 2018) — Normandy Park Profile, p.32

    Port of Seattle infographic (August 2018, Page 32) showing Normandy Park's airport-driven economic activity for 2017, including 200 jobs, $15 million in economic activity, $7 million total compensation, 5% estimated GDP contribution, 100 airport employees living in Normandy Park, and $0.1 million in local taxes. Includes maps and charts showing where Normandy Park residents work and employment by sector, noting 18% of 840 total local jobs are supported by Sea-Tac Airport.
    TagsNEPAFolderAppendix K (Socioeconomic Impacts - graphics)
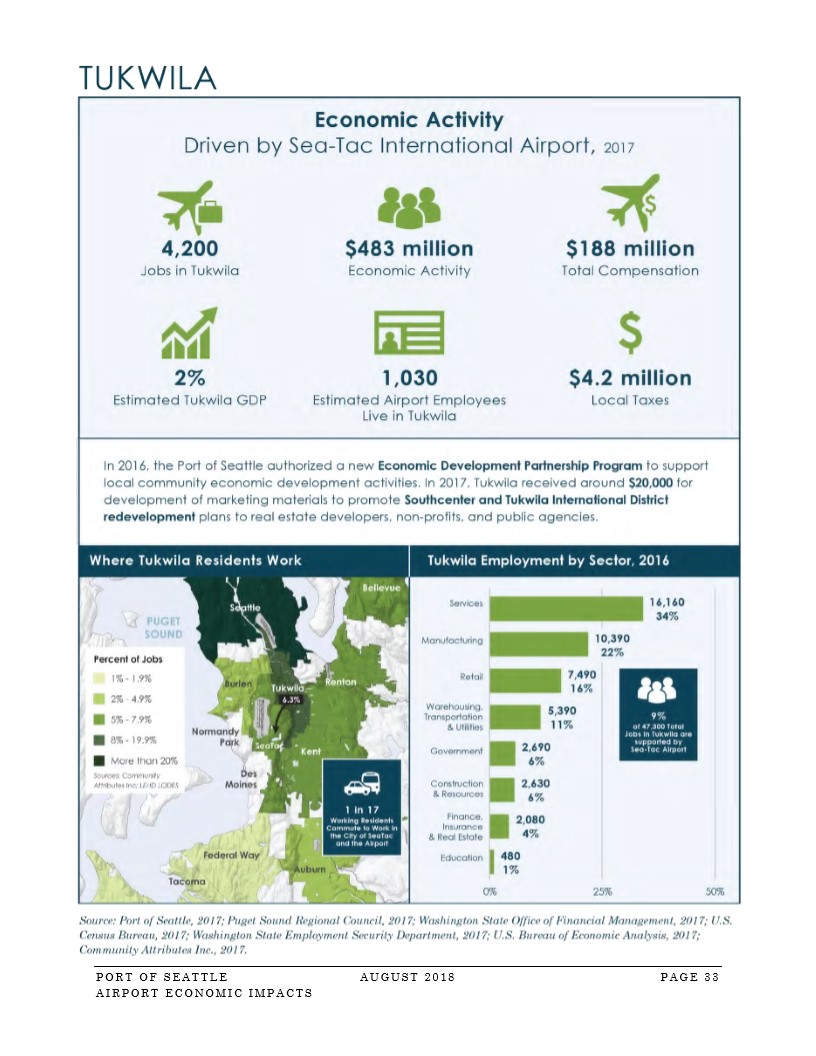
  • Port of Seattle Airport Economic Impacts (Aug 2018) — Tukwila Profile, p.33

    This infographic from the Port of Seattle's August 2018 Airport Economic Impacts report (Page 33) details Sea-Tac Airport's economic contributions to Tukwila in 2017, including 4,200 jobs, $483 million in economic activity, $188 million in total compensation, and $4.2 million in local taxes. It also includes a map of where Tukwila residents work and a bar chart of Tukwila employment by sector for 2016, noting that 9% of 47,300 total jobs in Tukwila are supported by Sea-Tac Airport.
    TagsNEPAFolderAppendix K (Socioeconomic Impacts - graphics)
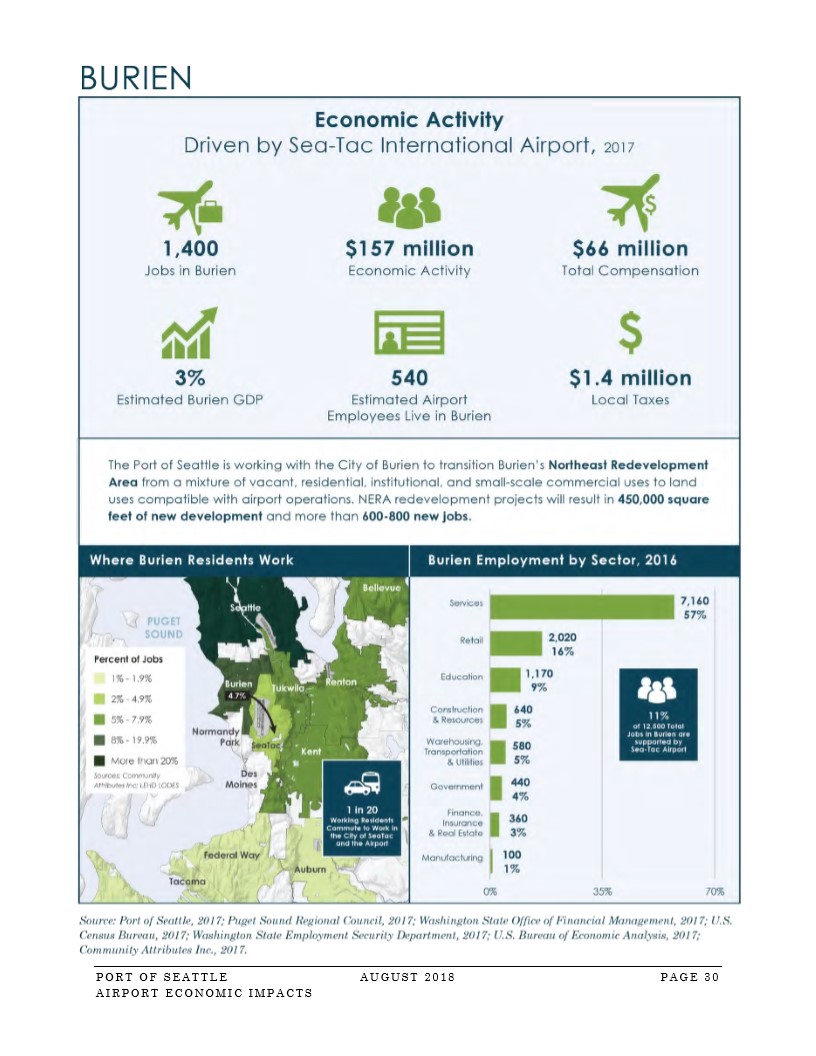
  • Port of Seattle Airport Economic Impacts (Aug 2018) — Burien Profile, p.30

    This infographic from the Port of Seattle's August 2018 Airport Economic Impacts report (Page 30) details Burien's airport-driven economic activity for 2017, including 1,400 jobs, $157 million in economic activity, $66 million in total compensation, and $1.4 million in local taxes. It also includes a map of where Burien residents work and a bar chart of Burien employment by sector for 2016, noting that 11% of 12,800 total jobs in Burien are supported by Sea-Tac Airport.
    TagsNEPAFolderAppendix K (Socioeconomic Impacts - graphics)
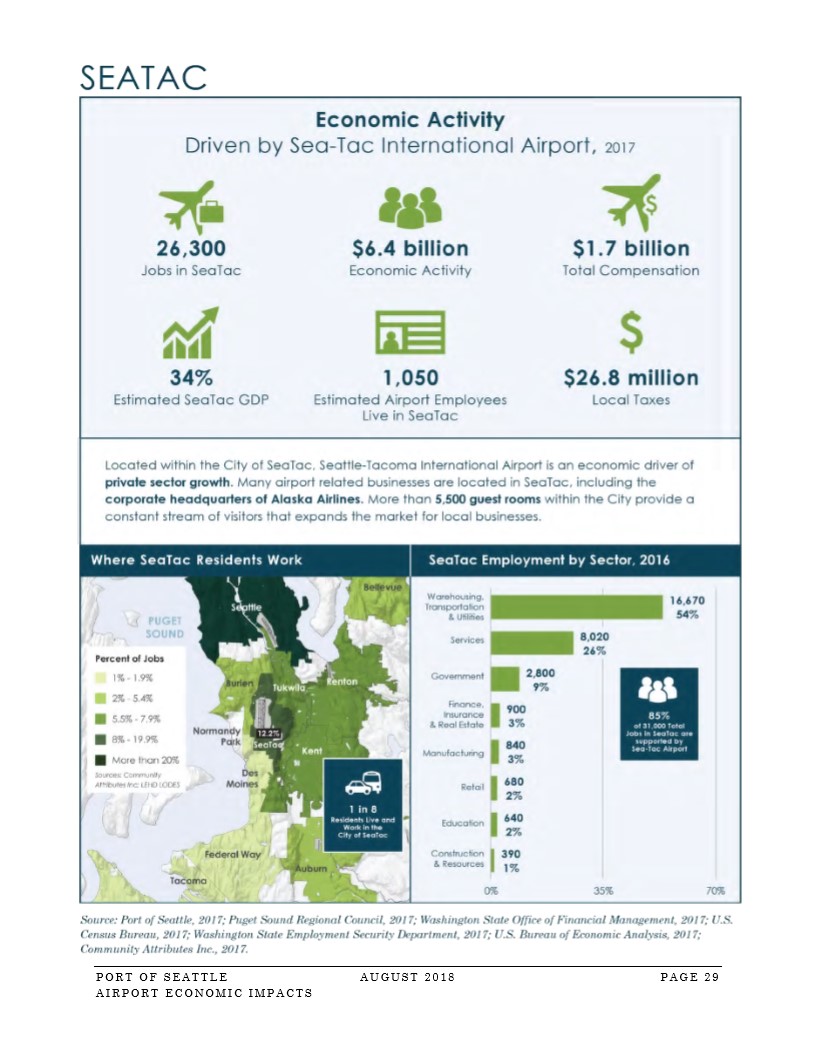
  • Port of Seattle Airport Economic Impacts (Aug 2018) — SeaTac Profile, p.29

    This infographic from the Port of Seattle's August 2018 Airport Economic Impacts report details the economic activity driven by Seattle-Tacoma International Airport in 2017, including 26,300 jobs, $6.4 billion in economic activity, $1.7 billion in total compensation, and $26.8 million in local taxes. It also includes a map of where SeaTac residents work and a bar chart showing SeaTac employment by sector for 2016, noting that 85% of the 31,000 total jobs in SeaTac are supported by Sea-Tac Airport.
    TagsNEPAFolderAppendix K (Socioeconomic Impacts - graphics)
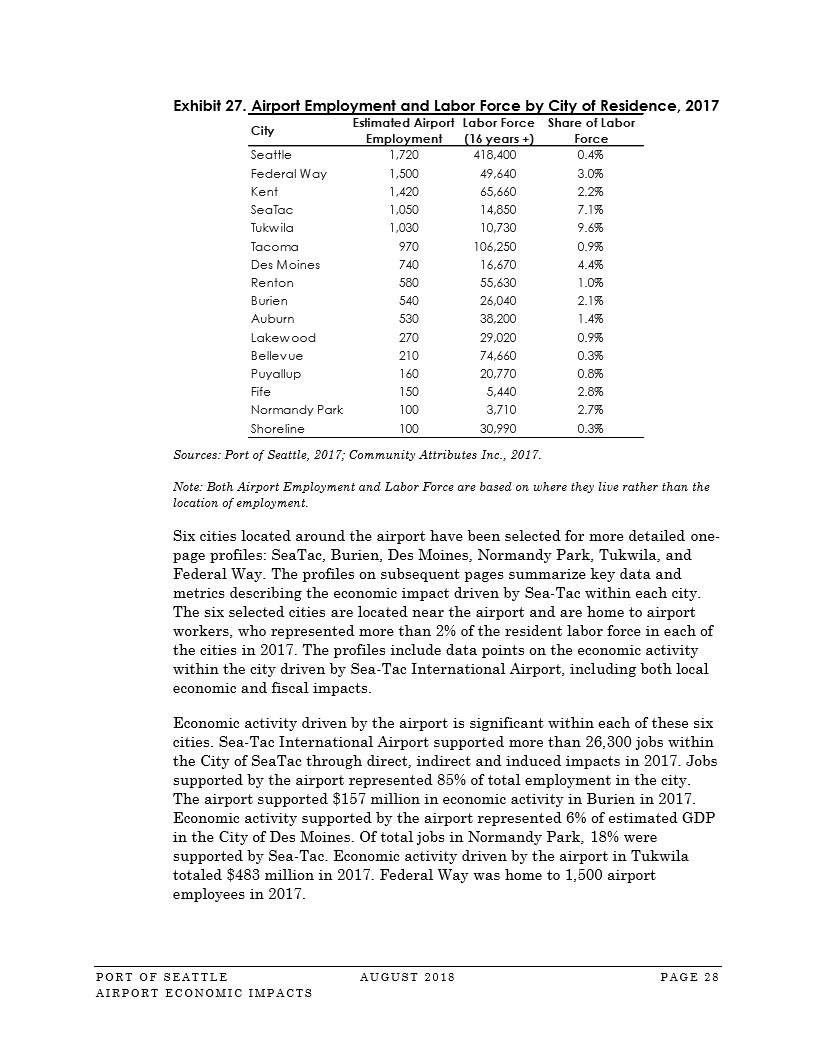
  • Port of Seattle Airport Economic Impacts (Aug 2018) — Airport Employment and Labor Force by City, p.28

    Page 28 of the Port of Seattle Airport Economic Impacts report (August 2018), presenting Exhibit 27, a table showing estimated airport employment, labor force size, and share of labor force for 17 cities in the Seattle metro area in 2017. The accompanying text highlights six cities selected for detailed profiles—SeaTac, Burien, Des Moines, Normandy Park, Tukwila, and Federal Way—where airport workers represented more than 2% of the resident labor force.
    TagsNEPAFolderAppendix K (Socioeconomic Impacts - graphics)
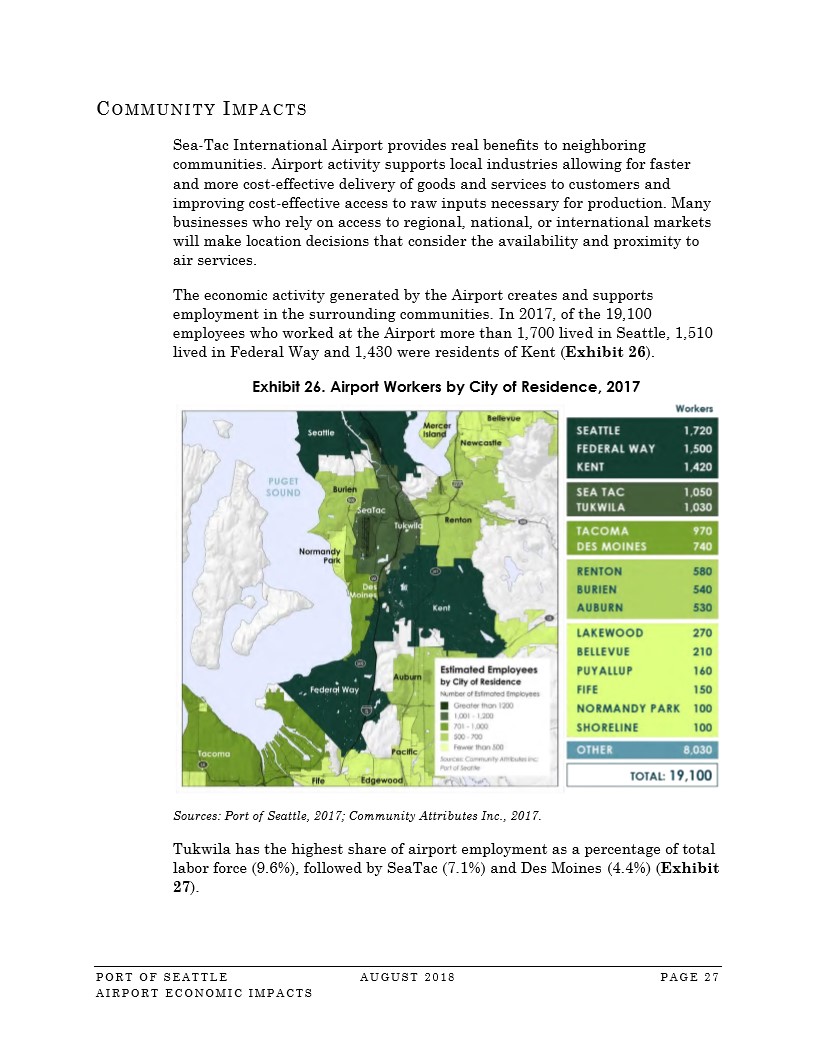
  • Port of Seattle Airport Economic Impacts (Aug 2018) — Airport Workers by City of Residence, p.27

    Page 27 of the Port of Seattle Airport Economic Impacts report (August 2018) details community impacts of Sea-Tac International Airport, including Exhibit 26, a map and table showing airport workers by city of residence in 2017, with Seattle (1,720), Federal Way (1,500), and Kent (1,420) as the top three cities among the 19,100 total employees. The section notes Tukwila had the highest share of airport employment as a percentage of total labor force at 9.6%.
    TagsNEPAFolderAppendix K (Socioeconomic Impacts - graphics)
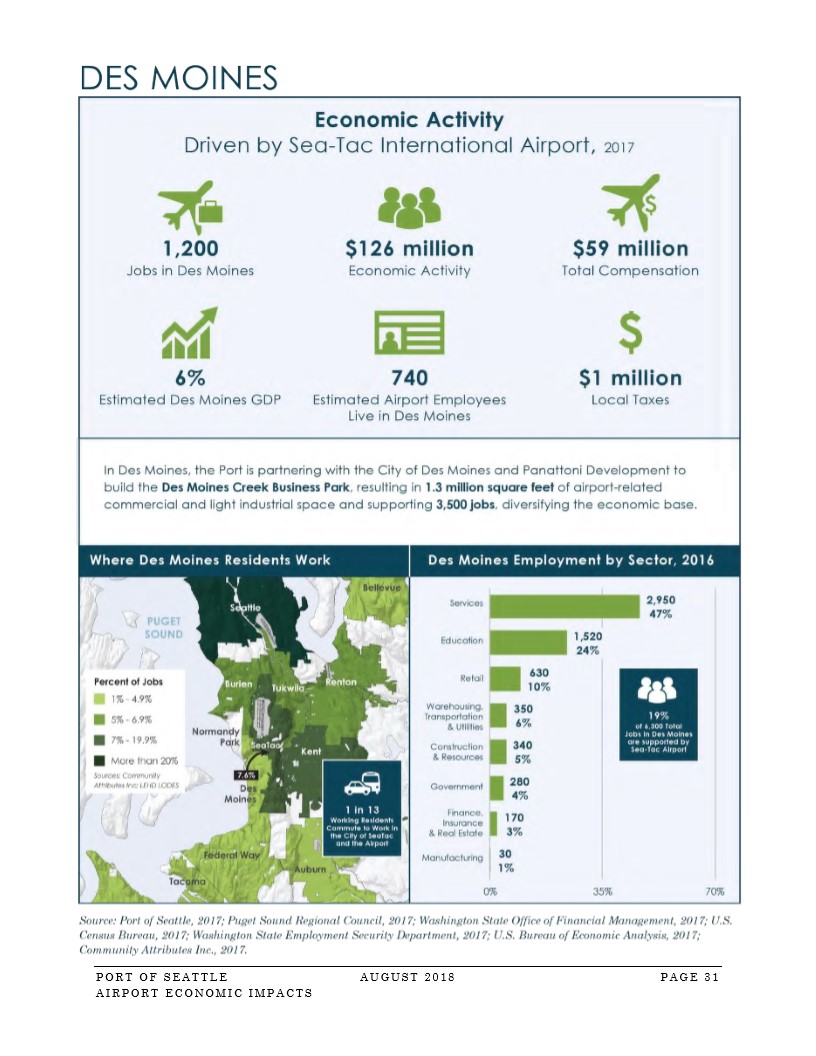
  • Port of Seattle Airport Economic Impacts (Aug 2018) — Des Moines Profile, p.31

    This infographic from the Port of Seattle's August 2018 Airport Economic Impacts report details Sea-Tac International Airport's economic contribution to Des Moines, Washington in 2017, including 1,200 jobs, $126 million in economic activity, $59 million in total compensation, 740 estimated airport employees living in Des Moines, and 6% of estimated Des Moines GDP. It also references the Des Moines Creek Business Park development (1.3 million sq ft, 3,500 jobs) and includes maps and charts showing where Des Moines residents work and employment by sector for 2016.
    TagsNEPAFolderAppendix K (Socioeconomic Impacts - graphics)

Posts pagination

Page 1 … Page 14 Page 15 Page 16 Page 17 Page 18 … Page 39
Sidebar On/Off

Upcoming Events

  • Burien Airport Committee Meeting September 15, 2026
    Add to CalendarMTuesday Sep 15: 6:00pm
    400 SW 152nd St, Burien, WA 98166
    Burien airport committee 15 sep 2026 agenda pdf pdf

    a) Part 150 Noise Study (Emily Inlow-Hood) — 15 minutes
    b) SAMP Update and Next Steps (Brian Davis and Sarah Moore) — 15 minutes
    c) Legislative Updates — 10 minutes
       • SCA (Sarah Moore)
       • Work with Sen. Orwall (Brian Davis)
    d) StART Reorganization (Jeff Harbaugh and Karen Veloria) — 10 minutes

    [...]

[See all...]


Help study childhood asthma. Get free HEPA filter!

read more...

Issues

Sea-Tac Airport is currently undergoing the largest and longest expansion in its history, collectively known as the Sustainable Airport Master Plan (SAMP). Some of it you can already hear, but you’re probably not aware of what it all means. Here’s what you need to know.
read more...

Read This!

As the source for federal transportation grants, the Puget Sound Regional Council was charged with developing a system to meet the growing need for commercial aviation. When the search for a second airport failed, they authorized the Port of Seattle to build the Third Runway, with a mandate to develop a noise abatement and mitigation program. In their effort to stop the Third Runway, the ACC argued over every detail of the Port's efforts--including property buyouts and sound insulation. The dispute was meant to be settled by a three member Expert Arbitration Panel. This is their final report. It finds 2-1, that the Port's program was insufficient in several respects. Despite that, funding for the Third Runway was approved by the PSRC, and the 'Port Package' program, proceeded largely unchanged. Expert Arbitration Panel's final decision finding that the Port of Seattle had not shown sufficient reduction in real on-the-ground noise impacts to satisfy noise reduction conditions required for approval of a third runway at Sea-Tac International Airport. The majority decision concluded the Port's noise abatement programs were insufficient despite being impressive in scope.
continue...

The Podcast!

Subscribe to the only podcast devoted to policies, politics, history, impacts for people living under the flight path everywhere. It’s definitely not just about noise!
  • Sea-Tac Noise.Info
  • Connect with STNI

    • Subscribe
    • Port Package Problem?
    • Donate
    • Podcast
    • Socials
      • Facebook
      • X (Twitter)
      • Bluesky
      • Instagram

    "Community Project Funding/Congressionally Directed Spending" — , 2026

  • Learn

    • Frequently Asked Questions
    • Explainers
    • Youtube
    • Research Requests
    • Make a complaint
  • Goals

    Fulfill the promises of 1976:
    • Compensation
    • Reduced noise
    • Improved air quality
    • Environmental remediation
Login/Register
©2026•Data Privacy

Message

We use cookies to provide basic functionality. We also provide access to search engines in order to provide site analytics. We do not sell or share your data.
V V