I understand that you will never share my information with anyone, you will only use it to keep me updated on relevant events and that I may unsubscribe at any time.
Sarah Potter: Landrum & Brown, Steve Rybold and Sarah Cox: Port of Seattle
Today’s Commission meeting was the Port’s first presentation concerning the Draft EA published yesterday. To summarize the 4,500 page document in one sentence, the only required mitigation will be for construction impacts. There is nothing for Air Quality, Noise, Environmental Justice, Cumulative Impacts. None.
Port Environmental Director Sarah Cox acknowledged this and gave the Commission hope for more mitigation options in the SEPA process, which will occur after the Federal assessment is complete in Q3 2025. However, given the fact that the Port self-permits (through an agreement with the City of SeaTac) we are skeptical.
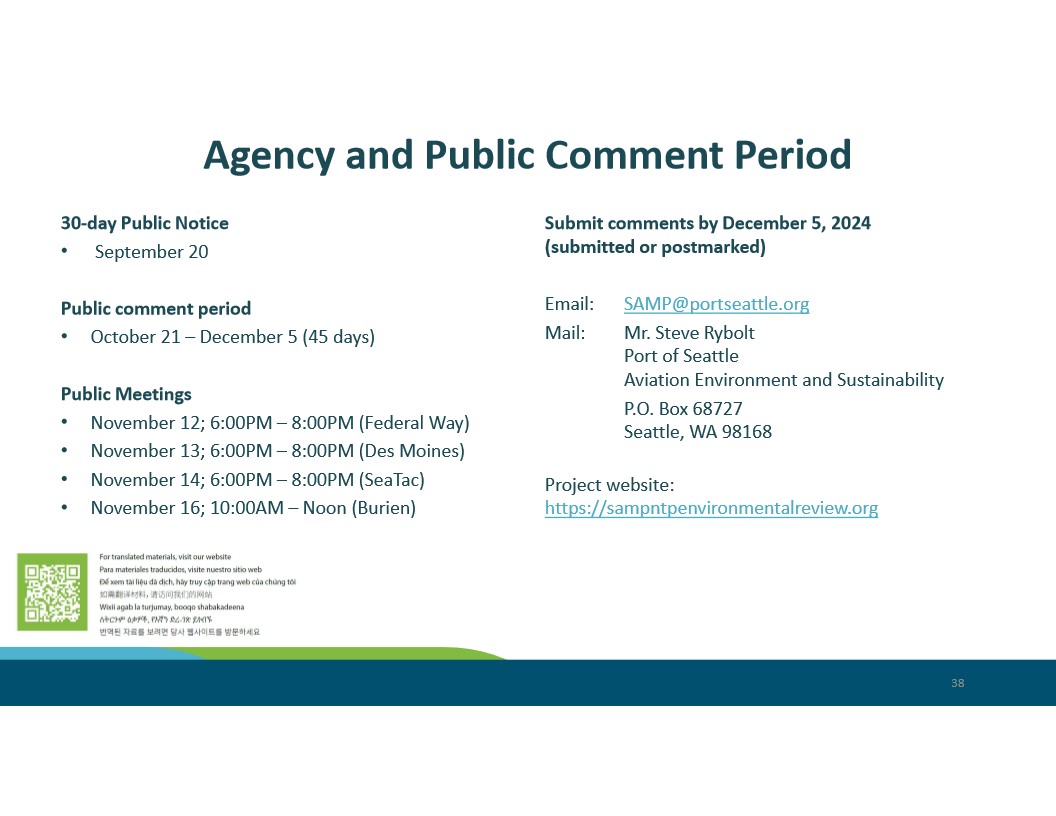
45 Day Comment Period
The Port of Seattle had six years to prepare this document, totaling over 4,500 pages. 45 days for 4,500 pages. But 4,500 pages only skim over the 31 projects–each of which might require a thousand pages should the FAA ultimately decide that a full Environmental Impact Statement is needed.
Open Houses will begin in mid-November, half way through that public comment period. Public comments can be submitted online, by email, by regular mail, or in person at one of the four public meetings.
Public meeting dates:
November 12 (Tuesday) — 6 to 8 p.m. — Wildwood Elementary School (Federal Way)
November 13 (Wednesday) — 6 to 8 p.m. — Mount Rainier High School (Des Moines)
November 14 (Thursday) — 6 to 8 p.m. — Highline High School (Burien)
November 16 (Saturday) — 10 a.m. to 12 p.m. — McMicken Heights Elementary School (SeaTac)
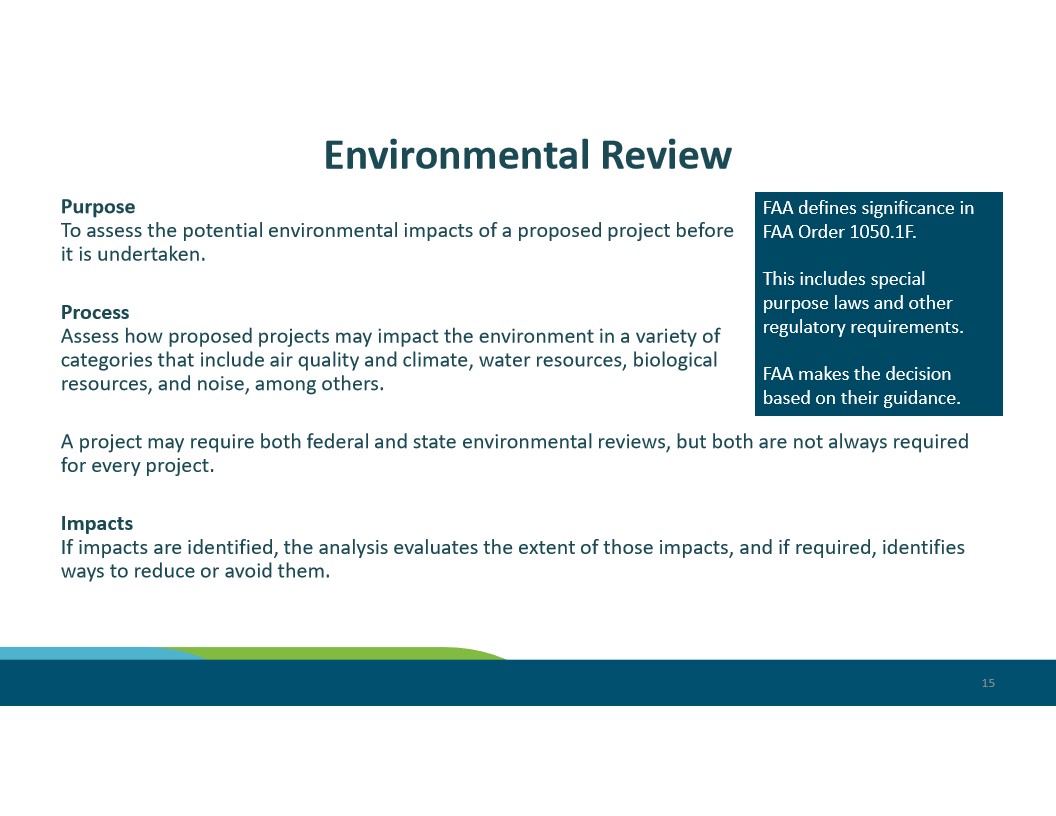
Slide 15 from a presentation explaining the FAA environmental review process, referencing FAA Order 1050.1F as the governing document for defining significance. It outlines the purpose, process (covering air quality, water resources, biological resources, and noise), and impact mitigation requirements for proposed airport projects.
Slide 14 from a Port of Seattle presentation titled ‘SAMP Near-Term Projects Environmental Review,’ covering Draft NEPA Environmental Assessment Findings and Next Steps. The Port of Seattle logo is visible, indicating this is an official Port document related to the Seattle-Tacoma International Airport Master Plan (SAMP) environmental review process.
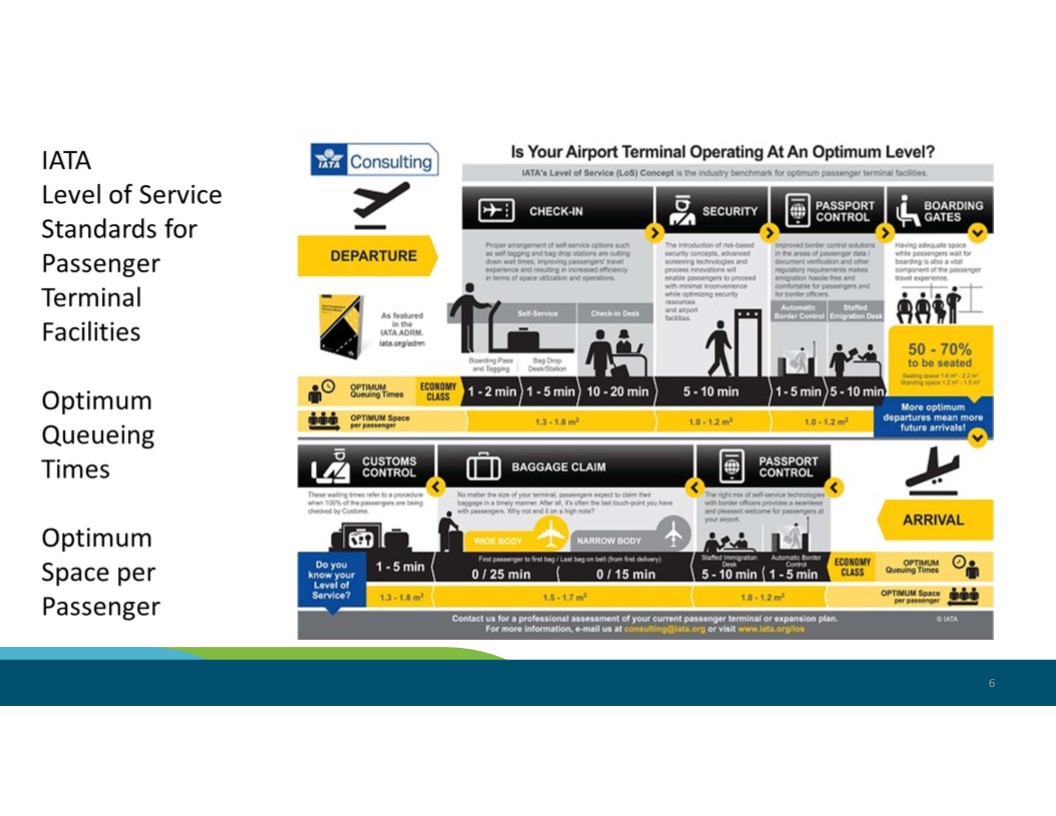
An IATA Consulting infographic titled ‘Is Your Airport Terminal Operating At An Optimum Level?’ outlining the IATA Level of Service (LoS) concept for passenger terminal facilities, including optimum queueing times and space-per-passenger standards for departure and arrival processes such as check-in, security, passport control, baggage claim, and customs. The slide references IATA’s Airport Development Reference Manual (ADRM) at iata.org/adrm.
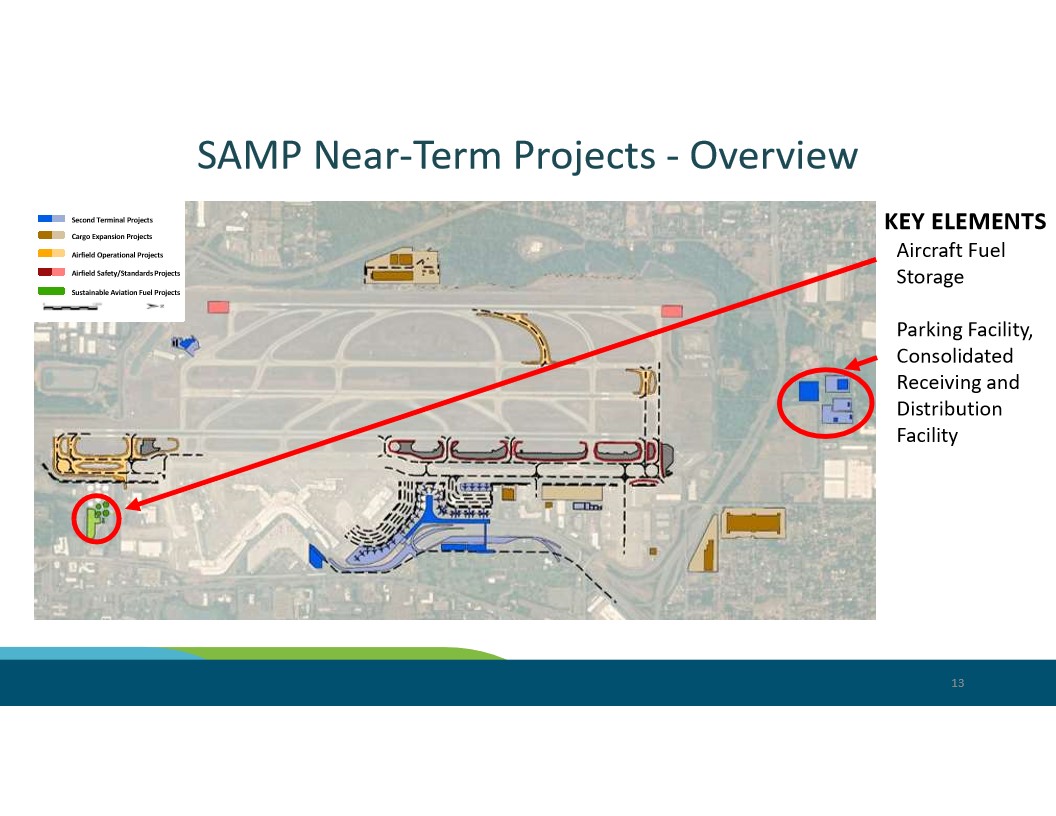
Presentation slide 13 titled ‘SAMP Near-Term Projects – Overview’ showing an aerial map of Seattle-Tacoma International Airport with color-coded project categories including Second Terminal Projects, Cargo Expansion Projects, Airfield Operational Projects, Airfield Safety/Standards Projects, and Sustainable Aviation Fuel Projects. Key elements highlighted include Aircraft Fuel Storage and a Parking Facility/Consolidated Receiving and Distribution Facility, indicated by red arrows and circles on the map.
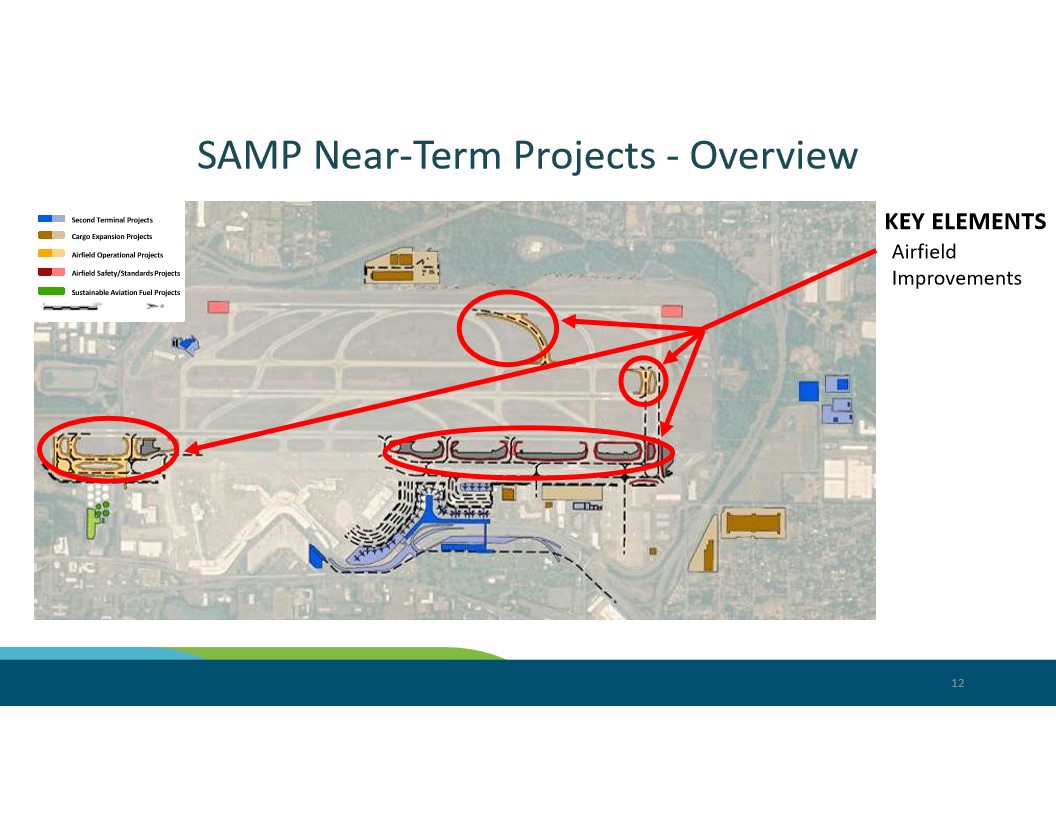
Slide 12 from a Seattle-Tacoma International Airport Strategic Airport Master Plan (SAMP) presentation, showing an aerial map with near-term capital projects highlighted by category including Second Terminal Projects, Cargo Expansion Projects, Airfield Operational Projects, Airfield Safety/Standards Projects, and Sustainable Aviation Fuel Projects. Key elements called out with red circles and arrows include Airfield Improvements located on the airfield and terminal areas.
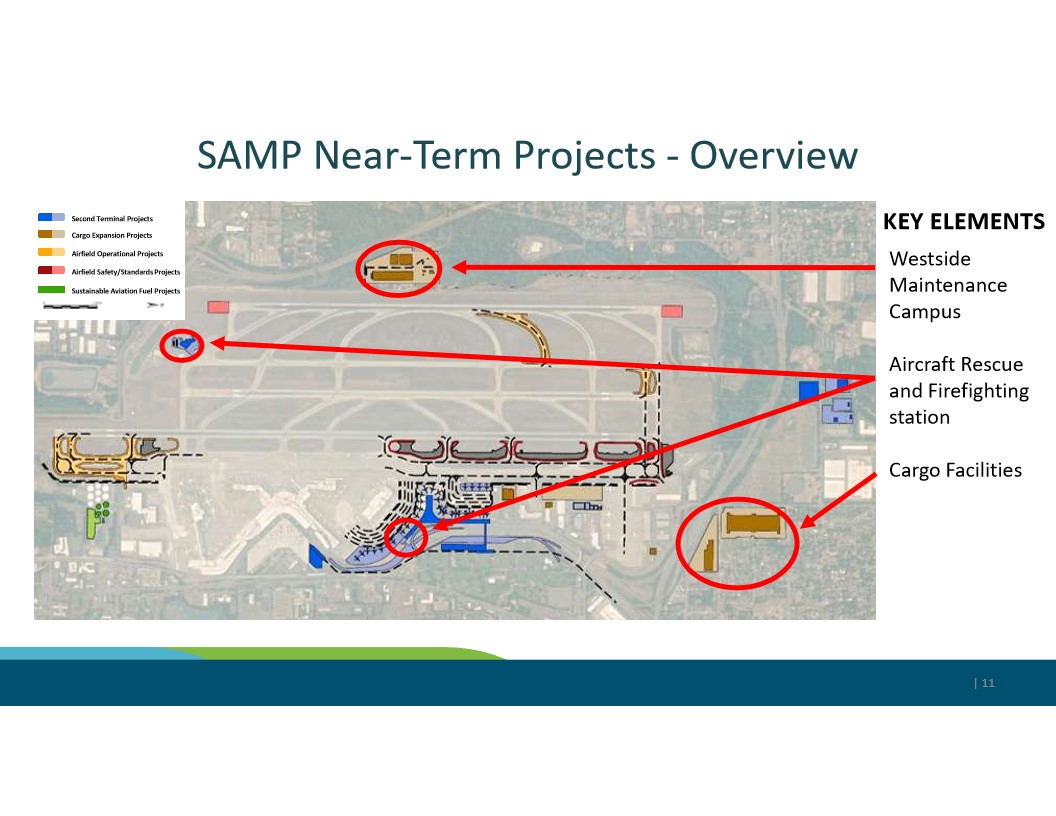
Slide 11 from a Seattle-Tacoma International Airport Strategic Airport Master Plan (SAMP) presentation, showing an aerial map of near-term capital projects. Key elements identified include a Westside Maintenance Campus, Aircraft Rescue and Firefighting Station, and Cargo Facilities, with color-coded categories for Second Terminal, Cargo Expansion, Airfield Operational, Airfield Safety/Standards, and Sustainable Aviation Fuel projects.
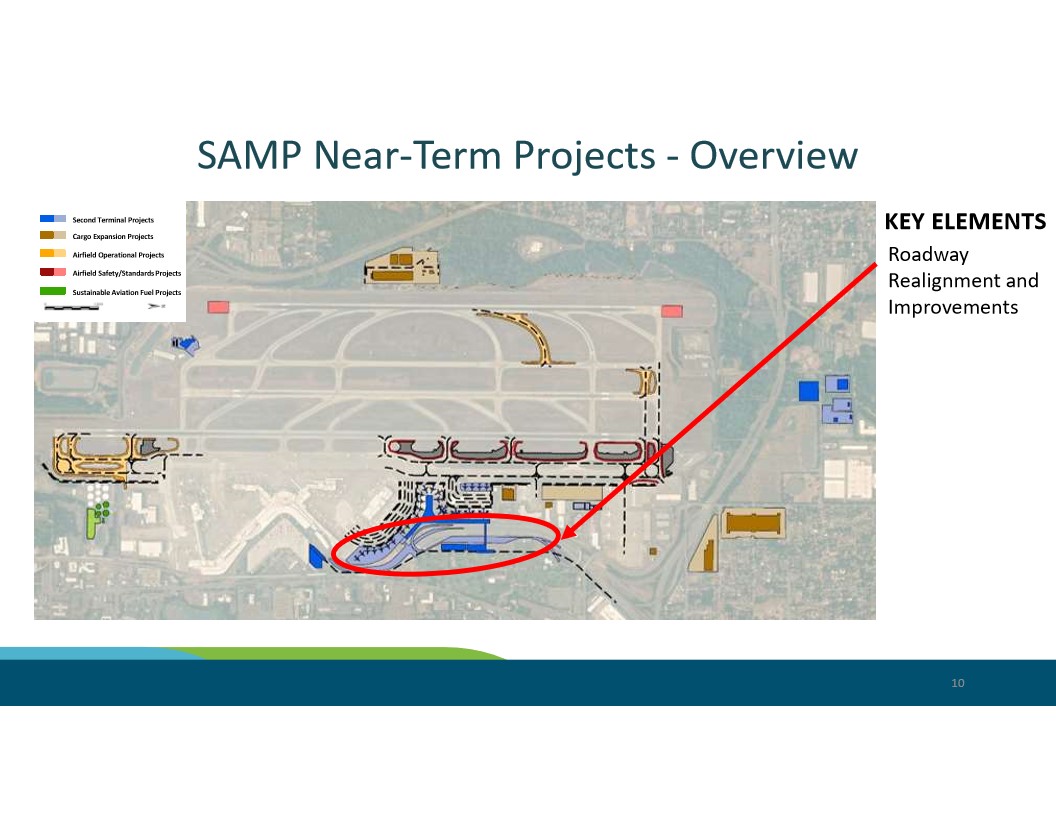
Presentation slide 10 titled ‘SAMP Near-Term Projects – Overview’ showing an aerial map of Seattle-Tacoma International Airport with color-coded project categories including Second Terminal Projects, Cargo Expansion Projects, Airfield Operational Projects, Airfield Safety/Standards Projects, and Sustainable Aviation Fuel Projects. A red arrow and circle highlight the terminal area, with ‘Roadway Realignment and Improvements’ identified as a key element.
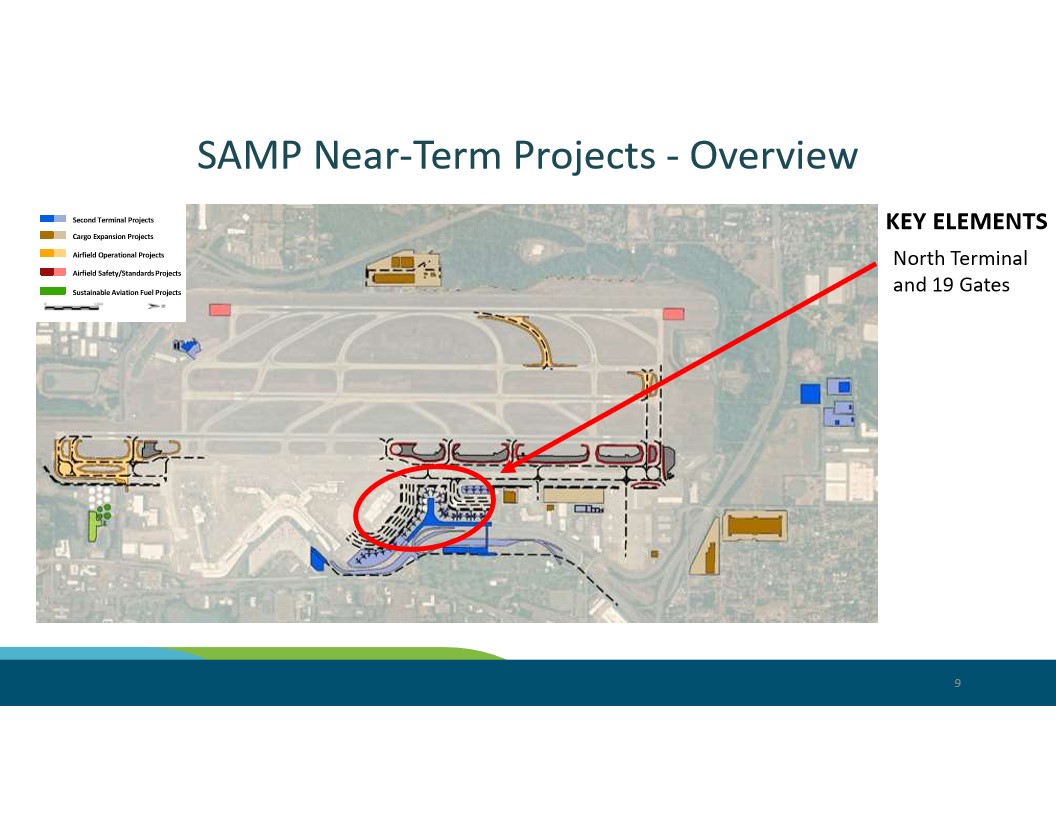
Slide 9 from a Seattle-Tacoma International Airport Strategic Airport Master Plan (SAMP) presentation, showing an aerial map of near-term capital projects color-coded by category (Second Terminal, Cargo Expansion, Airfield Operational, Airfield Safety/Standards, and Sustainable Aviation Fuel projects). A red arrow and circle highlight the key element of a new North Terminal with 19 gates.
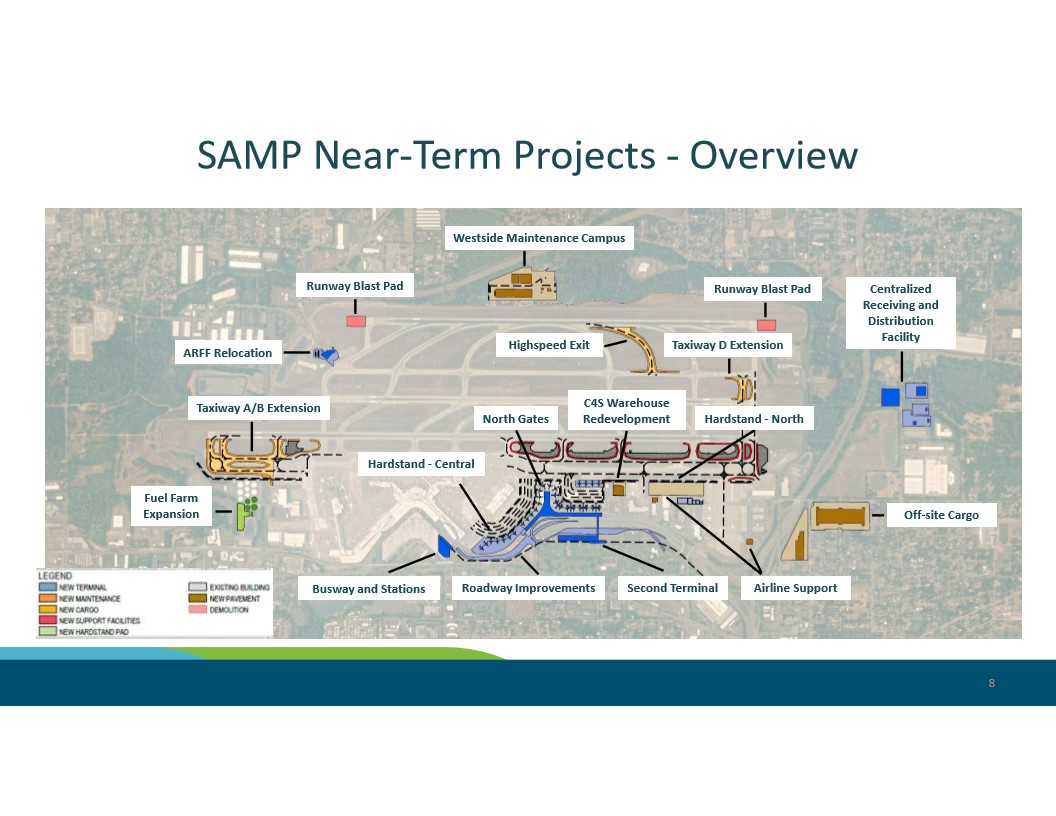
Slide 8 from a Seattle-Tacoma International Airport Strategic Airport Master Plan (SAMP) presentation, showing an aerial map of near-term capital projects including a Second Terminal, North Gates, Taxiway A/B and D extensions, Runway Blast Pads, Busway and Stations, Roadway Improvements, Fuel Farm Expansion, ARFF Relocation, Westside Maintenance Campus, and Off-site Cargo facilities. The legend distinguishes new terminal, maintenance, cargo, support facilities, hardstand pad, existing buildings, new pavement, and demolition areas.
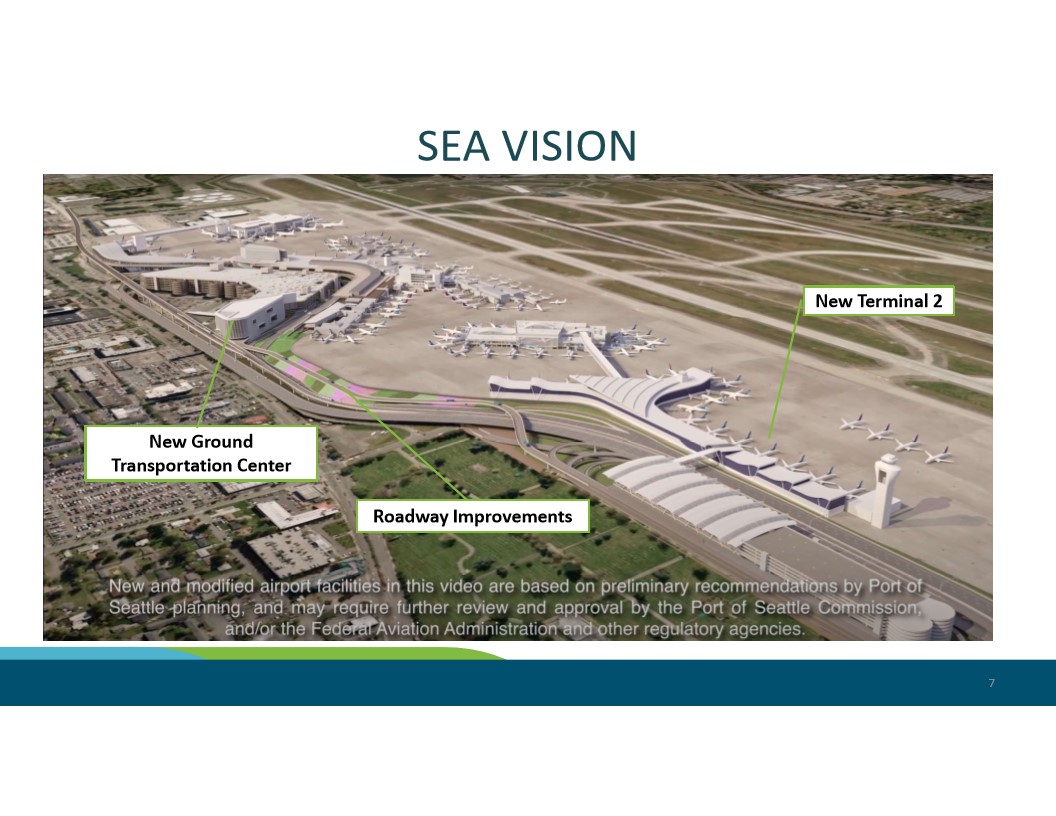
A Port of Seattle presentation slide titled ‘SEA VISION’ (slide 7) showing an aerial rendering of proposed future development at Seattle-Tacoma International Airport, including a New Terminal 2, a New Ground Transportation Center, and Roadway Improvements. A disclaimer notes that the facilities are based on preliminary recommendations by Port of Seattle planning and may require further review by the Port of Seattle Commission, the FAA, and other regulatory agencies.
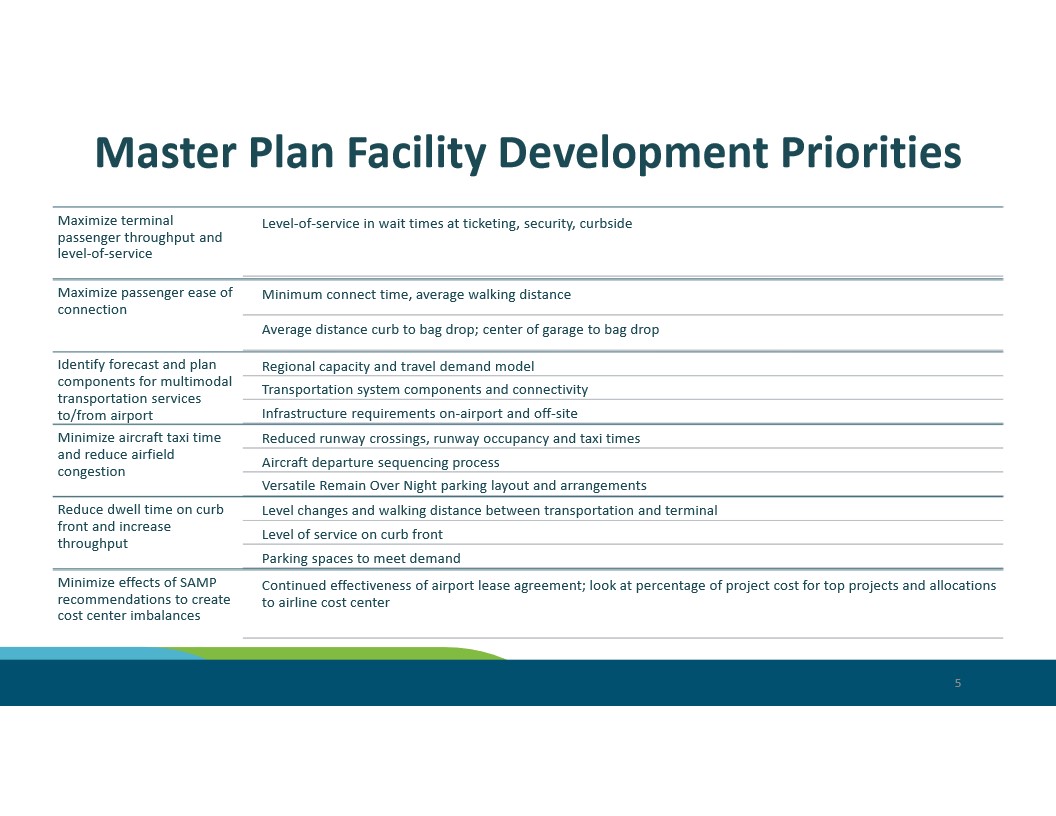
A presentation slide titled ‘Master Plan Facility Development Priorities’ outlining airport planning objectives including maximizing terminal passenger throughput, ease of connection, multimodal transportation, minimizing aircraft taxi time, reducing curb front dwell time, and minimizing cost center imbalances from SAMP recommendations. No specific airport name, date, or organization logo is visible in the image.
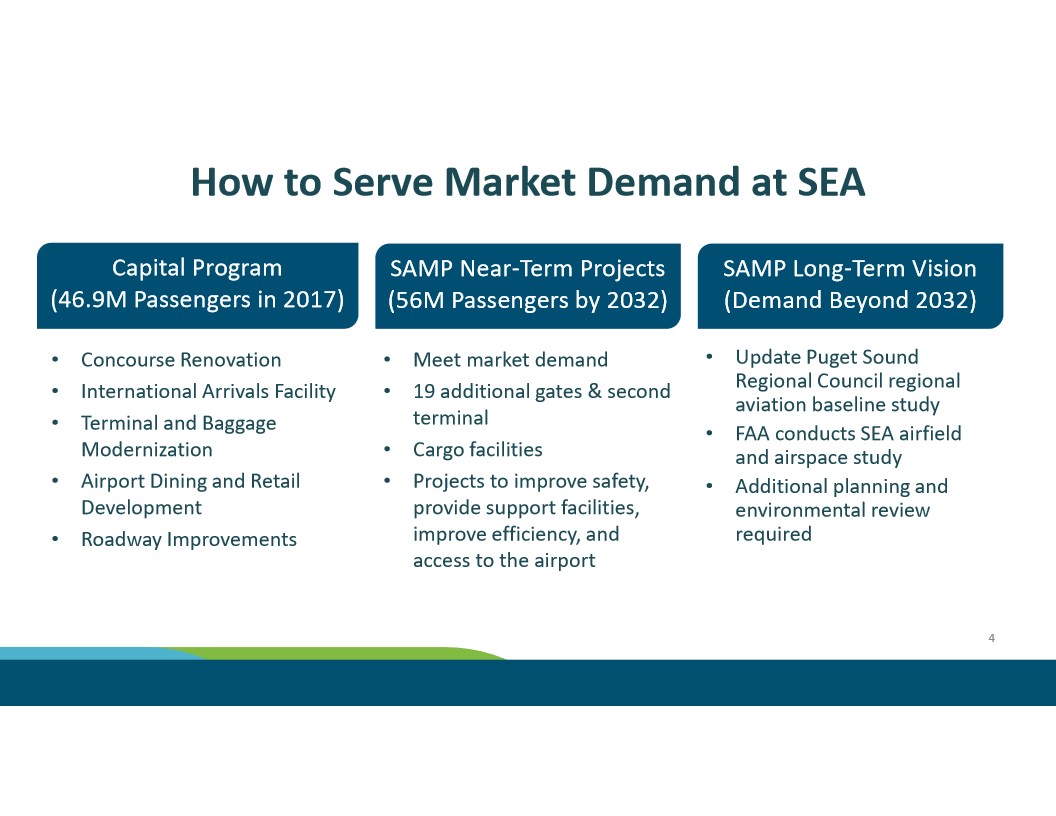
A presentation slide titled ‘How to Serve Market Demand at SEA’ outlining Seattle-Tacoma International Airport’s three-phase capacity strategy: the Capital Program serving 46.9M passengers in 2017, SAMP Near-Term Projects targeting 56M passengers by 2032 (including 19 additional gates and a second terminal), and a SAMP Long-Term Vision for demand beyond 2032 involving FAA airfield studies and environmental review.
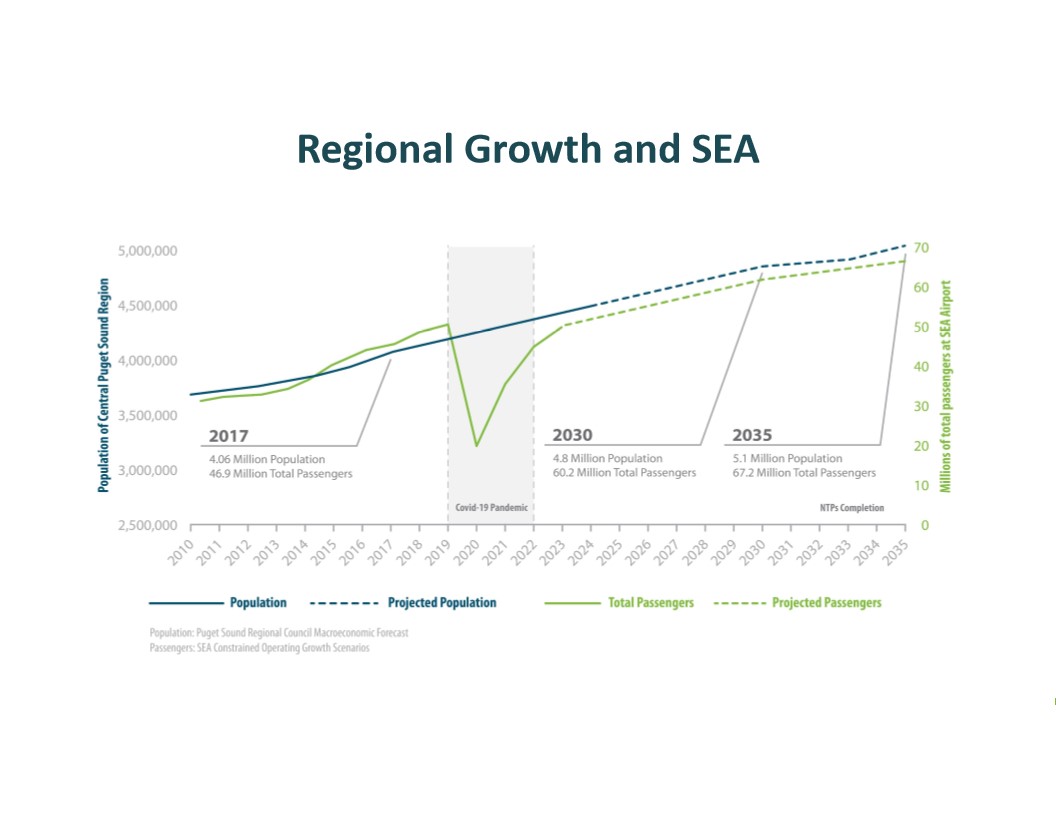
This chart from a Sea-Tac Airport (SEA) planning document shows the correlation between Central Puget Sound regional population growth and total passenger volumes from 2010 through 2035, including the COVID-19 pandemic dip. Key data points include 46.9 million passengers and 4.06 million population in 2017, with projections of 60.2 million passengers and 4.8 million population by 2030, and 67.2 million passengers and 5.1 million population by 2035 following NTPs Completion.
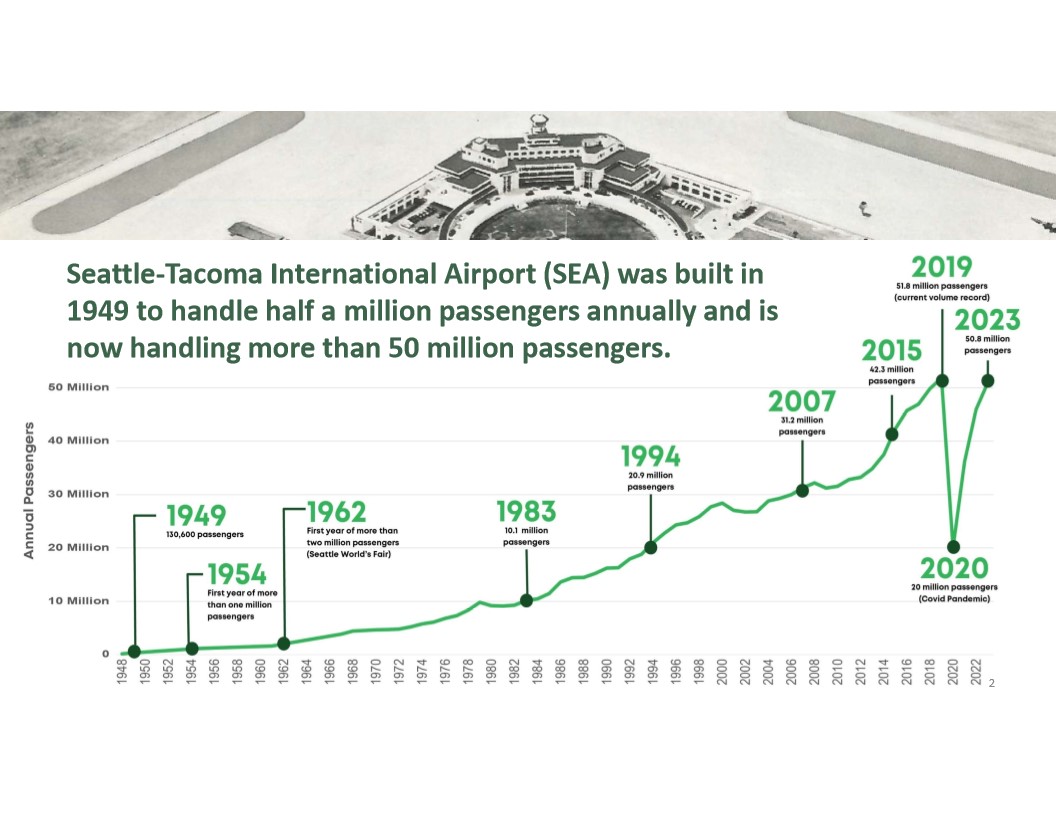
An infographic chronicling annual passenger volume at Seattle-Tacoma International Airport (SEA) from its 1949 opening (130,600 passengers) through 2023 (50.8 million passengers), highlighting milestones such as the 1962 Seattle World’s Fair surge, the 2019 record of 51.8 million passengers, and the COVID-19 pandemic drop to 20 million in 2020. A historic aerial photograph of the original terminal building appears at the top.
Title slide for a Port of Seattle commission presentation dated October 22, 2024, agenda Item No. 11a supp, covering Sustainable Airport Master Plan Near-Term Projects at Seattle-Tacoma International Airport.
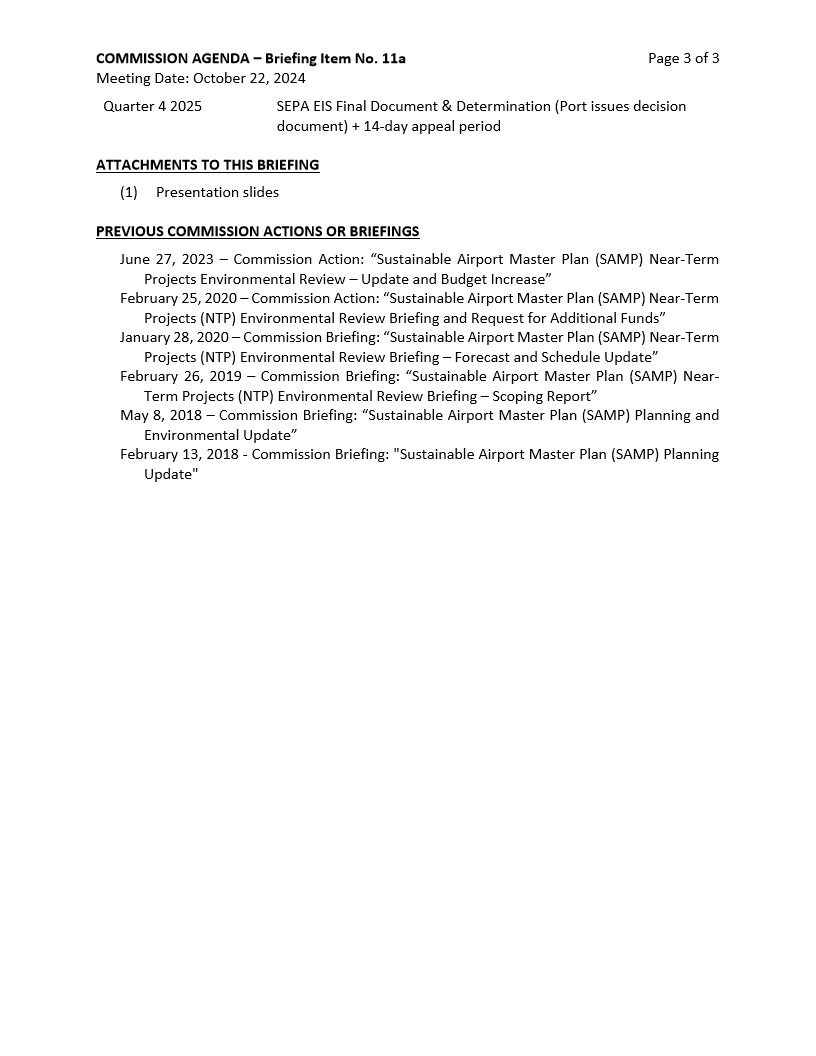
This is page 3 of 3 of a Port of Seattle Commission Agenda briefing document dated October 22, 2024, covering the Sustainable Airport Master Plan (SAMP) Near-Term Projects Environmental Review. It lists a Quarter 4 2025 milestone for the SEPA EIS Final Document and Decision, one attachment (presentation slides), and six previous Commission actions or briefings on SAMP dating from February 2018 through June 2023.
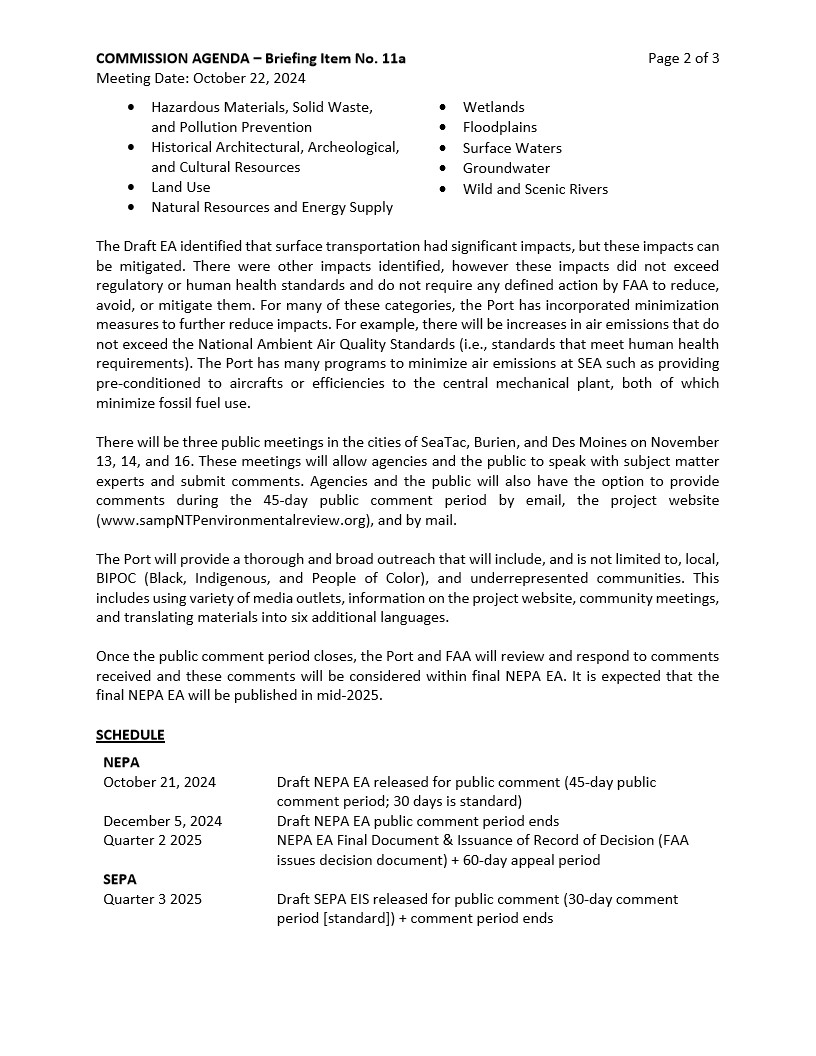
Page 2 of 3 from Commission Agenda Briefing Item No. 11a, dated October 22, 2024, summarizing the Draft Environmental Assessment for Sea-Tac Airport (SEA) surface transportation impacts and outlining the public comment schedule, including the Draft NEPA EA released October 21, 2024 with a 45-day comment period closing December 5, 2024, and public meetings in SeaTac, Burien, and Des Moines on November 13, 14, and 16.
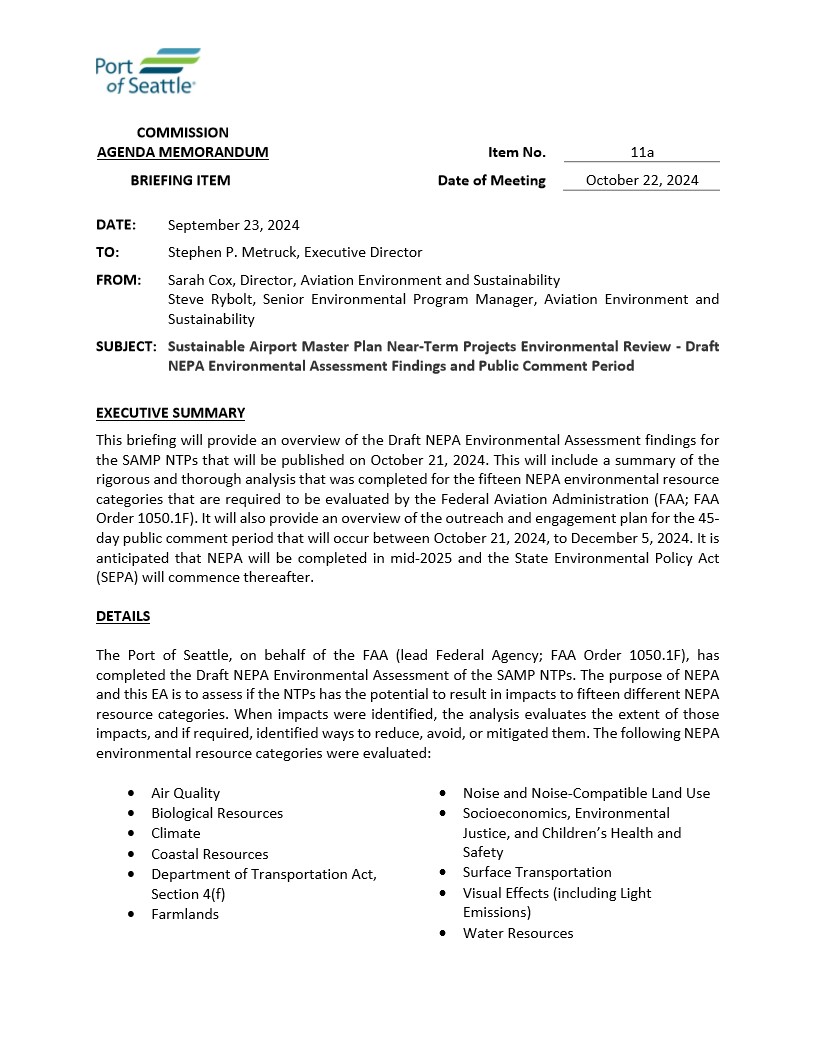
A Port of Seattle Commission Agenda Memorandum (Item 11a, meeting date October 22, 2024), authored by Sarah Cox and Steve Rybolt of Aviation Environment and Sustainability and addressed to Executive Director Stephen P. Metruck, summarizing the Draft NEPA Environmental Assessment findings for the Sustainable Airport Master Plan Near-Term Projects and announcing a 45-day public comment period from October 21 to December 5, 2024.
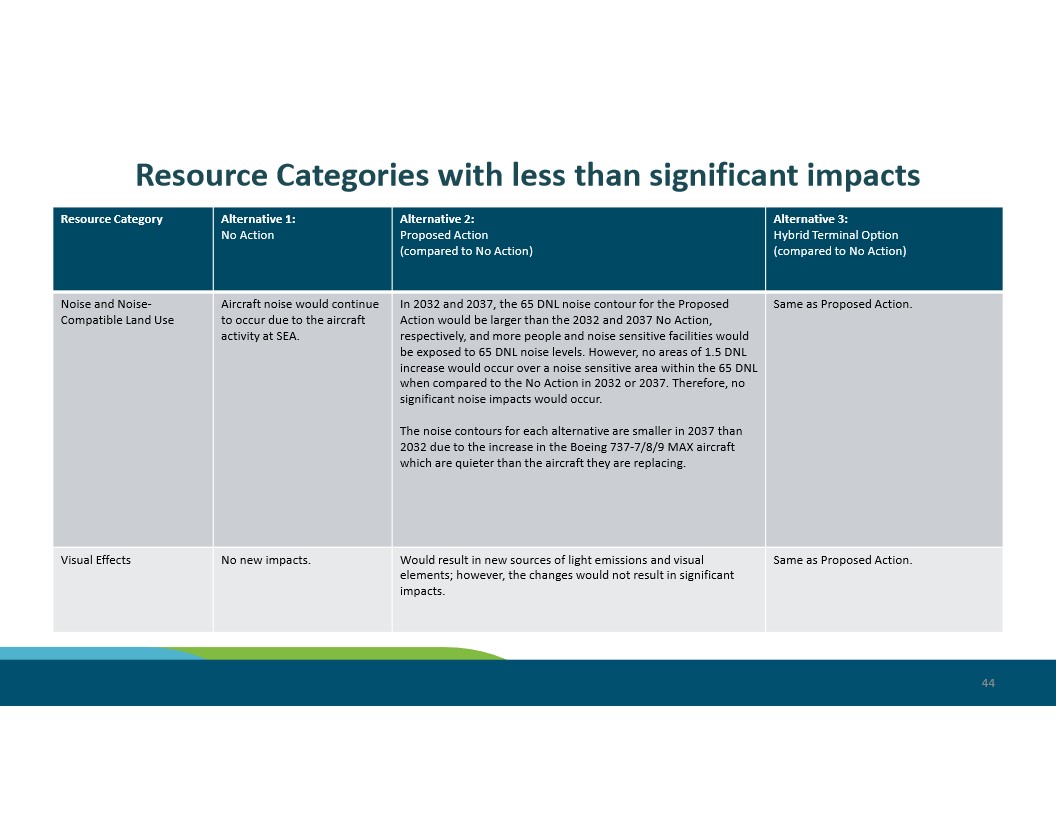
Slide 44 from a Sea-Tac Airport (SEA) Environmental Impact Statement presentation comparing noise and visual effects impacts across three alternatives: No Action, Proposed Action, and Hybrid Terminal Option. Key findings indicate that while the 65 DNL noise contour would be larger under the Proposed Action in 2032 and 2037, no significant noise impacts would occur, and noise contours shrink by 2037 due to quieter Boeing 737 MAX aircraft.
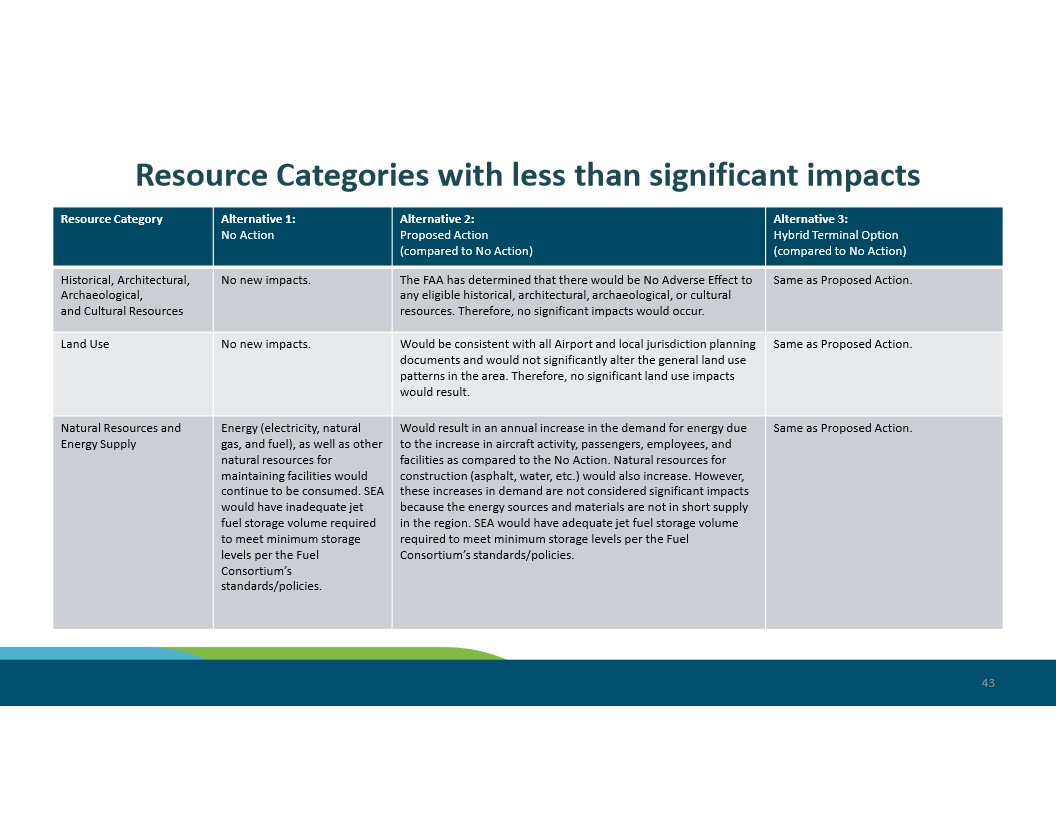
Slide 43 from a Seattle-Tacoma International Airport (SEA) environmental impact document compares three alternatives — No Action, Proposed Action, and Hybrid Terminal Option — across resource categories including Historical/Archaeological/Cultural Resources, Land Use, and Natural Resources and Energy Supply. The FAA determined no adverse effects to historical or cultural resources under the Proposed Action, and noted that SEA would have adequate jet fuel storage under Alternatives 2 and 3 but inadequate storage under the No Action alternative.
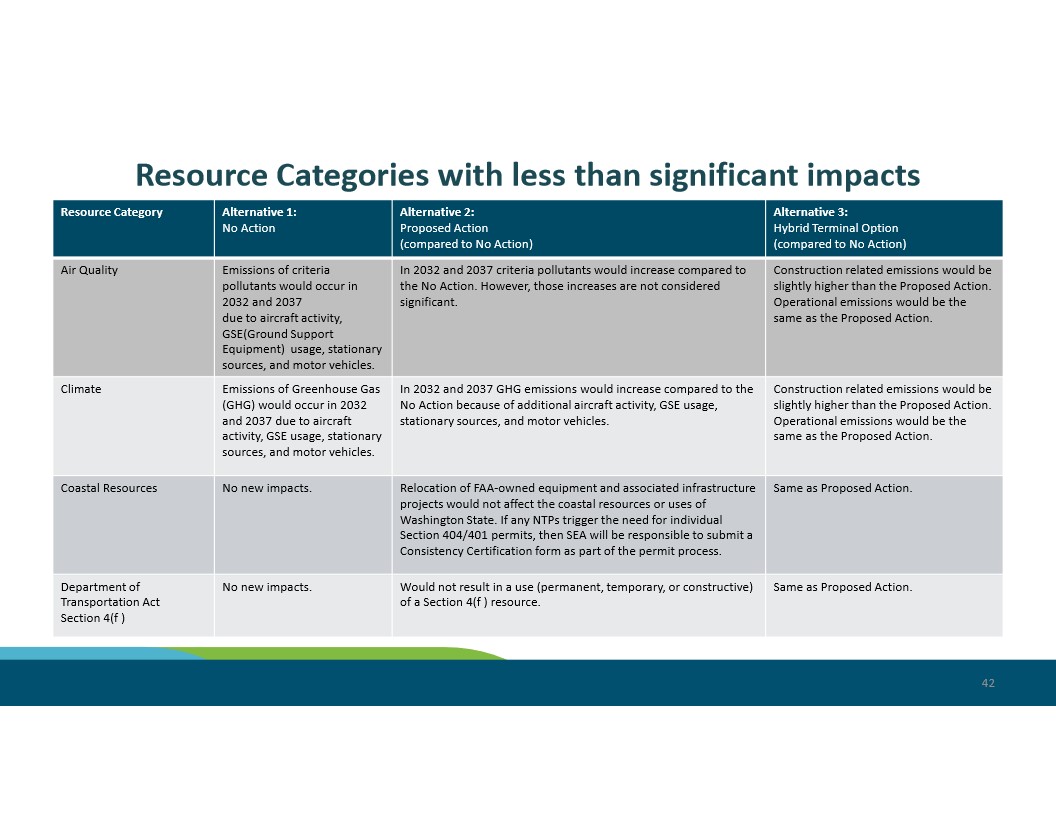
Slide 42 from a Sea-Tac Airport environmental review presentation comparing impacts across three alternatives (No Action, Proposed Action, and Hybrid Terminal Option) for resource categories including Air Quality, Climate, Coastal Resources, and Department of Transportation Act Section 4(f). The slide indicates that criteria pollutant and GHG emissions would increase under Alternatives 2 and 3 compared to No Action but are not considered significant, and that Coastal Resources and Section 4(f) resources would not be adversely affected.
A teal-background section divider slide bearing the heading ‘Additional Information’ in white text, numbered page 41. The slide uses a color-bar footer in light blue and green consistent with a corporate or governmental presentation template.
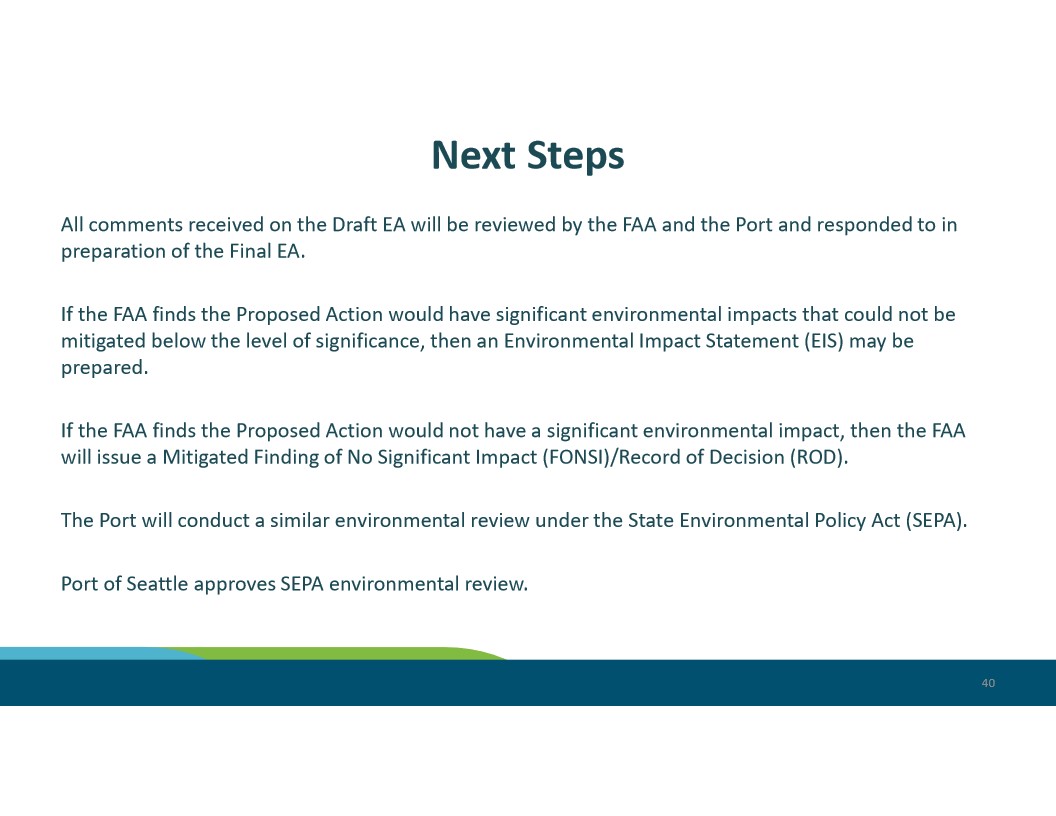
This presentation slide outlines the next steps in the FAA and Port of Seattle environmental review process for a proposed action at Sea-Tac Airport. Steps include FAA review of Draft EA comments, potential preparation of an Environmental Impact Statement (EIS) or issuance of a Mitigated FONSI/ROD, and Port of Seattle SEPA environmental review approval.
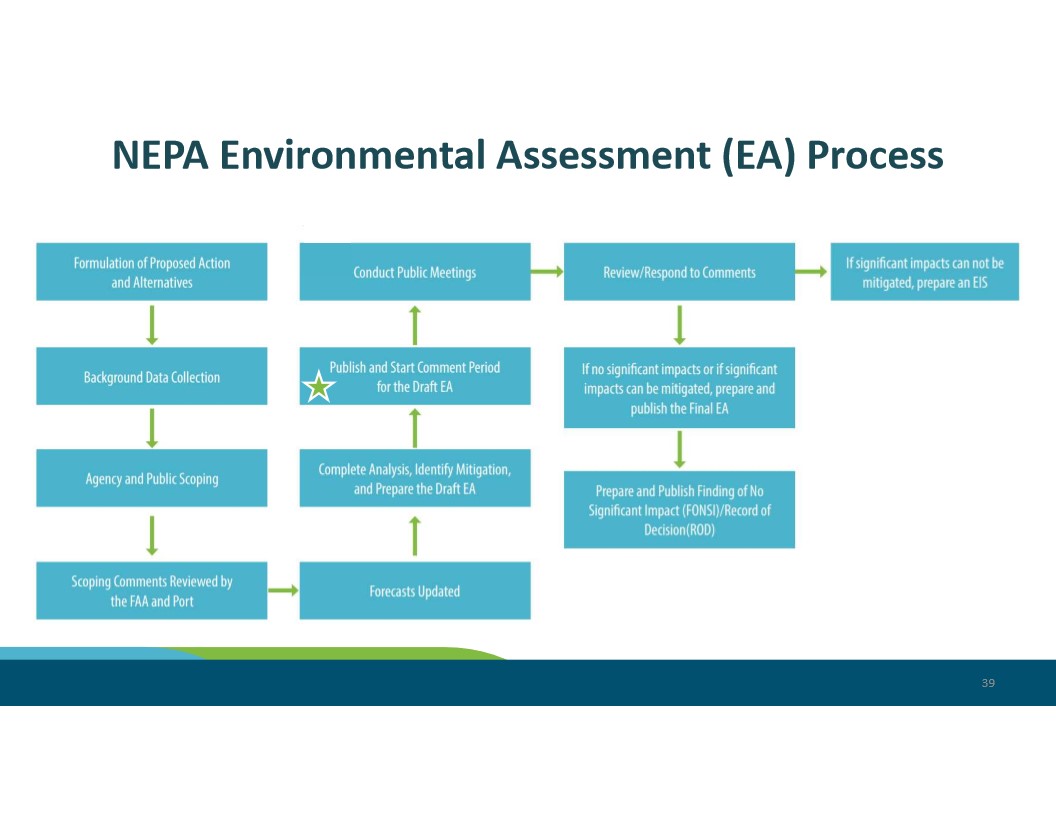
This slide (page 39) depicts the step-by-step NEPA Environmental Assessment process, beginning with Formulation of Proposed Action and Alternatives and proceeding through Background Data Collection, Agency and Public Scoping, Forecasts Updated, Draft EA preparation, public comment period, and culminating in either a Finding of No Significant Impact (FONSI)/Record of Decision (ROD) or, if significant impacts cannot be mitigated, preparation of an Environmental Impact Statement (EIS). A star icon marks the current status at the ‘Publish and Start Comment Period for the Draft EA’ step.
Slide 38 from a Port of Seattle presentation announcing the 30-day public notice (September 20) and 45-day public comment period (October 21 – December 5, 2024) for the Seattle-Tacoma International Airport Sustainable Airport Master Plan (SAMP) environmental review. Public meetings are listed for Federal Way, Des Moines, SeaTac, and Burien in November 2024, with comments directed to Mr. Steve Rybolt at SAMP@portseattle.org or via the project website sampntpenvironmentalreview.org.
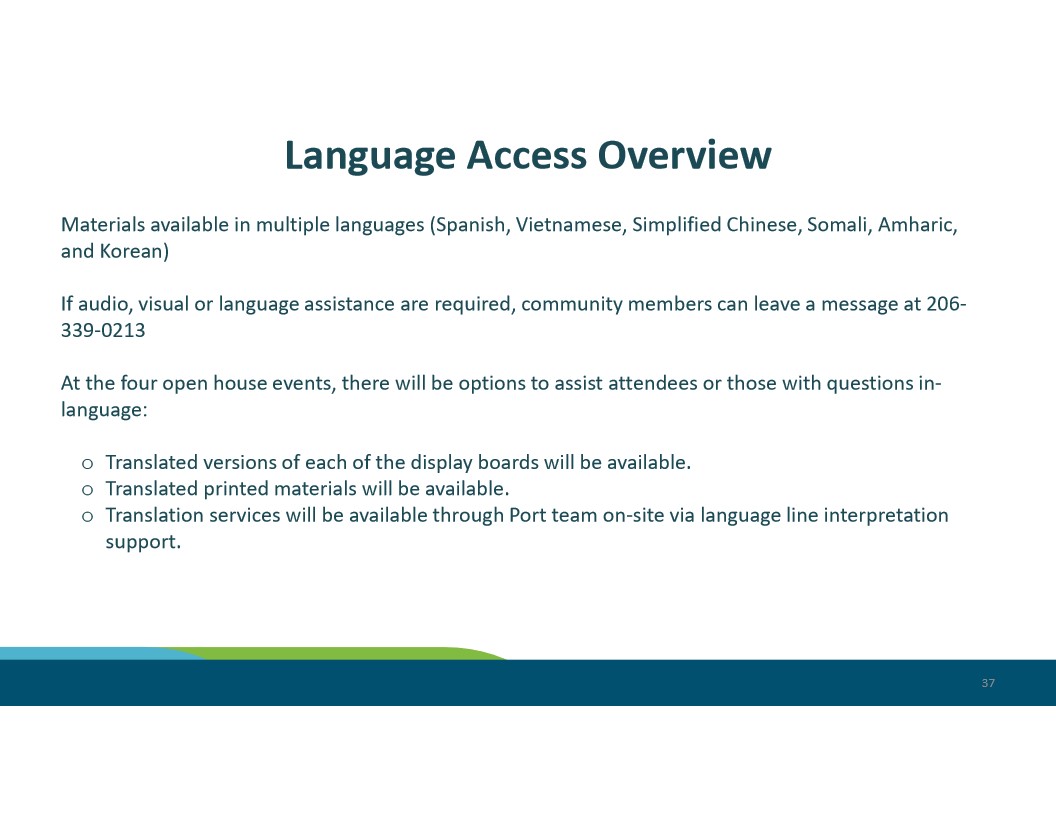
Slide 37 from a Port of Seattle presentation outlines language access provisions for Sea-Tac Airport community open house events, noting materials available in Spanish, Vietnamese, Simplified Chinese, Somali, Amharic, and Korean. Community members requiring audio, visual, or language assistance could call 206-339-0213, and on-site language line interpretation support was offered at four open house events.
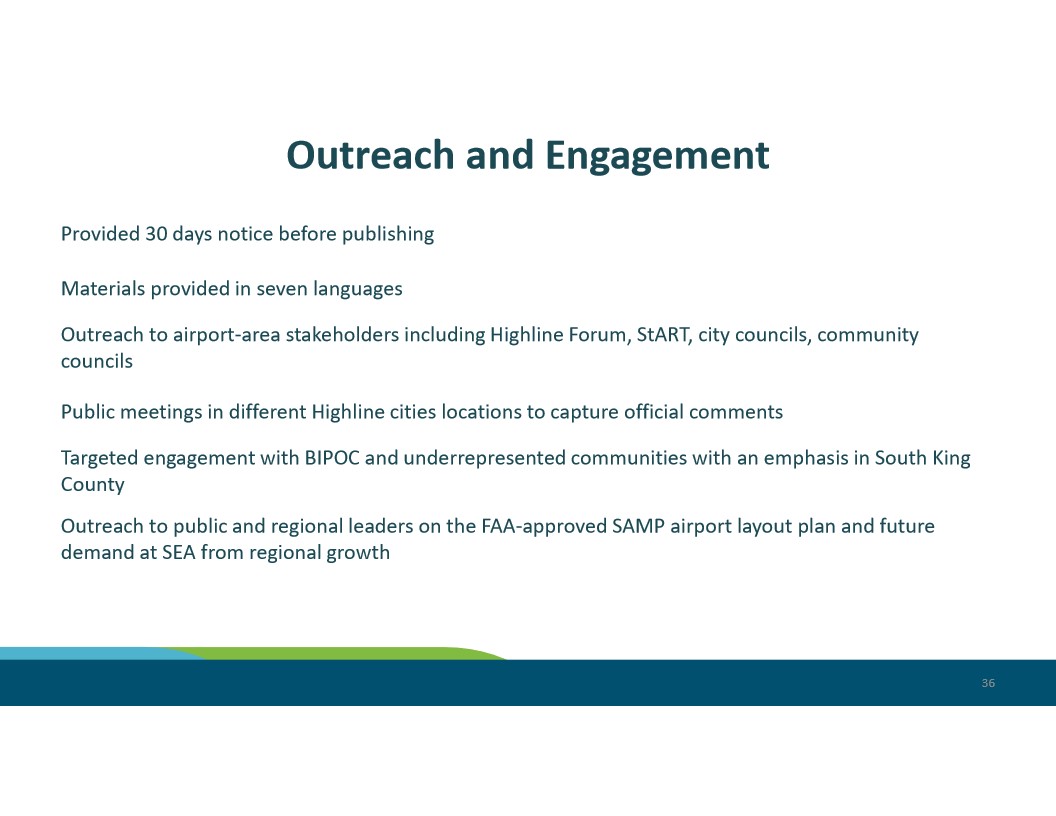
Slide 36 from a Sea-Tac Airport (SEA) presentation summarizing public outreach and engagement efforts related to the FAA-approved SAMP (Sustainable Airport Master Plan) airport layout plan. Activities included 30-day advance notice, materials in seven languages, stakeholder outreach to the Highline Forum and StART, public meetings in Highline cities, targeted engagement with BIPOC and underrepresented communities in South King County, and outreach to regional leaders on future airport demand.
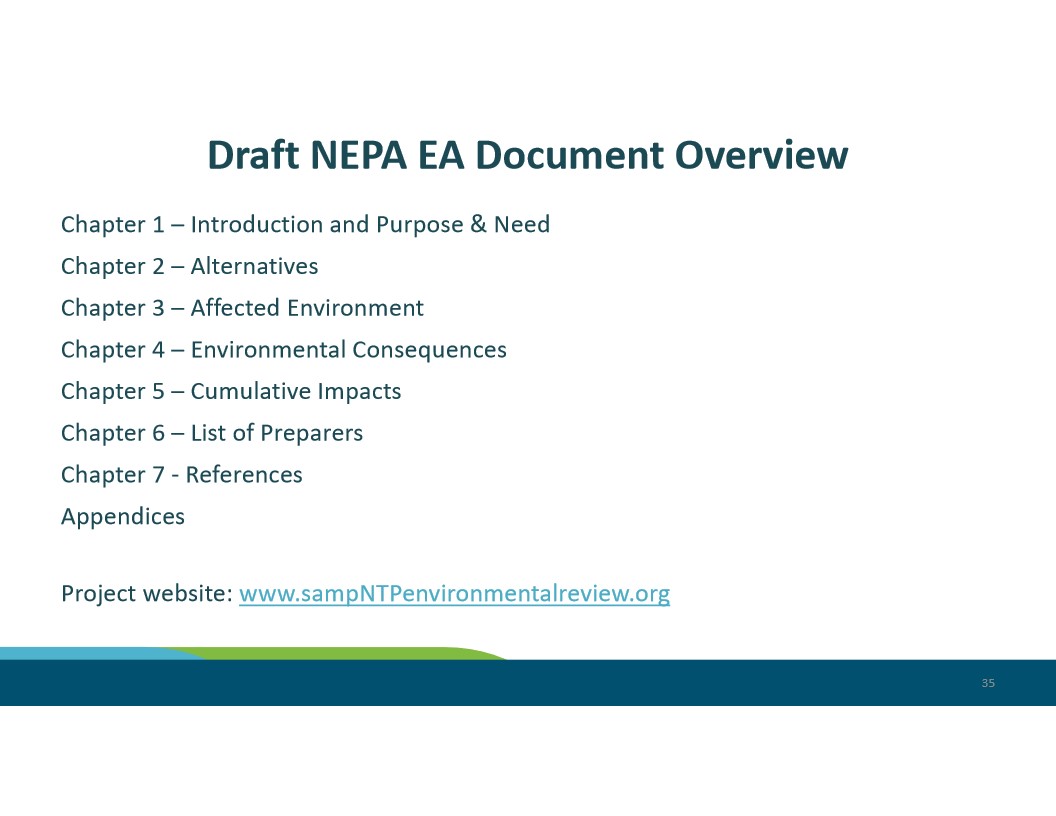
Slide 35 presents the chapter structure of the Draft NEPA Environmental Assessment (EA) document for the SAMP-NTP project, covering Introduction/Purpose & Need, Alternatives, Affected Environment, Environmental Consequences, Cumulative Impacts, List of Preparers, References, and Appendices. The project website is listed as www.sampNTPenvironmentalreview.org, indicating this is associated with Sea-Tac Airport’s Sustainable Airport Master Plan – Near-Term Projects environmental review process.
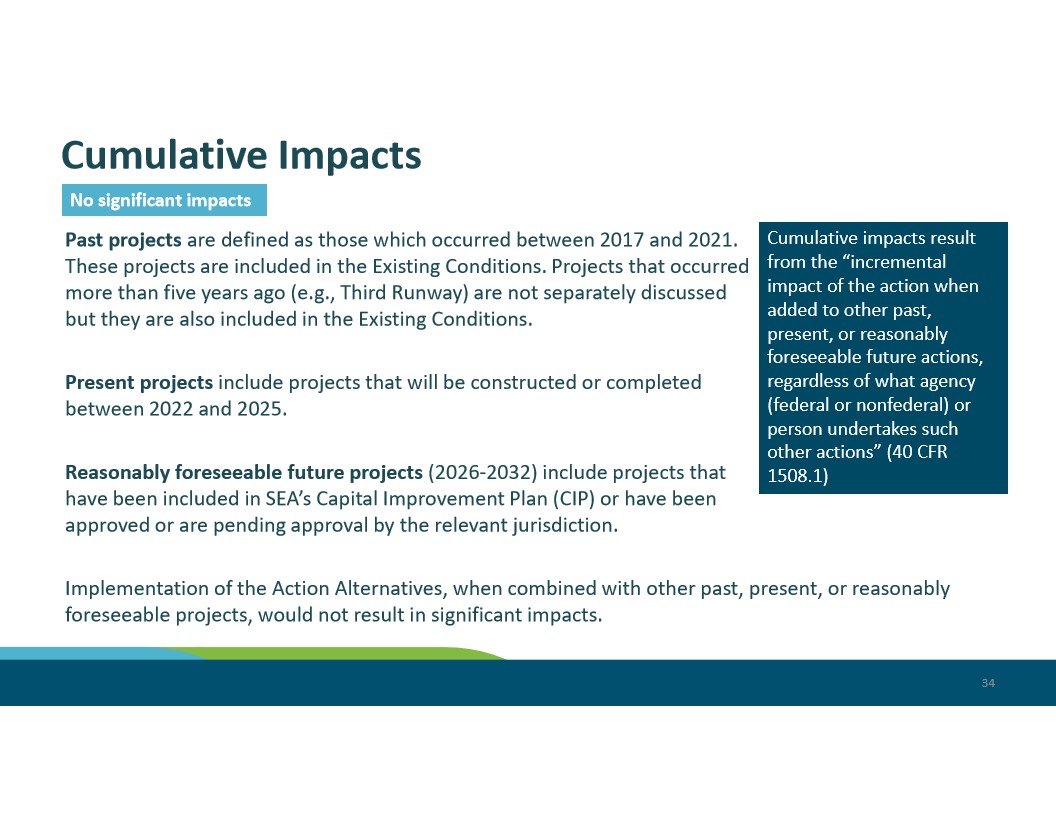
Slide 34 from a Seattle-Tacoma International Airport (SEA) environmental review presentation defines past (2017–2021), present (2022–2025), and reasonably foreseeable future (2026–2032) projects for cumulative impact analysis under 40 CFR 1508.1. It concludes that implementation of the Action Alternatives, combined with other past, present, or foreseeable projects, would not result in significant cumulative impacts.
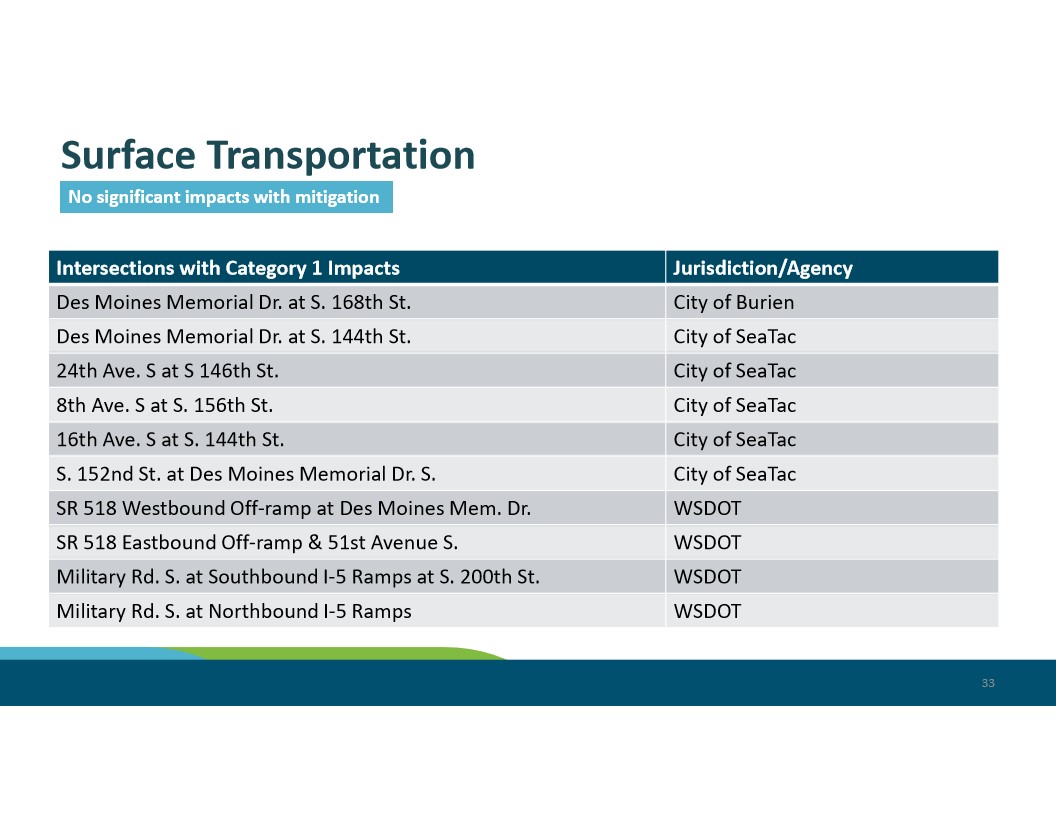
A presentation slide titled ‘Surface Transportation’ noting ‘No significant impacts with mitigation,’ listing ten intersections with Category 1 impacts and their jurisdictions, including the City of Burien, City of SeaTac, and WSDOT. Affected intersections include locations on Des Moines Memorial Drive, SR 518 ramps, and Military Road S. at I-5 ramps.
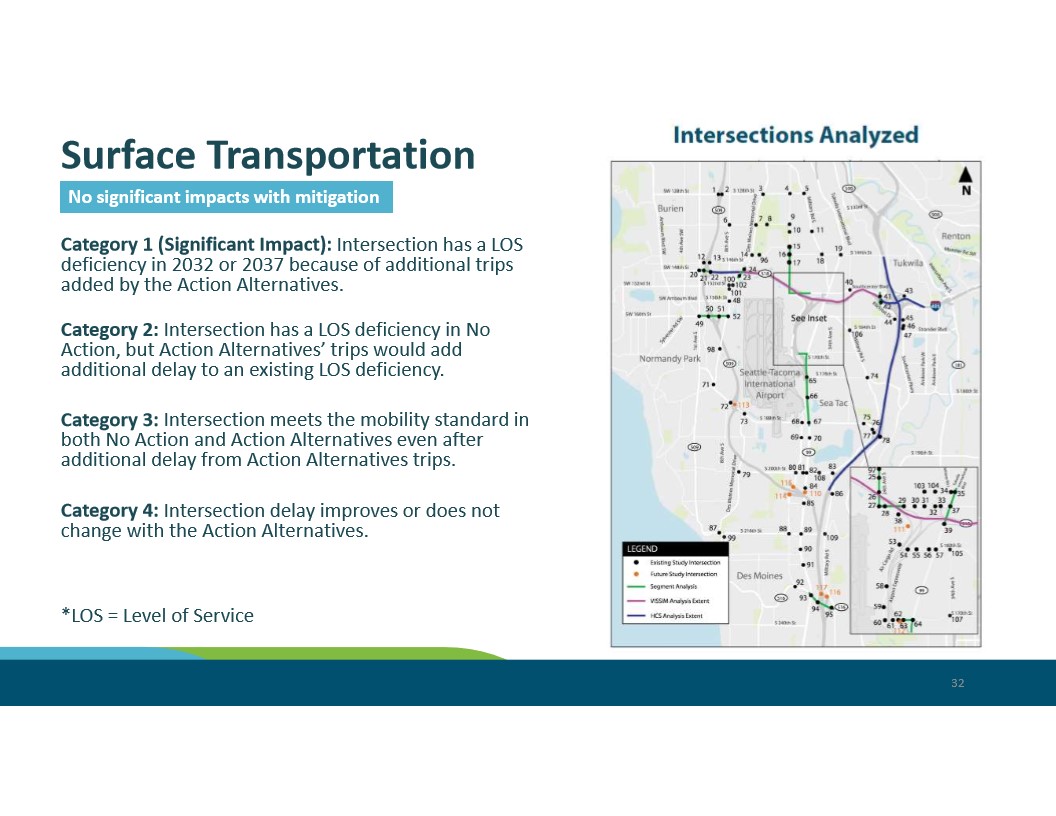
A presentation slide titled ‘Surface Transportation’ states ‘No significant impacts with mitigation’ and defines four categories of Level of Service (LOS) intersection impact for 2032 and 2037 Action Alternatives. The accompanying map shows numbered study intersections analyzed in the vicinity of Seattle-Tacoma International Airport, Des Moines, Burien, Tukwila, and Sea-Tac, with VISSIM and HCS analysis extents marked.
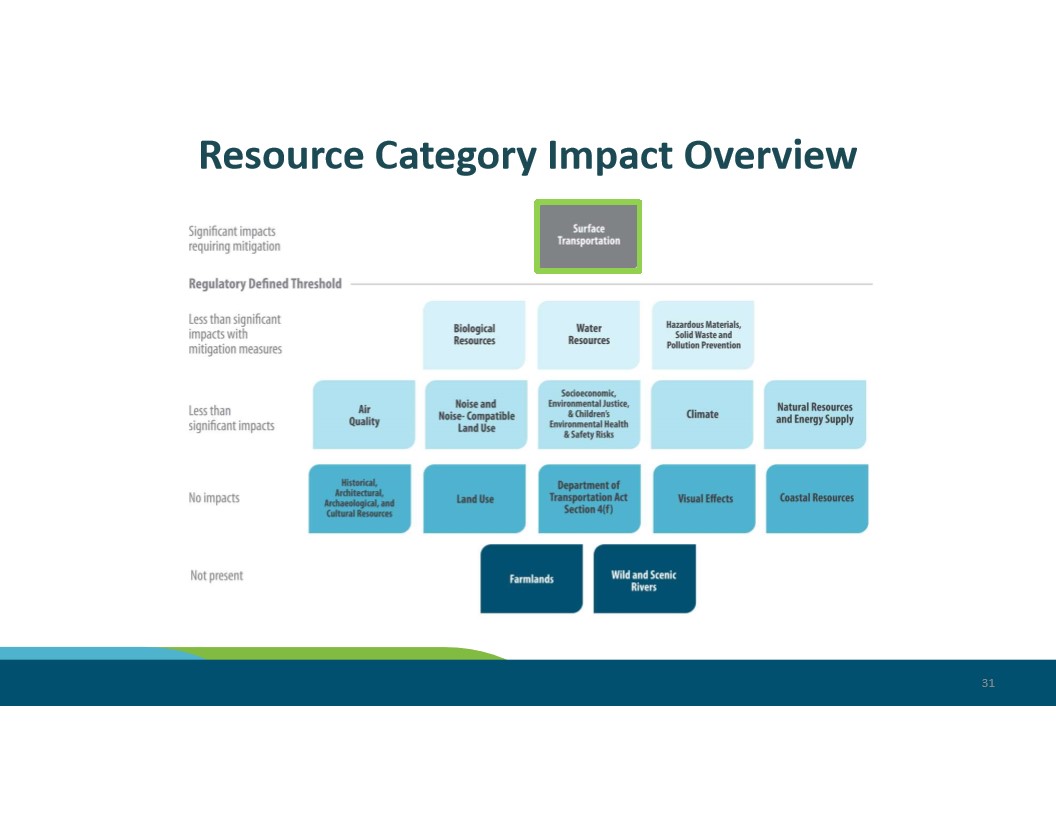
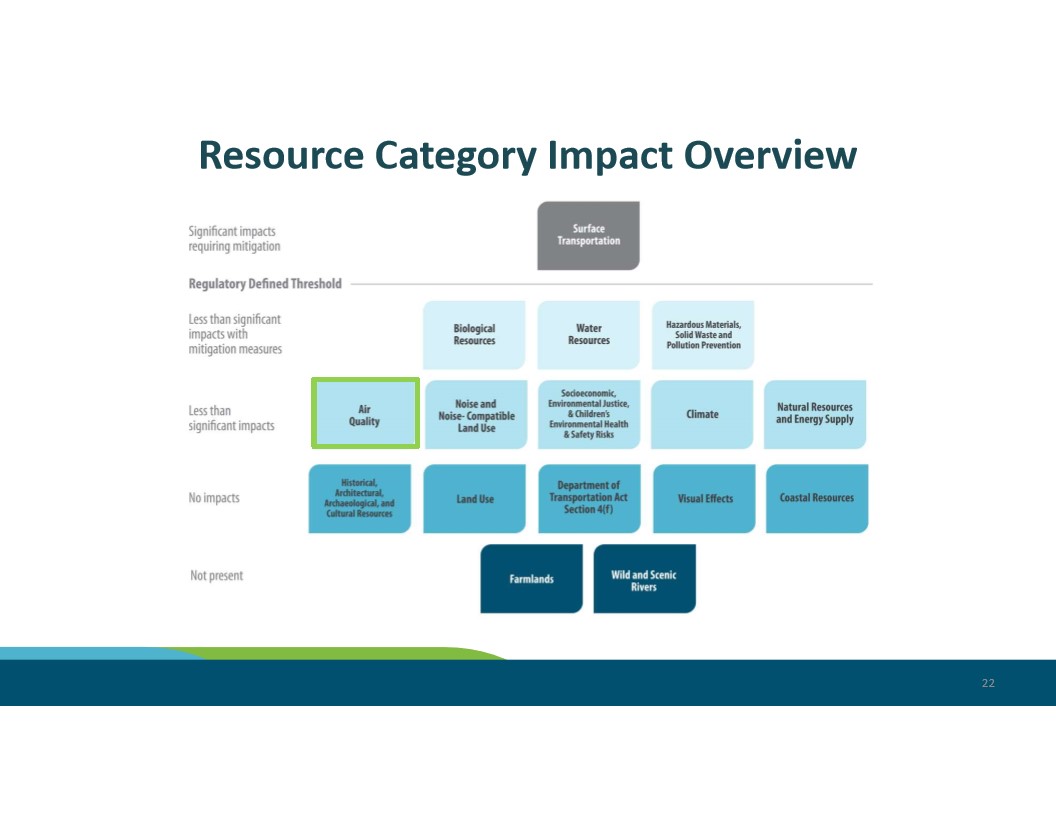
A presentation slide titled ‘Resource Category Impact Overview’ displaying a tiered matrix of environmental and transportation resource categories organized by impact level, ranging from ‘Significant impacts requiring mitigation’ (Surface Transportation) down through ‘Less than significant,’ ‘No impacts,’ and ‘Not present’ (Farmlands, Wild and Scenic Rivers). The slide appears to be from an environmental impact assessment or NEPA-related planning document, numbered page 31.
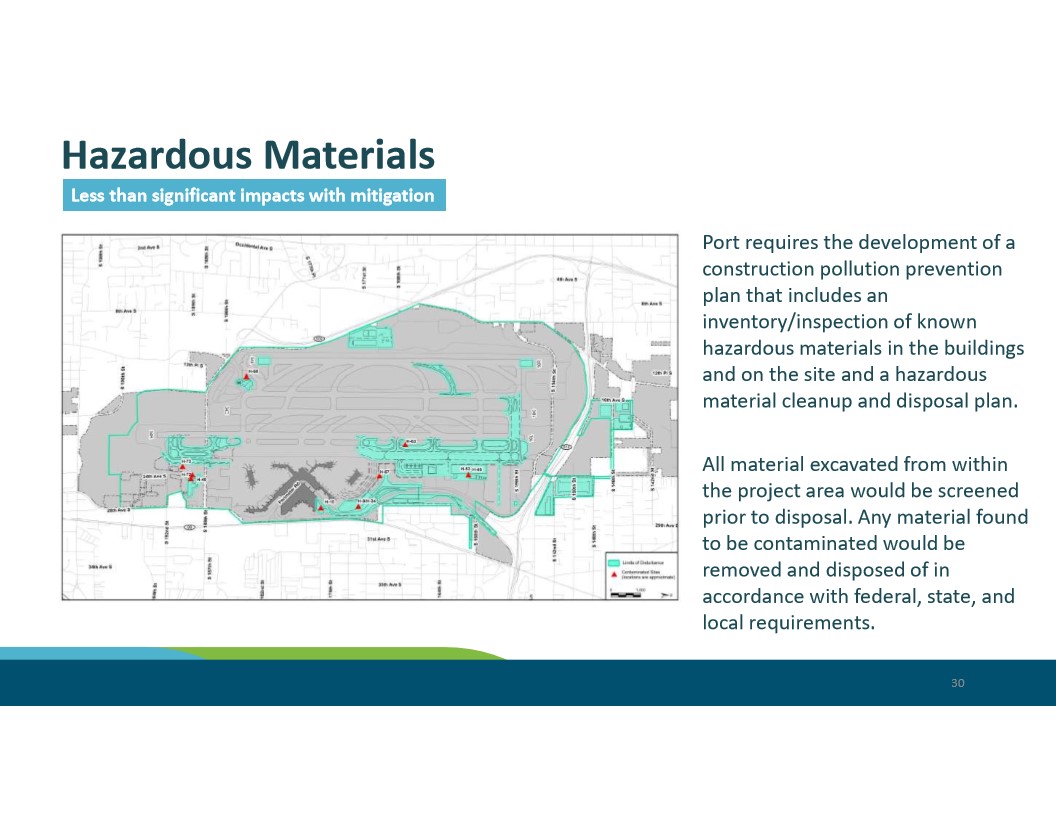
Presentation slide titled ‘Hazardous Materials’ classified as ‘Less than significant impacts with mitigation,’ describing Port requirements for a construction pollution prevention plan including inventory/inspection of known hazardous materials and a cleanup/disposal plan for the Sea-Tac Airport project area. A map shows the limits of disturbance and contaminated site locations (marked as approximate) within and around the airport footprint.
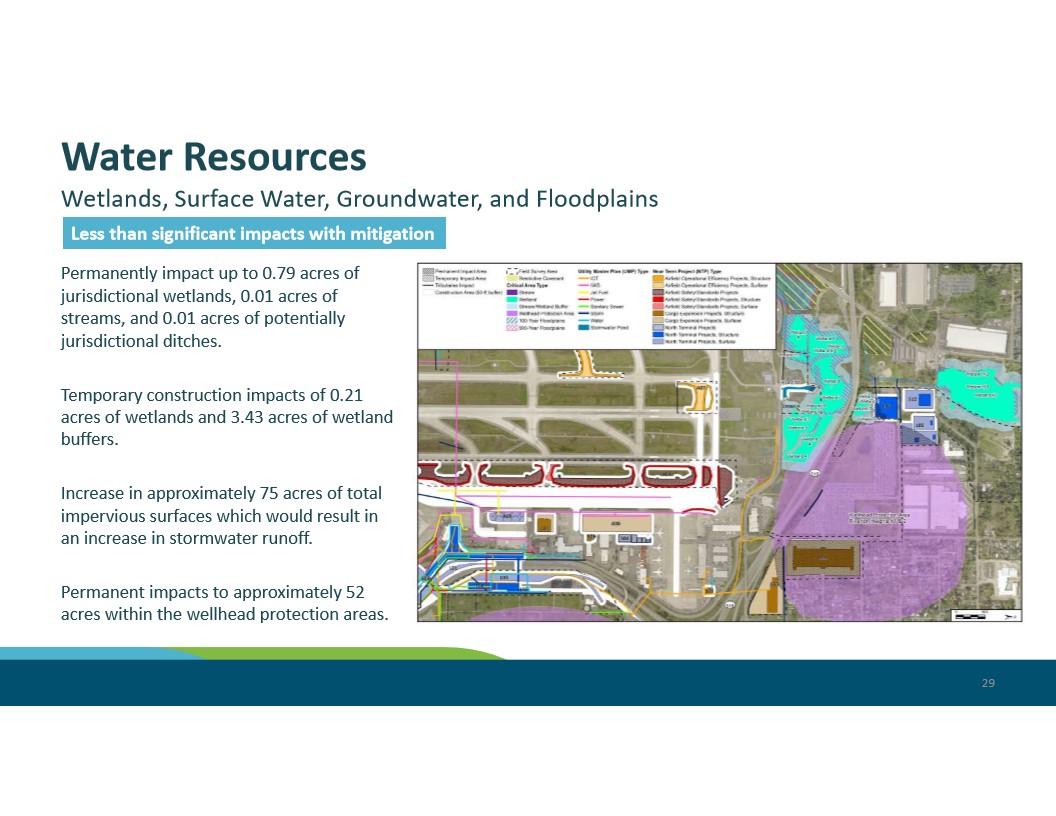
Slide 29 from what appears to be a Sea-Tac Airport Environmental Impact Statement presentation, summarizing water resource impacts including permanent impacts to 0.79 acres of jurisdictional wetlands, temporary construction impacts of 0.21 acres of wetlands and 3.43 acres of wetland buffers, an increase of approximately 75 acres of impervious surfaces, and permanent impacts to approximately 52 acres within wellhead protection areas. The overall finding is ‘Less than significant impacts with mitigation.’
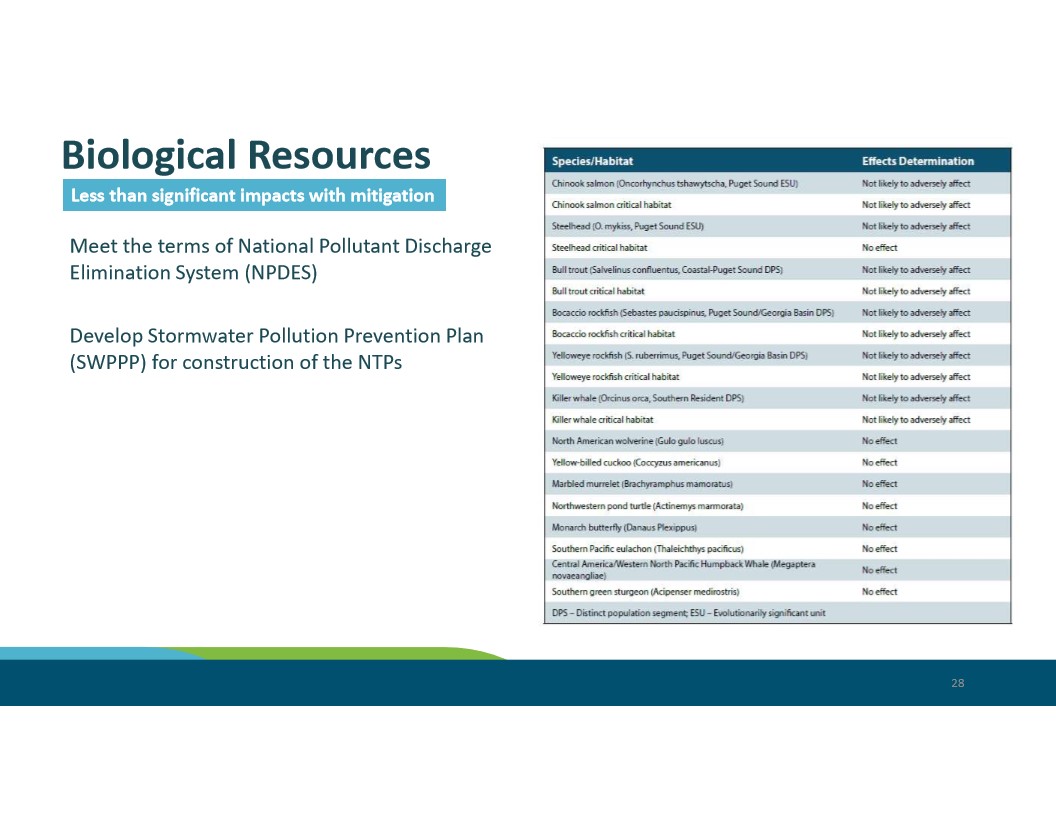
A presentation slide titled ‘Biological Resources’ states impacts are ‘Less than significant with mitigation’ and lists mitigation measures including NPDES compliance and a Stormwater Pollution Prevention Plan (SWPPP) for construction of NTPs. A table on the right lists species and habitats such as Chinook salmon, Steelhead, Bull trout, Killer whale, and Monarch butterfly with effects determinations of ‘Not likely to adversely affect’ or ‘No effect.’
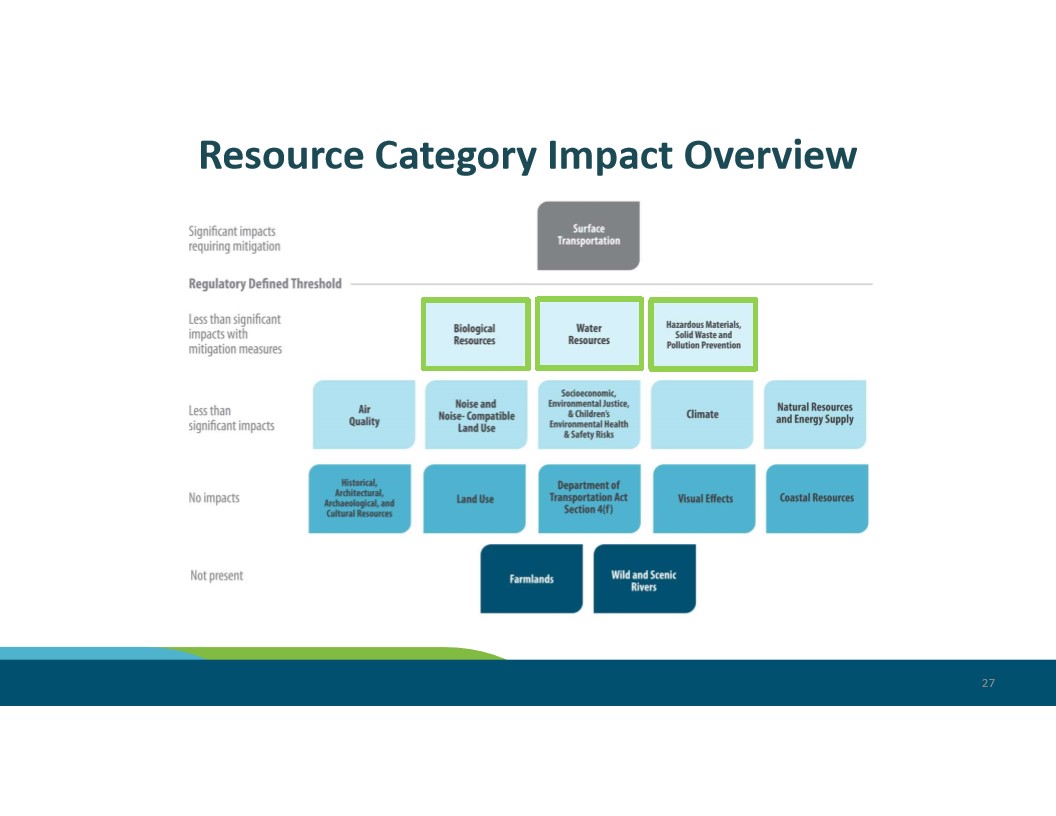
A presentation slide titled ‘Resource Category Impact Overview’ displaying a tiered impact classification chart. Categories range from ‘Significant impacts requiring mitigation’ (Surface Transportation) down through ‘Less than significant impacts with mitigation measures’ (Biological Resources, Water Resources, Hazardous Materials/Solid Waste/Pollution Prevention), ‘Less than significant impacts,’ ‘No impacts,’ and ‘Not present’ (Farmlands, Wild and Scenic Rivers).
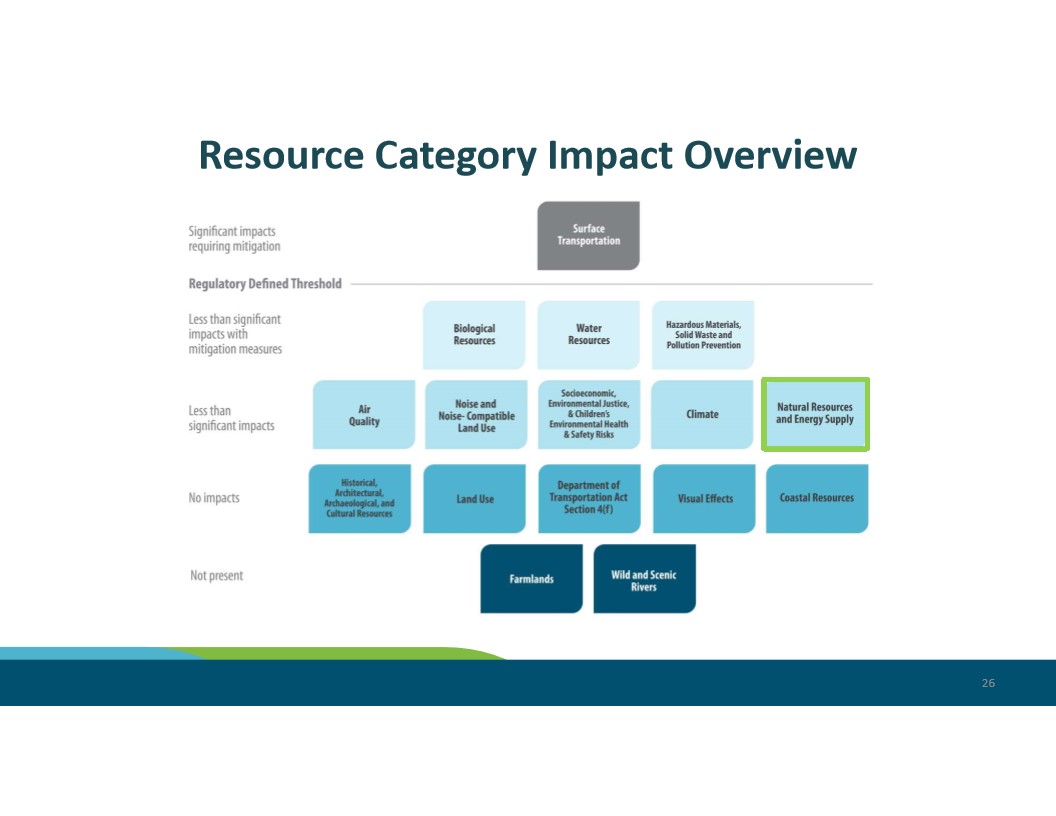
A presentation slide titled ‘Resource Category Impact Overview’ displaying a matrix of environmental resource categories organized by impact level, ranging from ‘Significant impacts requiring mitigation’ (Surface Transportation) down through ‘Less than significant,’ ‘No impacts,’ and ‘Not present’ categories including Biological Resources, Water Resources, Air Quality, Climate, Natural Resources and Energy Supply, and others. The slide is numbered 26 and uses a color-coded layout typical of an environmental impact assessment document.
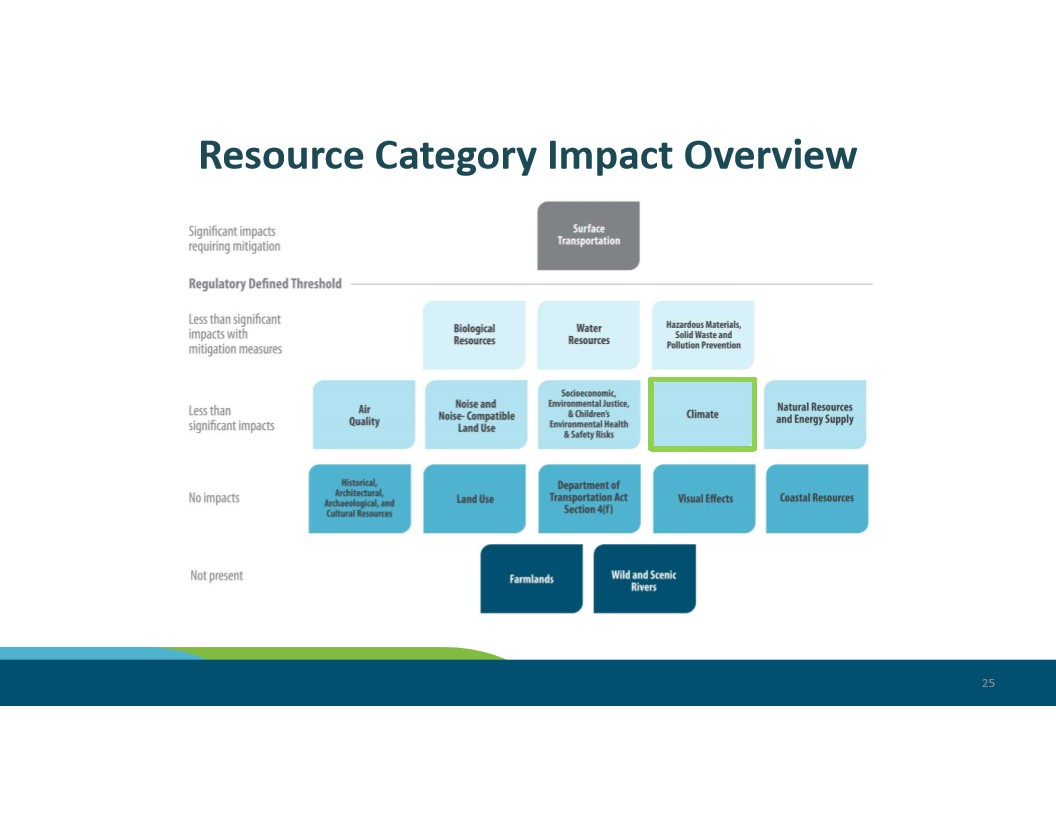
A presentation slide titled ‘Resource Category Impact Overview’ organizing environmental resource categories into impact tiers ranging from ‘Significant impacts requiring mitigation’ (Surface Transportation) down through ‘Less than significant impacts,’ ‘No impacts,’ and ‘Not present.’ Climate is highlighted with a green border under ‘Less than significant impacts,’ and Farmlands and Wild and Scenic Rivers are marked as ‘Not present.’
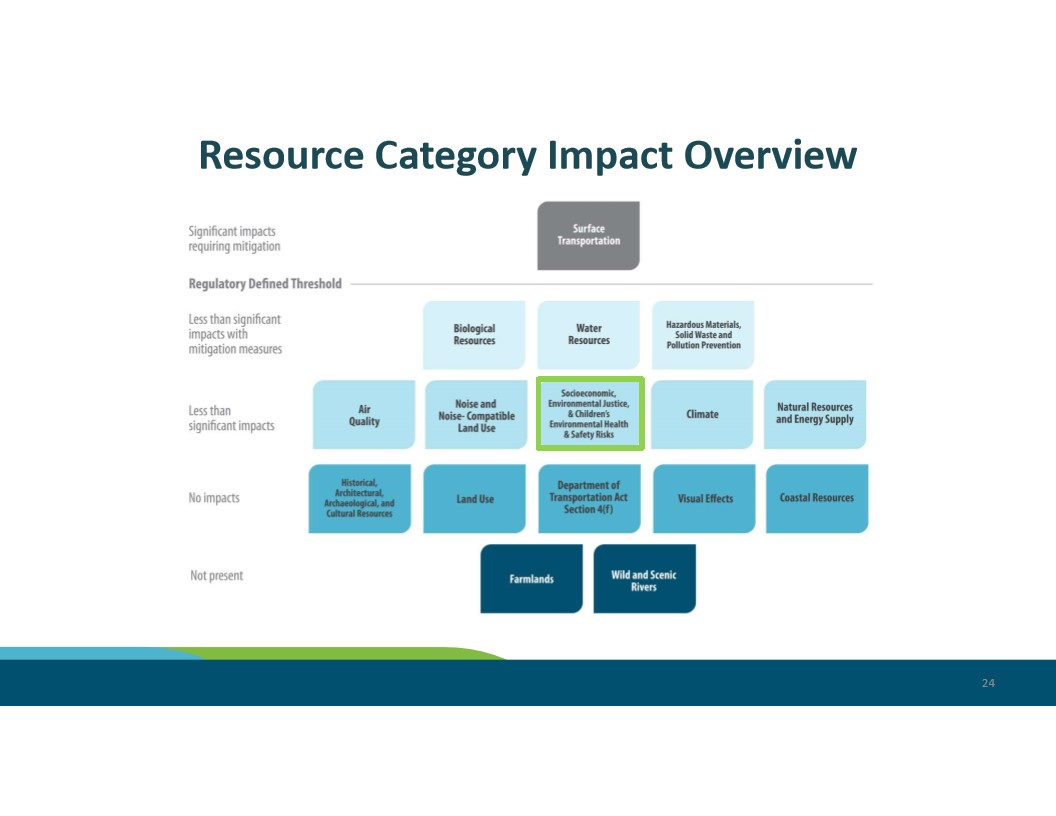
A presentation slide titled ‘Resource Category Impact Overview’ displaying a tiered impact matrix categorizing environmental resource areas by level of significance, ranging from ‘Significant impacts requiring mitigation’ (Surface Transportation) down to ‘Not present’ (Farmlands; Wild and Scenic Rivers). Categories include Biological Resources, Water Resources, Air Quality, Climate, Land Use, Visual Effects, and Socioeconomic/Environmental Justice among others, with the latter highlighted in a green border under ‘Less than significant impacts.’
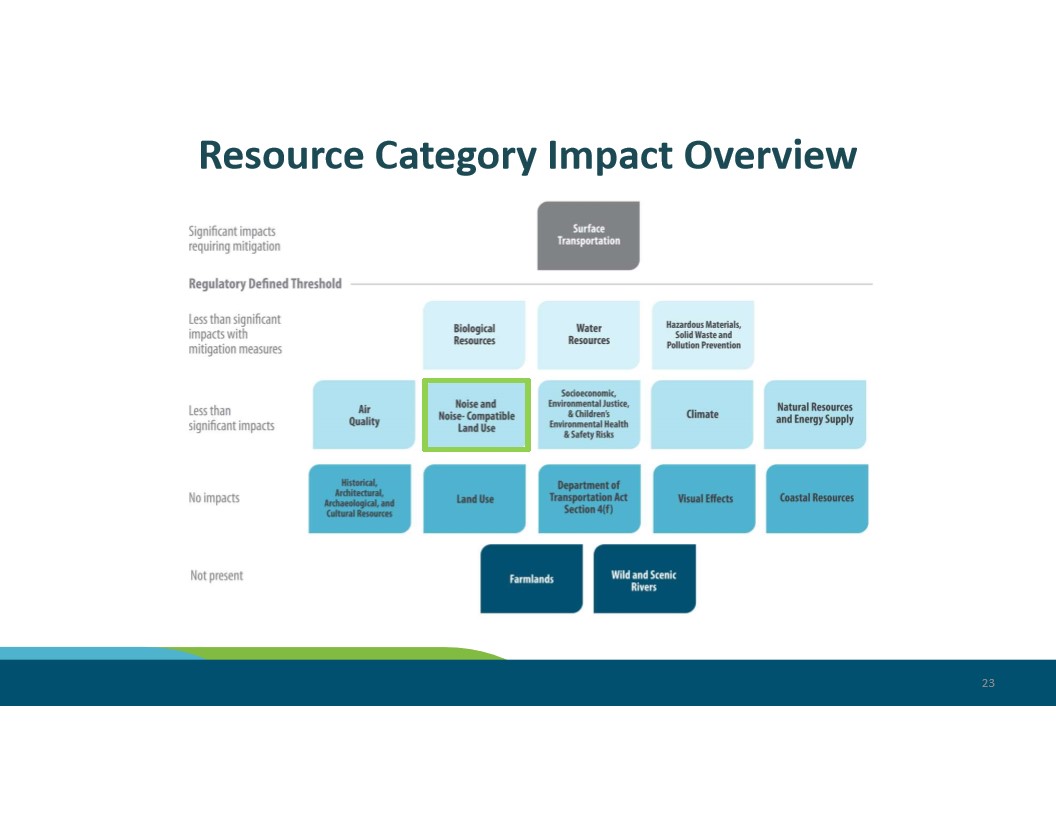
A presentation slide titled ‘Resource Category Impact Overview’ displaying a tiered impact matrix categorizing environmental resource areas from ‘Significant impacts requiring mitigation’ (Surface Transportation) down through ‘Less than significant,’ ‘No impacts,’ and ‘Not present’ (Farmlands, Wild and Scenic Rivers). Categories include Biological Resources, Water Resources, Noise and Noise-Compatible Land Use, Climate, Visual Effects, and Coastal Resources, among others.
A presentation slide titled ‘Resource Category Impact Overview’ categorizes environmental resource impacts into five tiers: significant impacts requiring mitigation (Surface Transportation), less than significant with mitigation (Biological Resources, Water Resources, Hazardous Materials), less than significant (Air Quality, Noise, Climate, etc.), no impacts (Land Use, Visual Effects, Coastal Resources, etc.), and not present (Farmlands, Wild and Scenic Rivers). No organization logo or project name is visible on this slide.
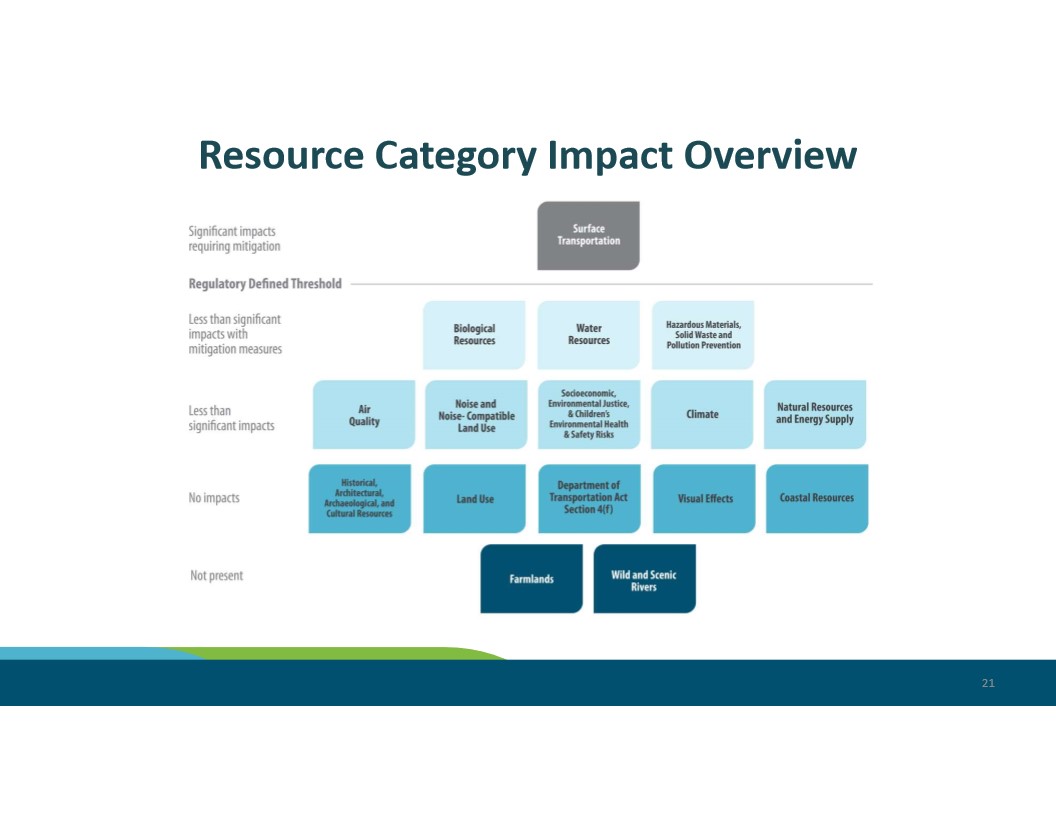
A presentation slide titled ‘Resource Category Impact Overview’ showing a tiered matrix of environmental resource categories ranked by impact level, from ‘Significant impacts requiring mitigation’ (Surface Transportation) down through ‘Less than significant impacts with mitigation measures,’ ‘Less than significant impacts,’ ‘No impacts,’ and ‘Not present’ (Farmlands, Wild and Scenic Rivers). The slide appears to be from an environmental impact or NEPA-related assessment document, page 21.
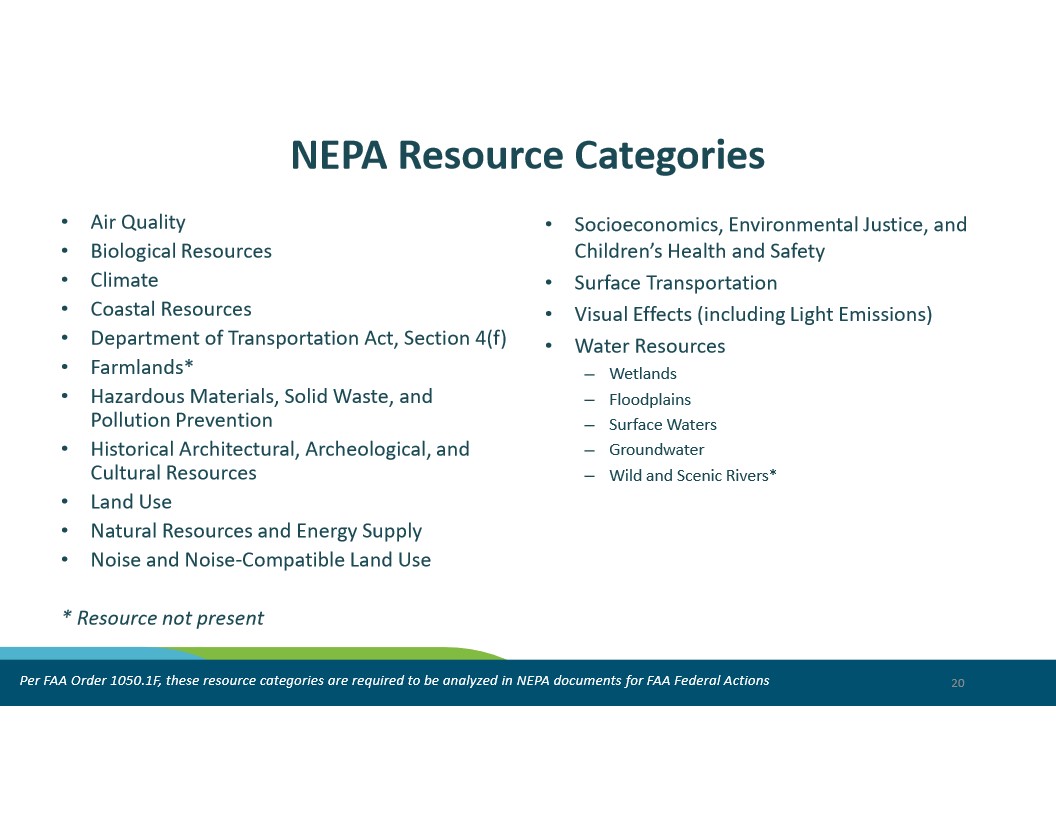
This slide lists the NEPA resource categories required to be analyzed in environmental documents for FAA Federal Actions per FAA Order 1050.1F. Categories include Air Quality, Biological Resources, Climate, Coastal Resources, Noise and Noise-Compatible Land Use, Water Resources (with subcategories), and others; items marked with an asterisk (Farmlands, Wild and Scenic Rivers) are noted as resources not present.
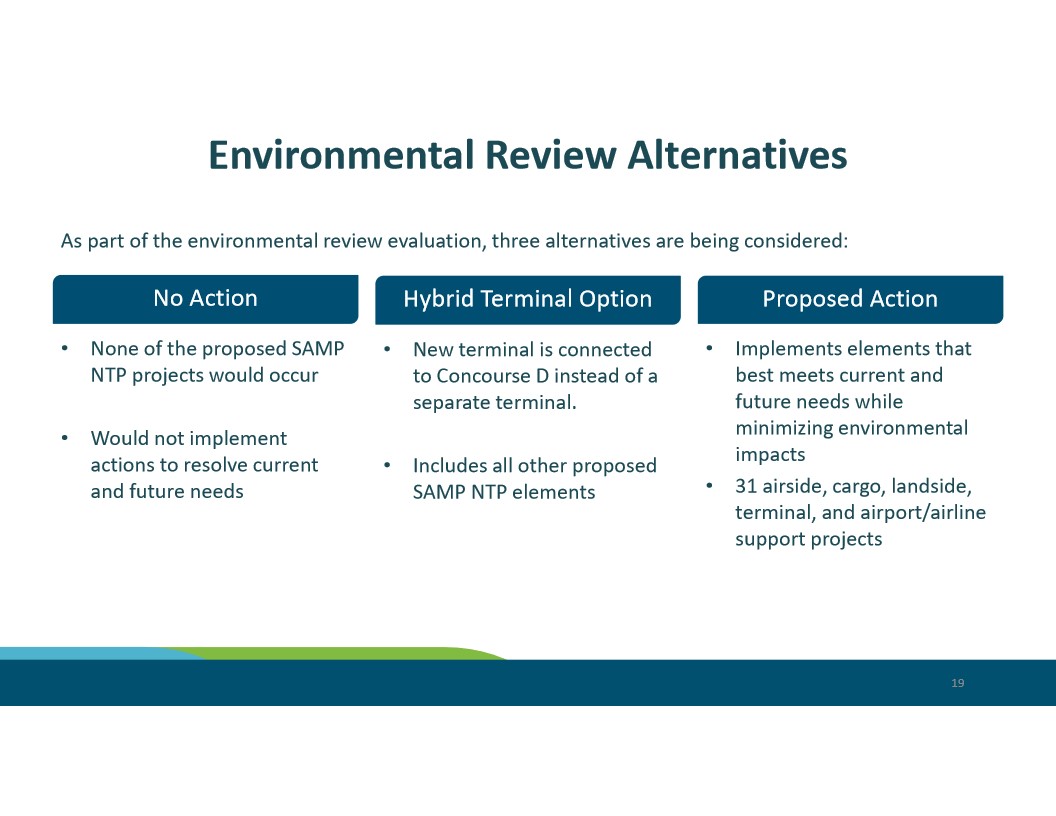
Slide 19 from a Sea-Tac Airport presentation outlines three alternatives under the Sustainable Airport Master Plan (SAMP) Near-Term Projects (NTP) environmental review evaluation: No Action (no SAMP NTP projects occur), Hybrid Terminal Option (new terminal connected to Concourse D), and Proposed Action (31 airside, cargo, landside, terminal, and airport/airline support projects minimizing environmental impacts).
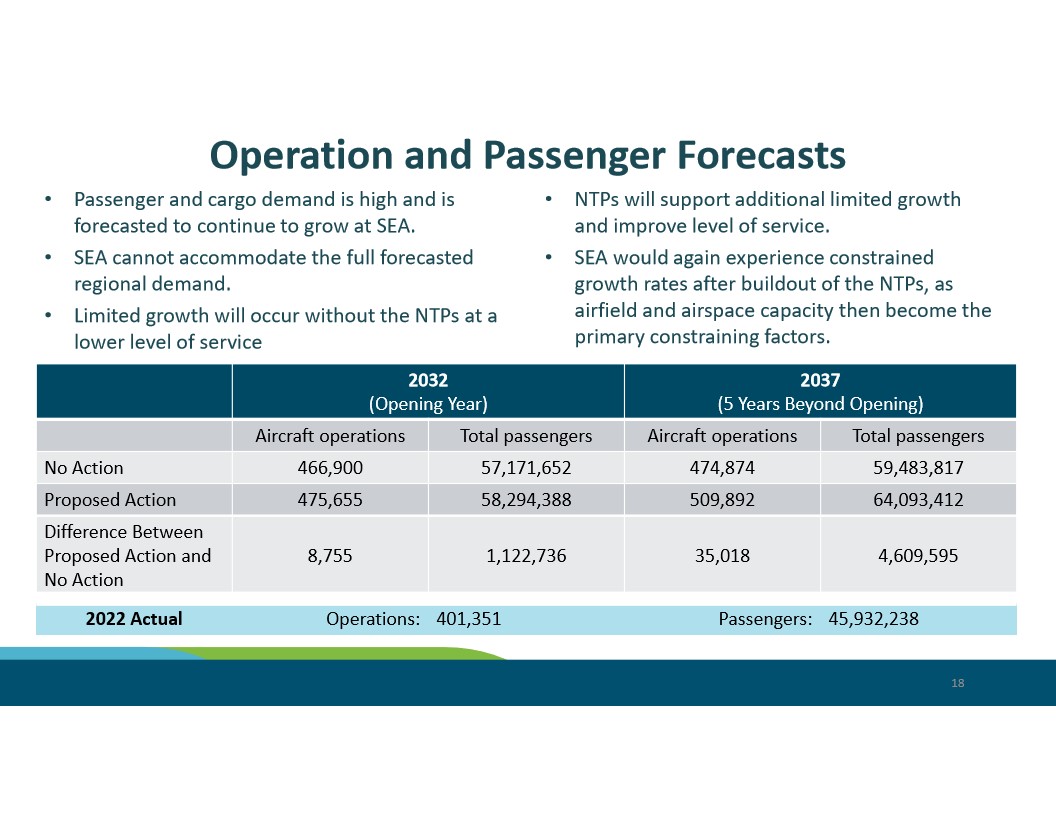
Slide 18 from a Sea-Tac Airport planning presentation showing operation and passenger forecast data for 2032 (opening year) and 2037 (5 years beyond opening) under ‘No Action’ and ‘Proposed Action’ (NTP – New Terminal/Concourse Program) scenarios. The 2022 actual baseline shows 401,351 operations and 45,932,238 passengers, with the Proposed Action projecting 509,892 operations and 64,093,412 total passengers by 2037.
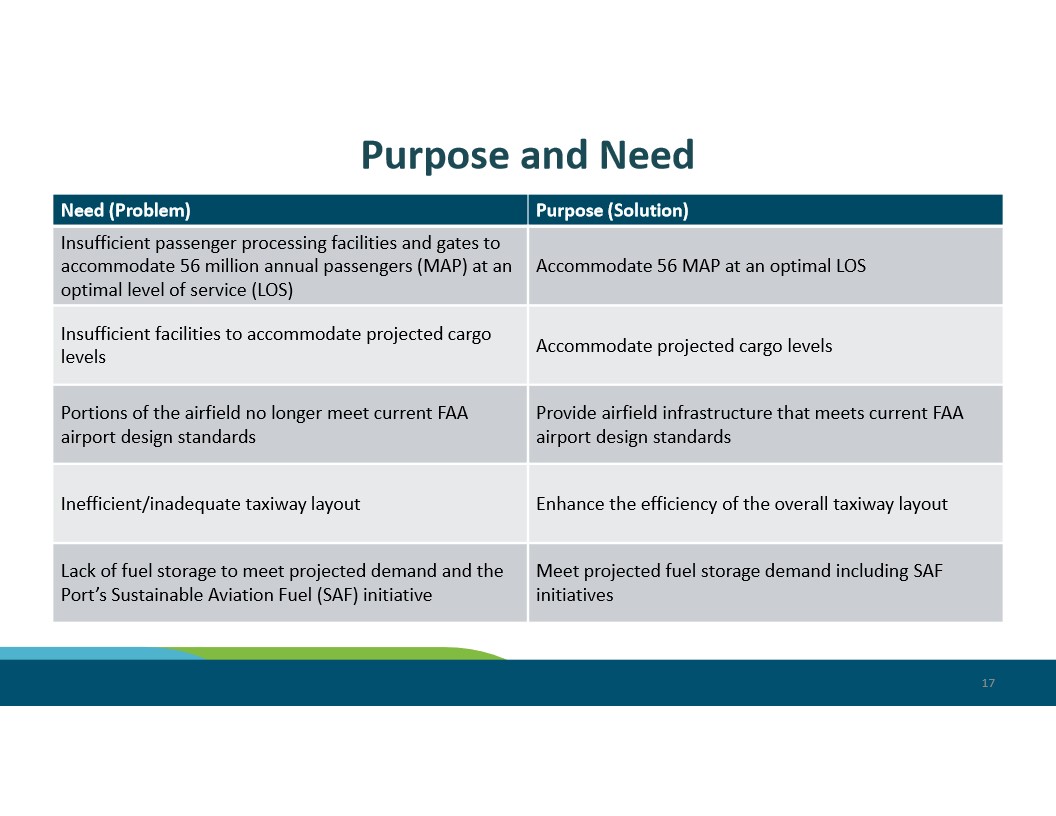
Slide 17 from a Sea-Tac Airport planning presentation outlines five needs and corresponding purposes, including accommodating 56 million annual passengers at an optimal level of service, meeting projected cargo levels, bringing airfield infrastructure into compliance with current FAA airport design standards, improving taxiway layout efficiency, and addressing fuel storage needs including the Port’s Sustainable Aviation Fuel (SAF) initiative.
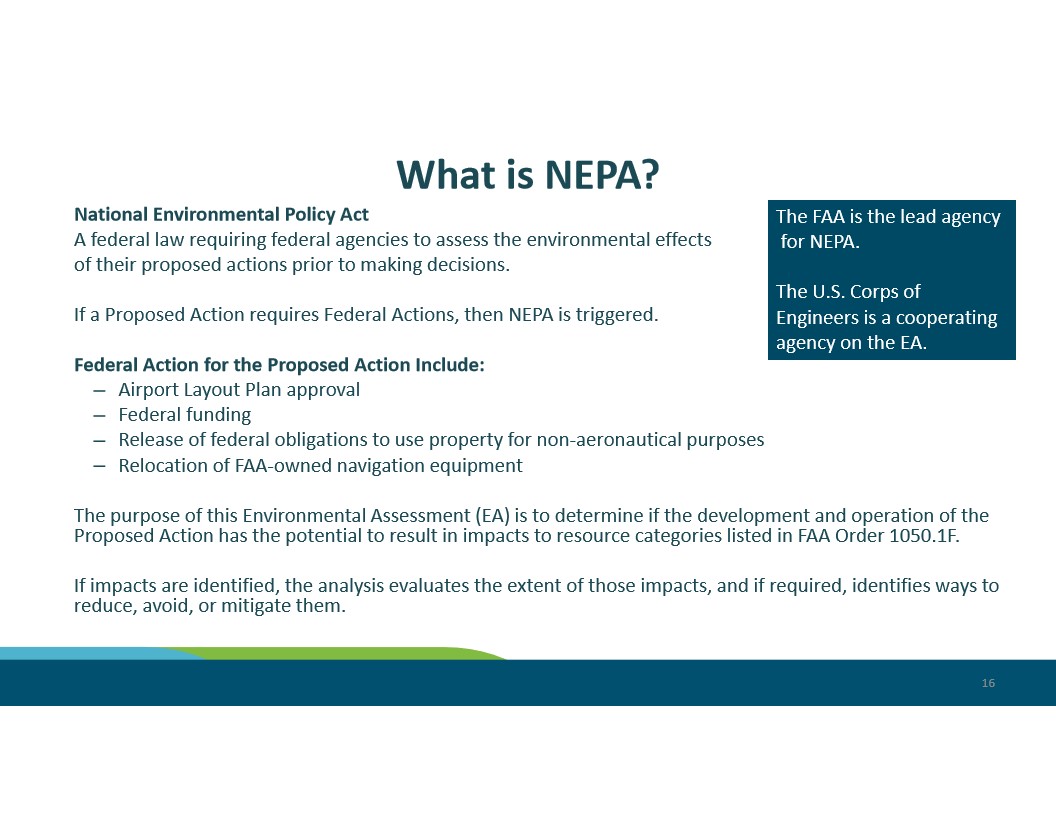
Slide 16 from an FAA-led Environmental Assessment (EA) presentation explaining the National Environmental Policy Act (NEPA), noting the FAA as lead agency and the U.S. Army Corps of Engineers as cooperating agency. It outlines federal actions triggering NEPA review—including Airport Layout Plan approval, federal funding, and relocation of FAA-owned navigation equipment—and references FAA Order 1050.1F as the governing framework for resource impact categories.
Our Take
Given the Port’s recent focus on being “The Greenest Airport In America”, we consider this a high point in cynicism. Everyone is following the rules. Everyone is sincerely trying to work within those rules. But notice that no one at that meeting questioned those rules. One can say that it is the FAA’s responsibility for not doing more. But since the Port of Seattle will benefit so greatly from the economic benefits of airport growth, this creates an intrinsic conflict of interest that they cannot or will not see past.
Growth?
Before the SAMP, the Port would insist that it did not control demand. That was never true. It has done everything possible to grow airport operations and it has been very successful in that regard, going from 17th to 8th largest airport in America in twelve years. For a short time post-COVID it was refreshing to hear the Airport acknowledge that desire to grow.
Now that the Draft EA has been published, it has re-started this untrue statement. They are not and never were responding to ‘organic regional demand’. This is extremely disappointing.
Property Tax Levy Presentation
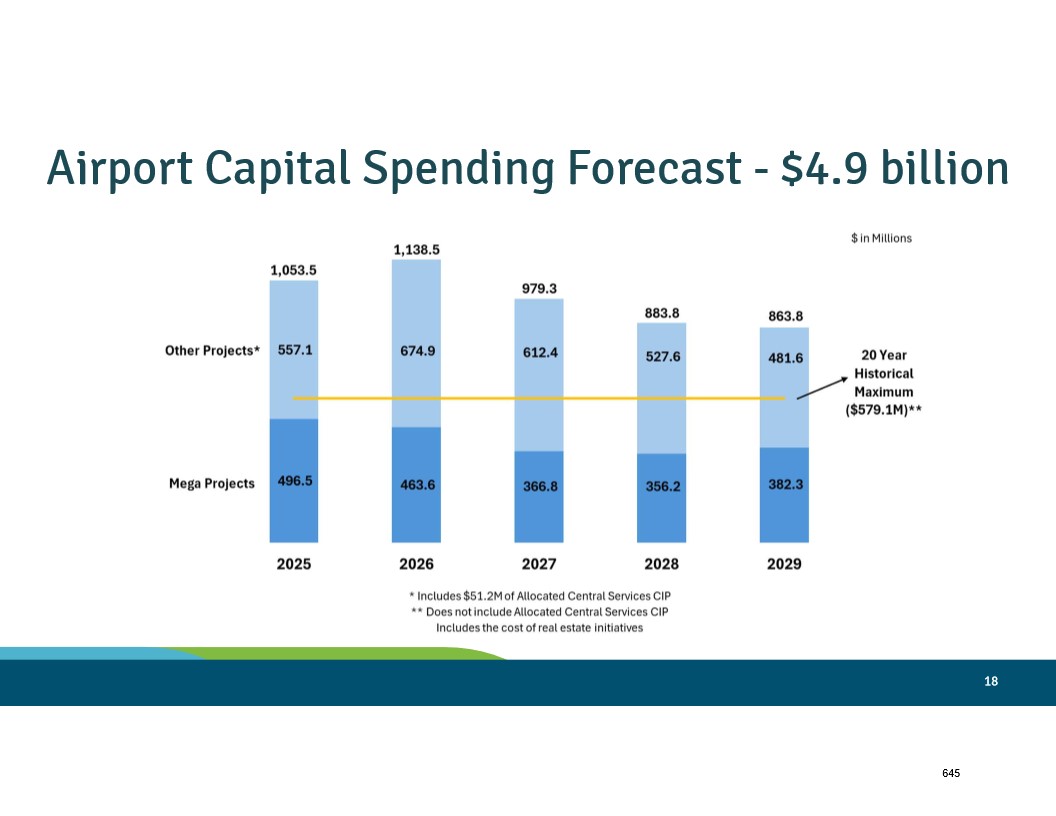
A bar chart from a Sea-Tac Airport presentation (slide 18) projects $4.9 billion in airport capital spending from 2025 through 2029, broken down annually into Mega Projects and Other Projects. Annual totals range from $863.8M (2029) to $1,138.5M (2026), with a reference line marking the 20-year historical maximum of $579.1M.
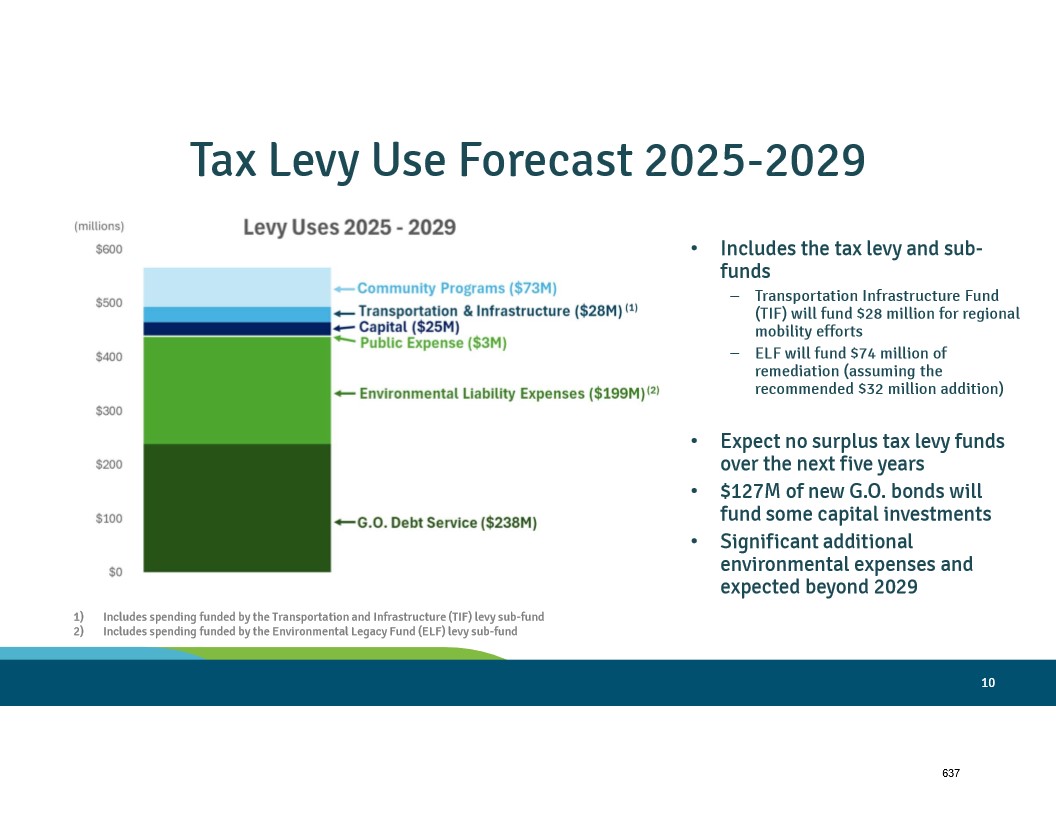
A presentation slide titled ‘Tax Levy Use Forecast 2025-2029’ showing a stacked bar chart of levy uses totaling approximately $565M, broken down into G.O. Debt Service ($238M), Environmental Liability Expenses ($199M), Public Expense ($3M), Capital ($25M), Transportation & Infrastructure ($28M), and Community Programs ($73M). Key notes indicate no surplus tax levy funds are expected over five years, $127M in new G.O. bonds will fund capital investments, and significant additional environmental expenses are anticipated beyond 2029.
Also discussed a proposed 2% increase to their Property Tax Levy. The Port uses that money in three broad manners:
Community grants. A relatively small amount of the Tax Levy is used to fund all their grant programs, including the annual $1.4M ILA with the City of SeaTac.
A larger amount is ongoing environmental mitigation for past bad acts, primarily the Duwamish Superfund cleanup. Zero of that is aviation community.
Over two thirds every year is used to accelerate bond re-payments. The Port finances many of its major capital projects through billions of dollars in ongoing bond sales. Using $50M of this money every year to pay off those bonds early saves literally hundreds of millions in interest over time. A way to think of it is how much money a homeowner can save on their mortgage by paying even a few dollars extra every month.
We use cookies to provide basic functionality. We also provide access to search engines in order to provide site analytics. We do not sell or share your data.