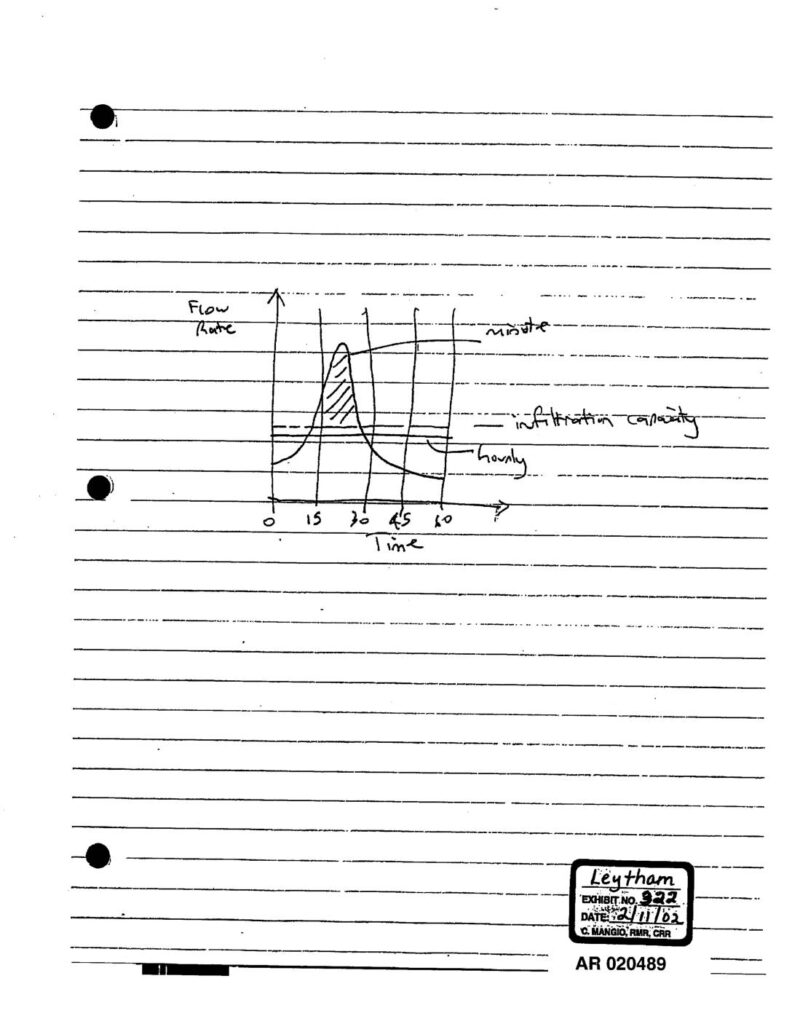
This document, marked as Leytham Exhibit 222 (dated 2/11/02), contains a hand-drawn diagram illustrating flow rate over time, showing the relationship between minute and hourly measurements alongside an infiltration capacity curve. The sketch plots flow rate on the vertical axis against time intervals (15, 30, 45, 60 minutes) on the horizontal axis, with a shaded area indicating peak flow. It appears to be a technical exhibit related to stormwater or drainage analysis presented in proceedings concerning Sea-Tac Airport policy.Open full document
Notes
Exhibit 322 (AR 020489), entered 2/11/02 before the Pollution Control Hearings Board (PCHB), Third Runway EIS proceeding, examiner C. Mangio RMR CRR. Handwritten diagram on notebook paper showing a flow rate vs. time graph with three labeled curves: ‘minute,’ ‘hourly,’ and ‘infiltration capacity.’ Time axis marked at 15, 30, 45, 60 minutes. Hatched area indicates flow rate exceedance above infiltration capacity. Document identifier DPEX004321, Administrative Record AR 020489.