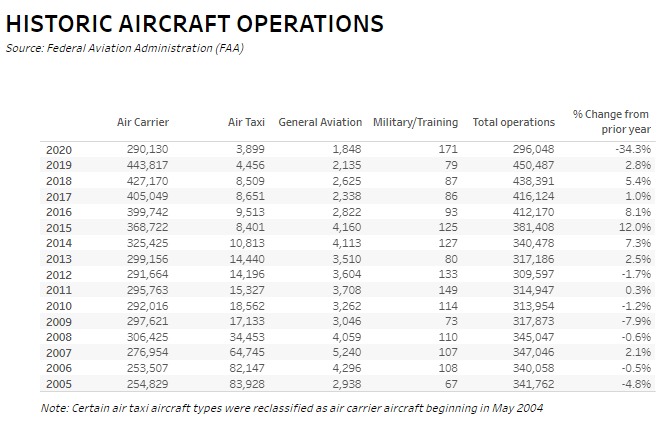
A data table sourced from the Federal Aviation Administration (FAA) showing historic aircraft operations from 2005 to 2020, broken down by Air Carrier, Air Taxi, General Aviation, and Military/Training categories, along with total operations and percent change from prior year. The table shows a sharp -34.3% decline in total operations in 2020, dropping to 296,048, compared to 450,487 in 2019.Open full document
Notes
A data table sourced from the Federal Aviation Administration (FAA) showing historic aircraft operations from 2005 to 2020, broken down by Air Carrier, Air Taxi, General Aviation, and Military/Training categories, along with total operations and percent change from prior year. The table shows a sharp -34.3% decline in total operations in 2020, dropping to 296,048, compared to 450,487 in 2019.