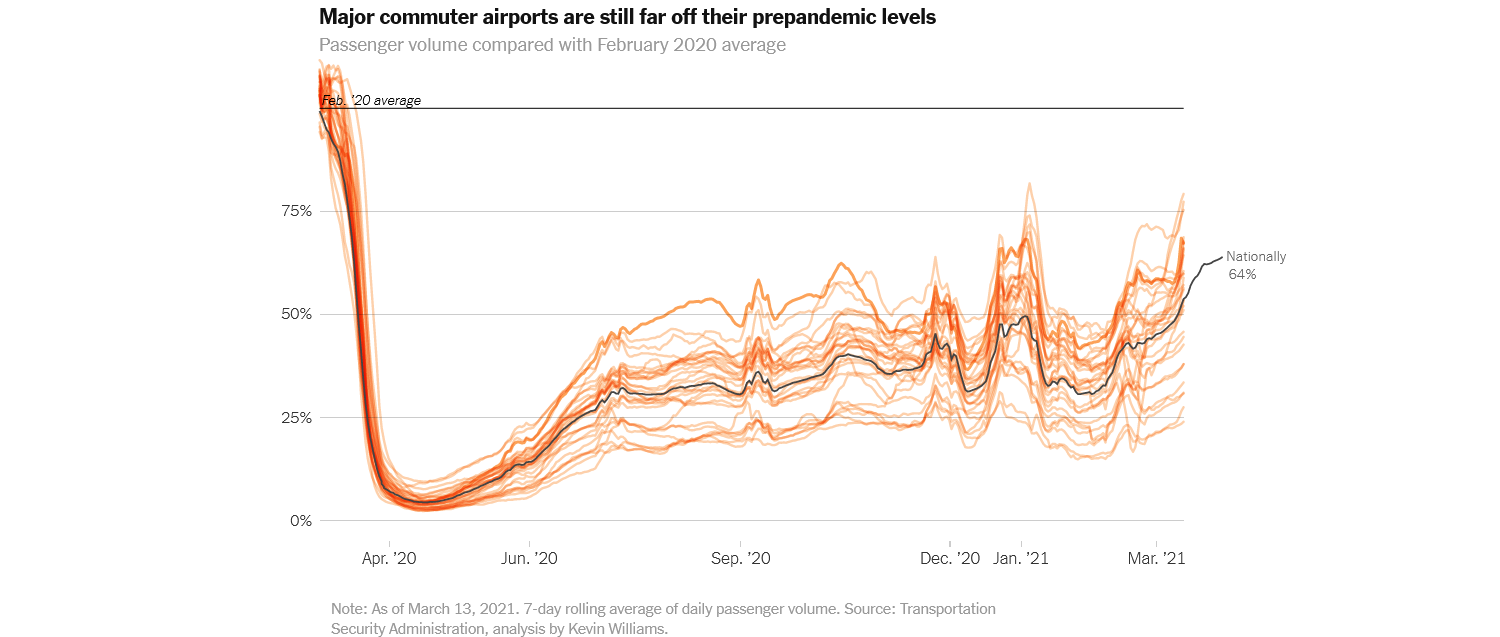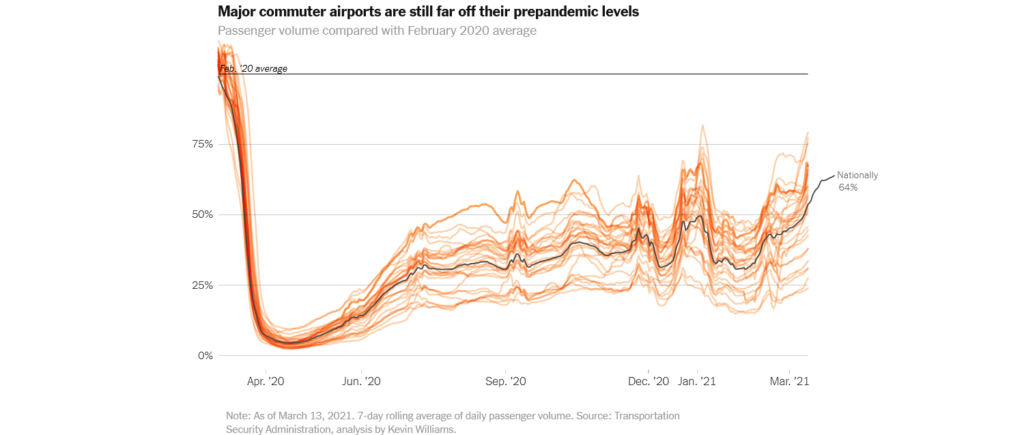
Chart from Transportation Security Administration data (analyzed by Kevin Williams, as of March 13, 2021) showing 7-day rolling average of daily passenger volume at major commuter airports compared to February 2020 average. National passenger volume reached 64% of pre-pandemic levels by mid-March 2021, with individual airports shown as orange lines ranging from approximately 25% to 75% of pre-pandemic levels.Open full document
Notes
Chart from Transportation Security Administration data (analyzed by Kevin Williams, as of March 13, 2021) showing 7-day rolling average of daily passenger volume at major commuter airports compared to February 2020 average. National passenger volume reached 64% of pre-pandemic levels by mid-March 2021, with individual airports shown as orange lines ranging from approximately 25% to 75% of pre-pandemic levels.