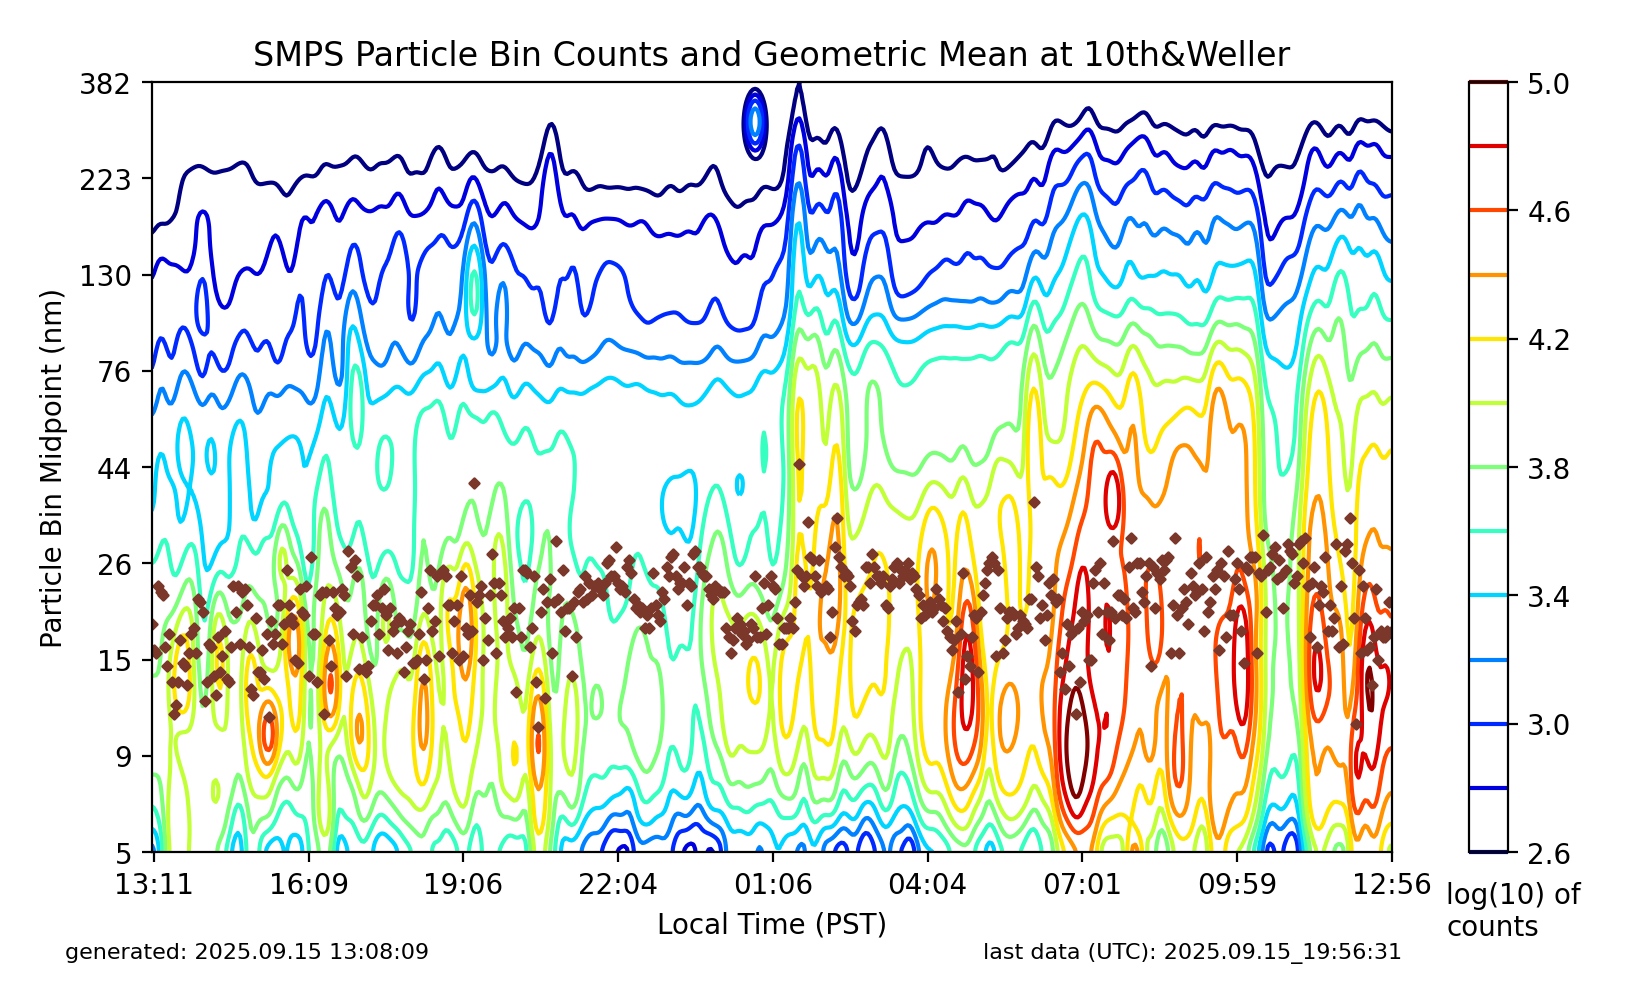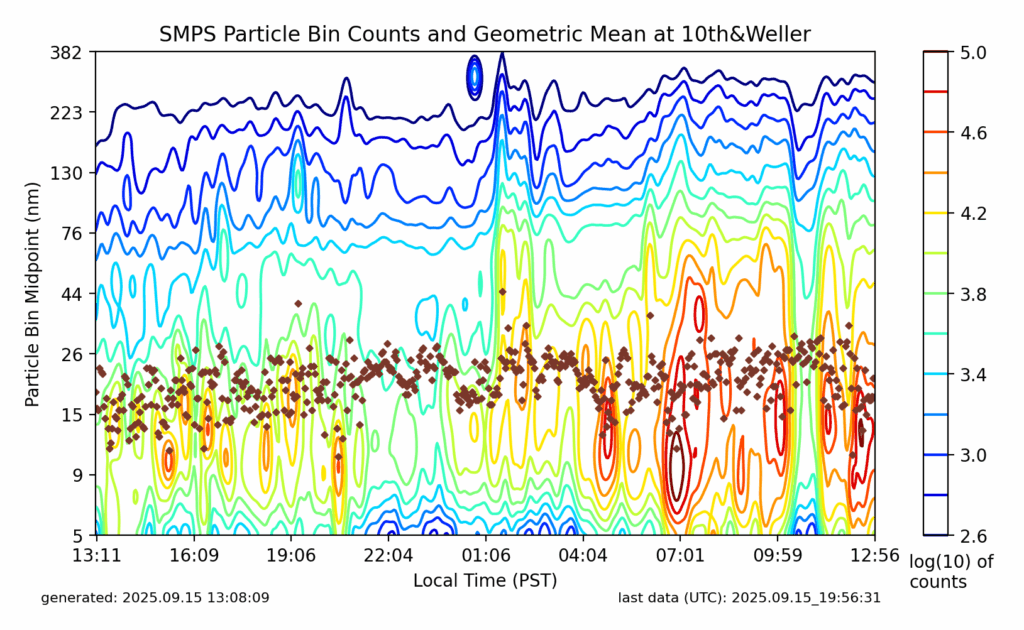
This plot shows Scanning Mobility Particle Sizer (SMPS) aerosol particle size distribution data (5–382 nm) collected at the 10th & Weller monitoring site, generated on 2025-09-15 at 13:08:09 PST with last UTC data timestamp of 2025-09-15 19:56:31. The contour plot displays log(10) particle counts over local PST time from approximately 13:11 on September 14 through 12:56 on September 15, with brown diamond markers indicating the geometric mean particle diameter over time.Open full document
Notes
A scientific chart showing SMPS (Scanning Mobility Particle Sizer) particle bin count measurements and geometric mean data collected at the 10th & Weller monitoring location over a 24-hour period. The contour plot displays particle size distribution data from 5nm to 382nm, with logarithmic color scaling showing particle concentrations from September 15, 2025.