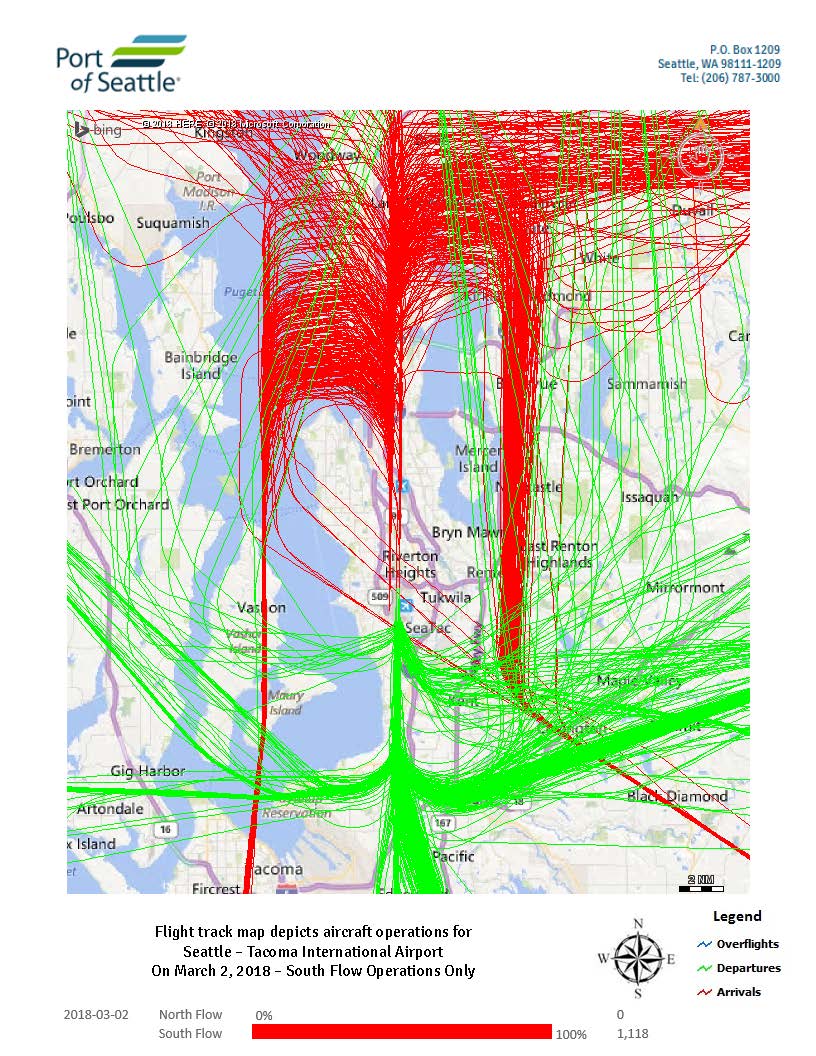
Port of Seattle flight track map depicting aircraft operations at Seattle-Tacoma International Airport on March 2, 2018, showing South Flow Operations Only (100%, 1,118 operations). Green lines represent departures, red lines represent arrivals, and blue lines represent overflights, with tracks concentrated along the north-south runway axis over Puget Sound and surrounding communities.Open full document
Notes
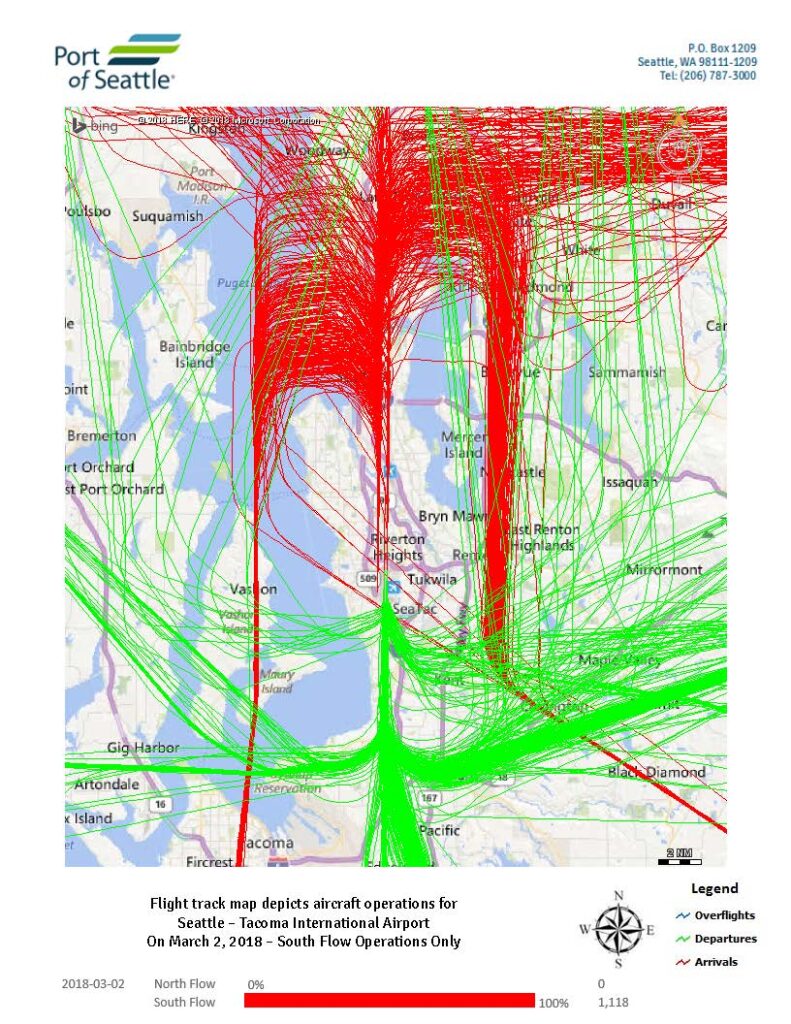
Port of Seattle flight track map depicting aircraft operations at Seattle-Tacoma International Airport on March 2, 2018, showing South Flow Operations Only (100%, 1,118 operations). Green lines represent departures, red lines represent arrivals, and blue lines represent overflights, with tracks concentrated along the north-south runway axis over Puget Sound and surrounding communities.